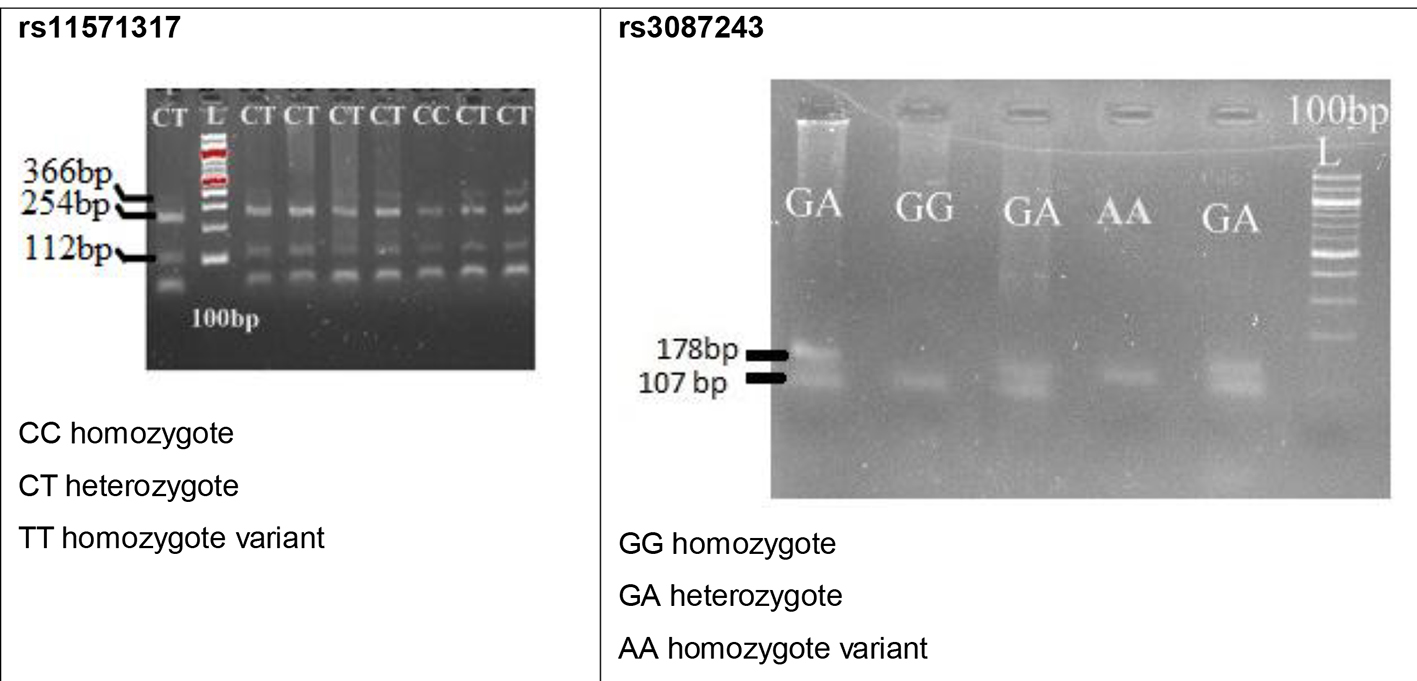
Figure 1. Gel images of selected polymorphisms in the present study.
| World Journal of Oncology, ISSN 1920-4531 print, 1920-454X online, Open Access |
| Article copyright, the authors; Journal compilation copyright, World J Oncol and Elmer Press Inc |
| Journal website http://www.wjon.org |
Original Article
Volume 8, Number 5, October 2017, pages 162-170
CTLA-4 Genetic Variants (rs11571317 and rs3087243): Role in Susceptibility and Progression of Breast Cancer
Figures
Tables
| Clinical parameters | Values |
|---|---|
| Tumor stage | |
| T1-2 | 160 (56) |
| T3-4 | 125 (44) |
| Lymph node status | |
| LN-ve | 48 (17) |
| LN+ve | 237 (83) |
| Metastatic | |
| M0 | 237 (82) |
| M1 | 48 (18) |
| Duration of disease | |
| < 6 months | 150 (52) |
| 7 - 12 months | 83 (29) |
| > 12 months | 52 (19) |
| DOD | |
| < 6 months | |
| T1-2 | 100 (66) |
| T3-4 | 50 (44) |
| LN-ve | 34 (22) |
| LN+ve | 116 (78) |
| M0 | 130 (87) |
| M1 | 20 (13) |
| Category | Controls (N, %) | Breast cancer patients (N, %) | t-, z-test (P value) |
|---|---|---|---|
| *t-test: mean age, age at onset of breast cancer (years), and body mass index (kg/m2). z-test: age at marriage(years), age at first pregnancy, parity, consanguinity, familial incidence, diet, lactation, area of living, and occupation. | |||
| Mean age* | 285 48.45 ± 13.49 | 285 51.29 ± 10.75 | 0.005 |
| Range (years) | 18 - 90 | 25 - 86 | |
| Age at onset of breast cancer (years)* | 48.5 ± 11 | ||
| ≤ 48 | - | 142 (50) 40.50 ± 5.68 | - |
| > 48 | - | 143 (50) 57.64 ± 7.09 | - |
| Age at marriage (years) | |||
| ≤ 18 | 179 (62) | 185 (64) | 0.69 |
| 19 - 30 | 105 (37) | 93 (33) | 0.55 |
| > 30 | 1 (0.3) | 7 (3) | - |
| Unmarried | 0 (0) | 0 (0) | - |
| Age at first pregnancy | |||
| ≤ 18 | 138 (48) | 107 (37) | 0.08 |
| 19 - 30 | 144 (50) | 157 (54) | 0.48 |
| > 30 | 3 (2) | 9 (3) | 0.92 |
| 0 | 0 (0) | 12 (4) | - |
| Parity | |||
| Parous | 285 (100) | 273 (95) | < 0.01 |
| Nulliparous | 0 (0) | 12 (5) | - |
| Consanguinity | |||
| Yes | 0 (0) | 29 (10) | - |
| No | 285 (100) | 256 (98) | < 0.01 |
| Familial incidence | |||
| No | 206 (72) | - | |
| BC | 15 (5) | - | |
| Other cancer | 29 (10) | - | |
| Life style-related diseases | 35 (12) | - | |
| Variables | |||
| Diet | |||
| Vegetarians | 35 (12) | 40 (14) | 0.79 |
| Non-vegetarians | 250 (88) | 245 (86) | 0.50 |
| Body mass index (kg/m2)* | 24.5 ± 3.8 | 24.9 ± 5 | 0.23 |
| < 25 | 176 (61) 22.2 ± 1.9 | 140 (49) 21.3 ± 2 | < 0.01 |
| ≥ 25 | 108 (39) 28.27 ± 3.1 | 145 (51) 27.8 ± 3.2 | 0.19 |
| Breast feeding | |||
| Yes | 200 (100) | 279 (98) | < 0.01 |
| No | 0 (0) | 6 (2) | - |
| Area of living | |||
| Rural | 95 (33) | 66 (23) | 0.16 |
| Urban | 190 (66) | 219 (77) | < 0.01 |
| Occupation | |||
| Housewives | 107 (37) | 165 (58) | < 0.01 |
| Agriculture workers | 177 (62) | 120 (42) | < 0.01 |
| rs11571317 | CC, N (%) | CT, N (%) | TT, N (%) | χ2 value (P-value) | Minor allele frequency T | Group comparison | OR (95% CI) | P-value |
|---|---|---|---|---|---|---|---|---|
| Controls (285) Patients (285) | 39 (13.5) 89 (31.1) | 246 (86.5) 196 (68.9) | 0 (0) 0 (0) | 24.19 (< 0.01) | 0.43 0.34 | CC vs. others CT vs. others TT vs. others | 2.86 (1.80 - 4.36) 0.34 (0.22 - 0.53) - | < 0.01 < 0.01 - |
| HWE: controls: χ2 = 164.2 (P < 0.05); patients: χ2 = 78.2 (P < 0.05) | ||||||||
| Variables | CC vs. CT: OR (CI) | P-value | CT vs. CC: OR (CI) | P-value | ||||
| AAO | 1.05 (0.58 - 1.91) | 0.85 | 1.06 (0.58 - 1.92) | 0.83 | ||||
| Tumor status | 0.98 (0.50 - 1.91) | 0.96 | 0.98 (0.50 - 1.92) | 0.97 | ||||
| LN status | 1.86 (0.59 - 5.80) | 0.28 | 1.26 (0.57 - 2.79) | 0.55 | ||||
| Metastasis | 2.64 (0.92 - 7.60) | 0.07 | 2.64 (0.92 - 7.58) | 0.07 | ||||
| DOD < 6 months vs. > 6 months | 1.12 (0.61 - 2.07) | 0.69 | 1.15 (0.62 - 2.11) | 0.64 | ||||
| rs3087243 | GG, N (%) | GA, N (%) | AA, N (%) | χ2 value (P-value) | Minor allele frequency A | Group comparison | OR (95% CI) | P-value |
|---|---|---|---|---|---|---|---|---|
| Controls Patients | 74 (26) 71 (25) | 202 (71) 197 (70) | 9 (3) 17 (5) | 1.95 (= 0.376) | 0.39 0.41 | GG vs. others GA vs. others AA vs. others | 0.94 (0.64 - 1.37) 0.91 (0.64 - 1.31) 1.94 (0.85 - 4.4) | 0.84 0.71 0.15 |
| HWE: controls: χ2 = 69.9 (P < 0.05); patients: χ2 = 53.6 (P < 0.05) | ||||||||
| Variables | GG vs. GA + AA: OR (CI) | P-value | GA vs. GG + AA: OR (CI) | P-value | AA vs. GG + GA: OR (CI) | P-value | ||
| AAO | 1.44 (0.70 - 2.94) | 0.31 | 0.57 (0.30 - 1.08) | 0.08 | 1.86 (0.67 - 5.16) | 0.23 | ||
| Tumor status | 0.01 (0.0043 - 0.09) | < 0.01* | 6.28 (3.01 - 13.07) | < 0.01* | 3.46 (1.02 - 11.67) | 0.04* | ||
| LN status | 1.38 (0.61 - 3.11) | 0.43 | 0.68 (0.31 - 1.52) | 0.35 | 0.91 (0.17 - 4.90) | 0.91 | ||
| Metastasis | 0.97 (0.17 - 5.53) | 0.97 | 3.60 (0.94 - 13.78) | 0.06 | - | 0.99 | ||
| DOD < 6 months vs. > 6 months | (0.91 - 4.02) | 0.08 | 0.62 (0.32 - 1.19) | 0.15 | 0.84 (0.29 - 2.46) | 0.76 | ||
| Splice site type | Motif | New splice site | Wild type | Mutant | If cryptic site uses exon length variation | Variation (%) |
|---|---|---|---|---|---|---|
| DONOR | Aacgtgggt | AACatgggt | 78.53 | 51.7 | NA | SITE BROKEN -34.17 |
| Haplotype | Frequency | Odds ratio (95% CI) | P-value | ||||
|---|---|---|---|---|---|---|---|
| C-A | 0.3956 | 1.00 | - | ||||
| T-G | 0.3877 | 0.40 (0.25 - 0.62) | < 0.01 | ||||
| C-G | 0.2167 | 1.31 (0.91 - 1.89) | 0.15 | ||||
| Global haplotype association P-value < 0.0001 | |||||||
| S. no. | Haplotype | AAO < 48 years vs. > 49 years patients | Tumor size | LN status | Metastasis | DOD < 6 months vs. > 6 months | |
| C1 | C-G | 1.00 | 1.00 | 1.00 | 1.00 | 1.00 | |
| C2 | C-A | 2.00 (0.75 - 5.28) P > 0.05 | 3.61 (1.10 - 11.86) P < 0.05 | 2.61 (0.84 - 8.15) P > 0.05 | 0.35 (0.10 - 1.22) P > 0.05 | 0.24 (0.07 - 0.77) P < 0.05 | |
| C3 | T-G | 1.68 (0.68 - 4.14) P > 0.05 | 0.24 (0.03 - 1.67) P > 0.05 | 1.95 (0.60 - 6.34) P > 0.05 | 0.60 (0.13 - 2.87) P > 0.05 | 0.59 (0.19 - 1.79) P > 0.05 | |
| C4 | T-A | 0.65 (0.17 - 2.50) P > 0.05 | 15.81 (4.96 - 50.40) P < 0.05 | 2.13 (0.74 - 6.09) P > 0.05 | 3.98 (1.25 - 12.63) P < 0.05 | 0.67 (0.18 - 2.53) P > 0.05 | |