World Journal of Oncology, ISSN 1920-4531 print, 1920-454X online, Open Access
Article copyright, the authors; Journal compilation copyright, World J Oncol and Elmer Press Inc
Journal website http://www.wjon.org

Original Article

Volume 9, Number 1, February 2018, pages 13-20


Lymphocyte to Monocyte Ratio and Modified Glasgow Prognostic Score Predict Prognosis of Lung Adenocarcinoma Without Driver Mutation

Figures

Figure 1.
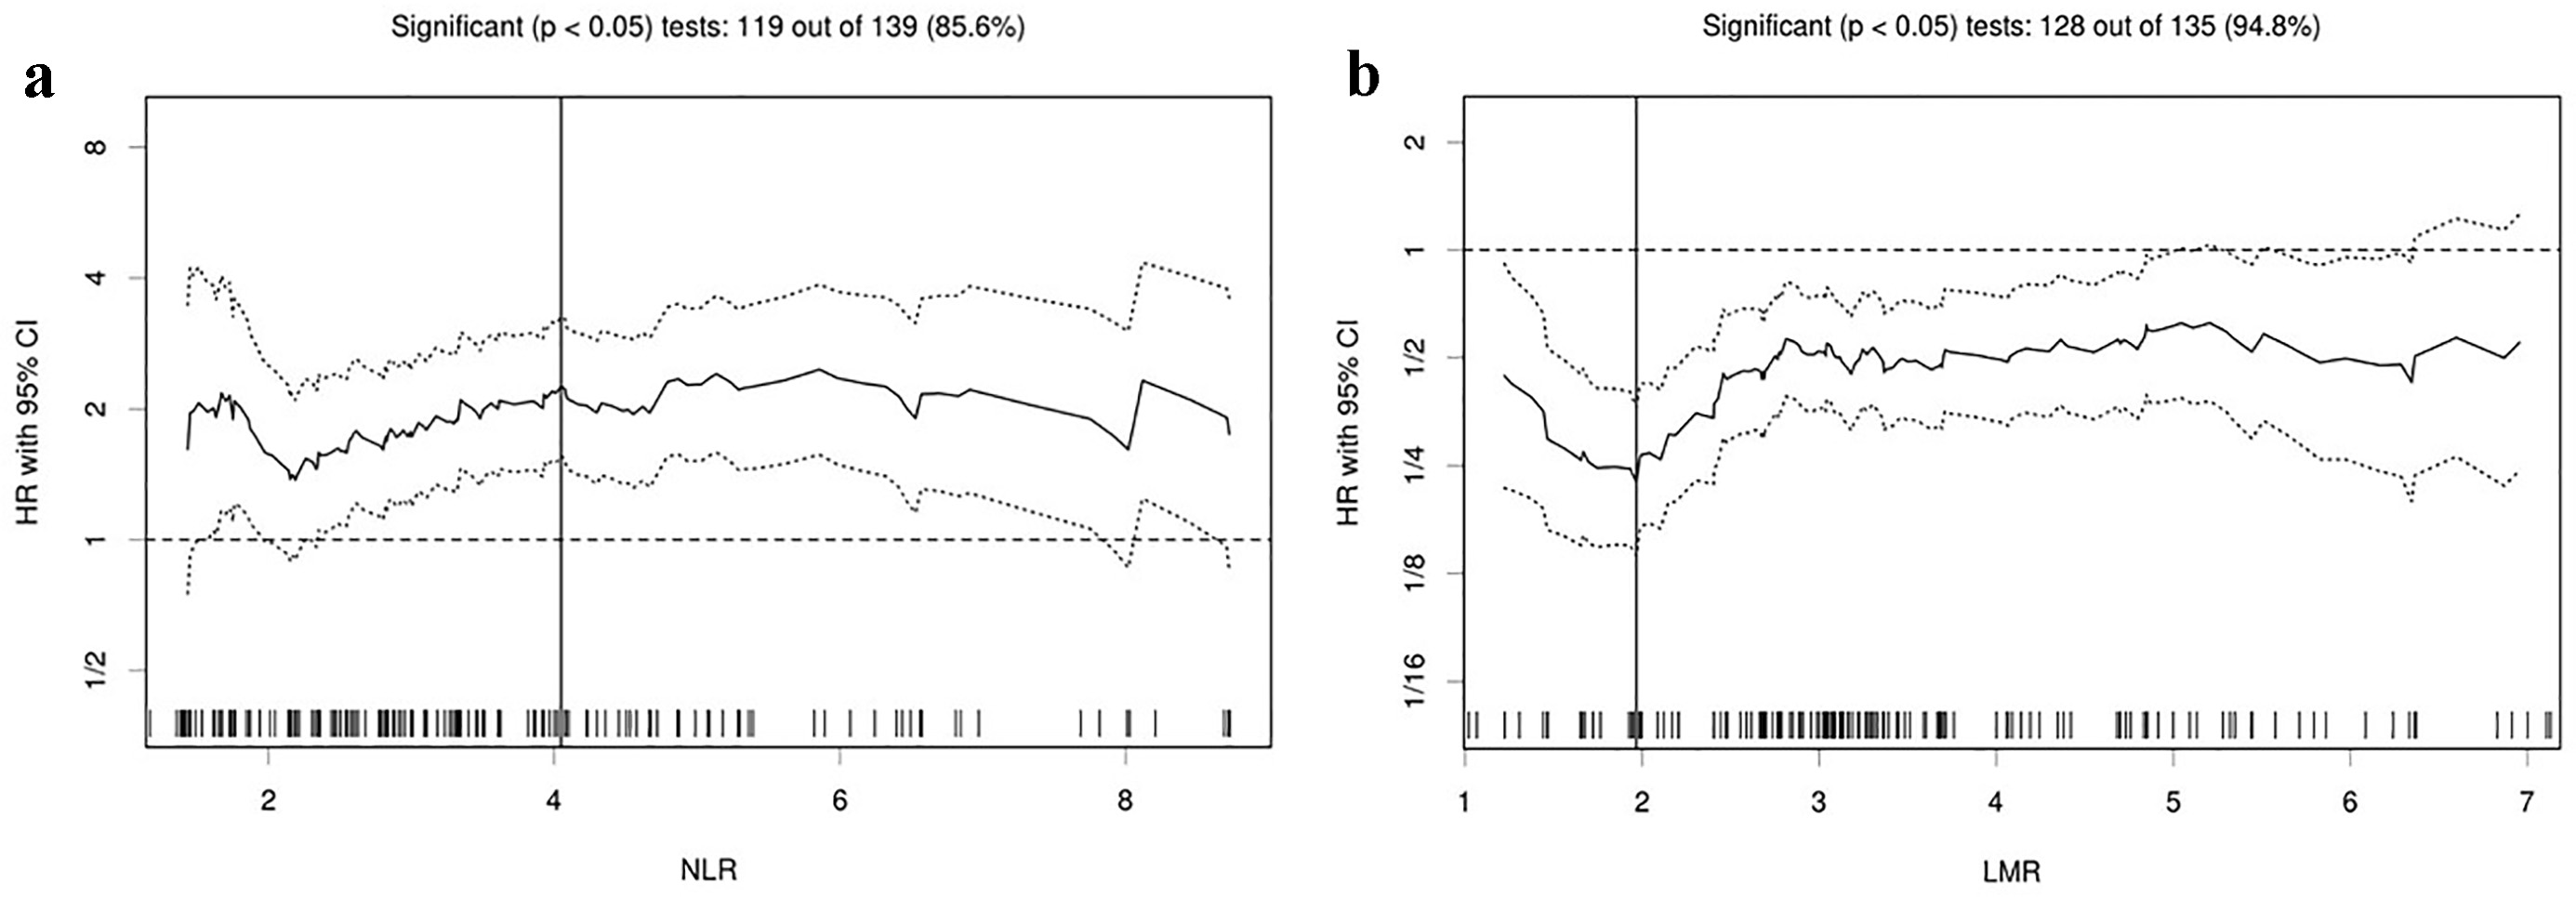
Figure 1. Hazard ratios and cutoff values of NLR and LMR for overall survival. (a) NLR and (b) LMR. The vertical line designates the optimal cutoff values with the most significant (log-rank test) split. The plots were determined using the R software-based biostatistical tool, Cutoff Finder. LMR: lymphocyte to monocyte ratio; NLR: neutrophil to lymphocyte ratio; HR: hazard ratio; OS: overall survival.
Figure 2.
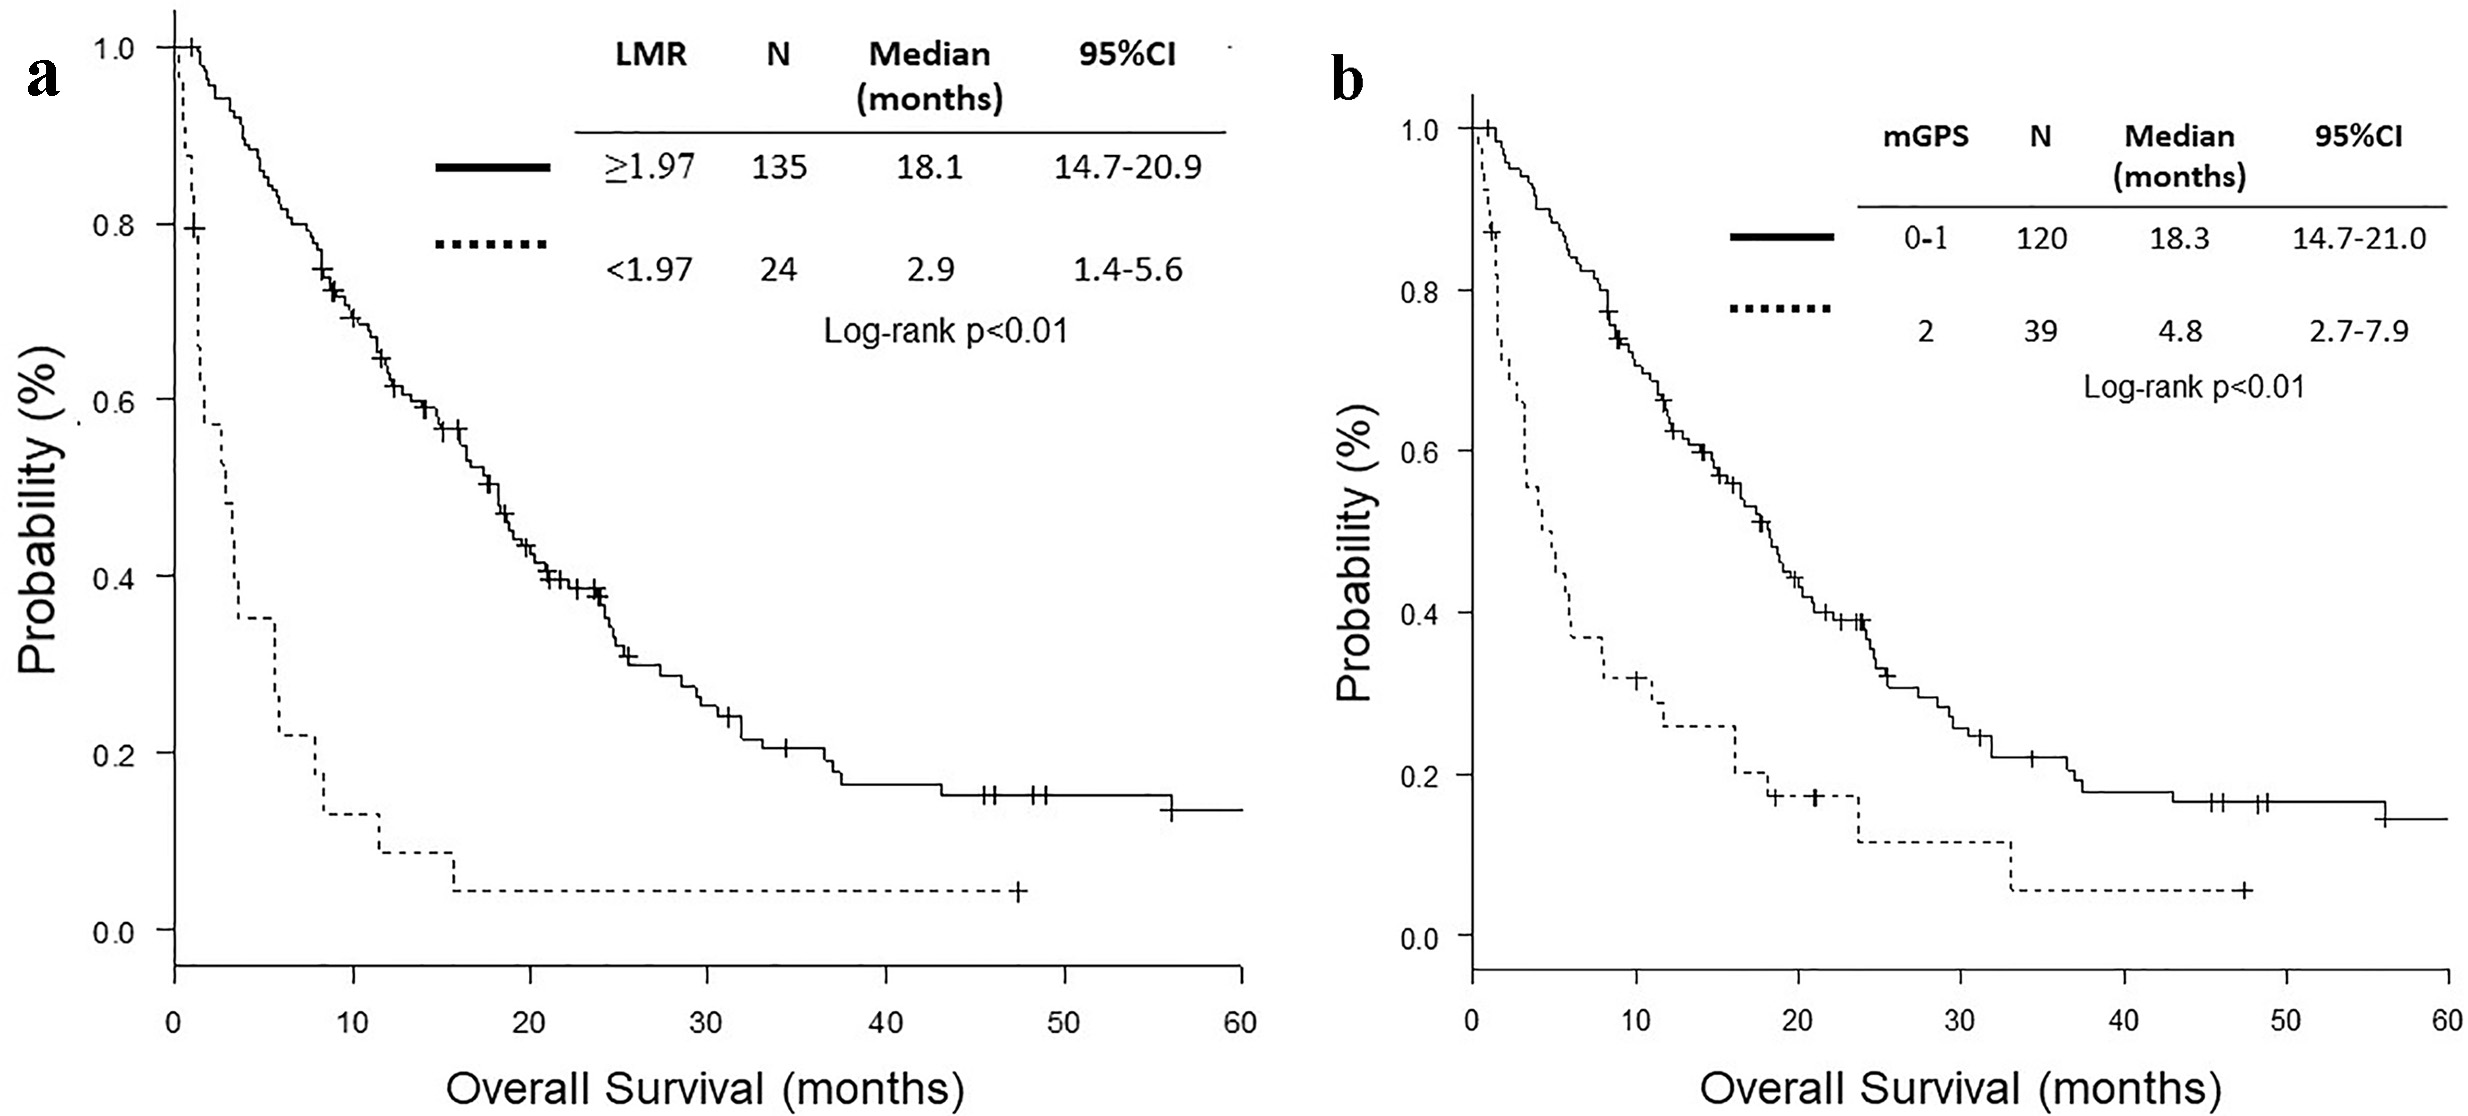
Figure 2. Kaplan-Meier curves of overall survival according to LMR and mGPS. (a) LMR. (b) mGPS. LMR: lymphocyte to monocyte ratio; mGPS: modified Glasgow prognostic score.
Figure 3.
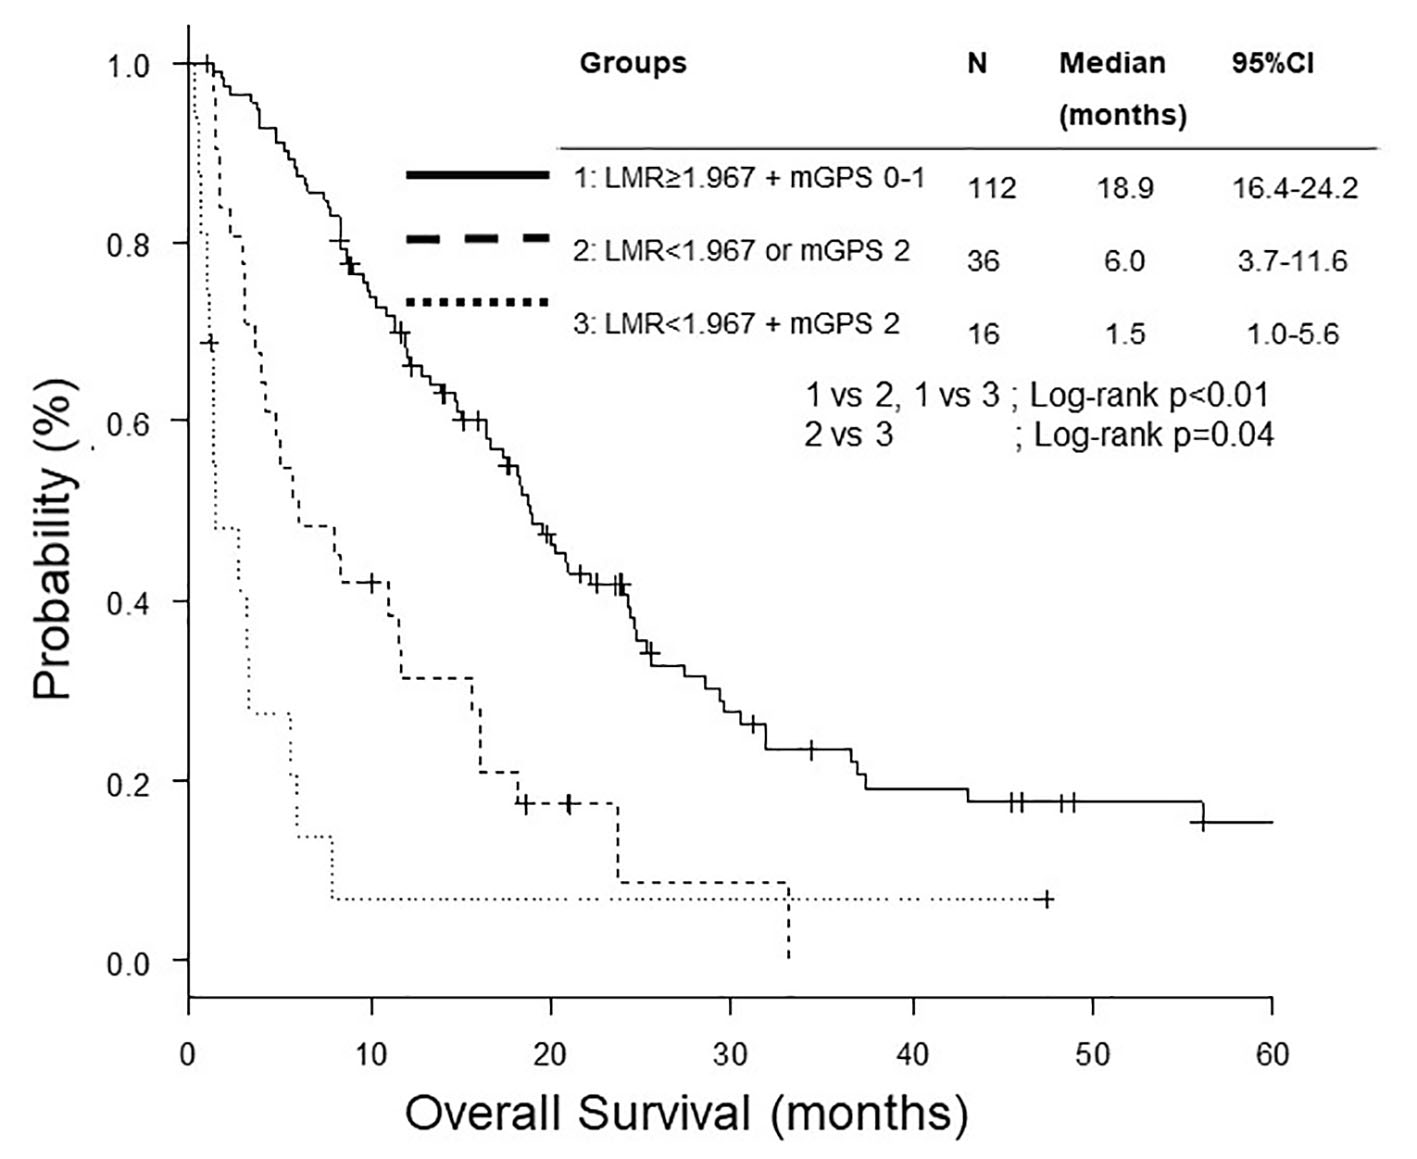
Figure 3. Kaplan-Meier curves of overall survival according to combination of LMR and mGPS. LMR: lymphocyte to monocyte ratio; mGPS: modified Glasgow prognostic score.

Tables

Table 1. Backgrounds and Laboratory Data at the Start of First-Line Chemotherapy
 
All, N = 159LMRmGPS
< 1.97, N = 24≥ 1.97, N = 135P0 - 1, N = 1202, N = 39P
aMean ± SD. bMann-Whitney test. cFisher’s exact test. Alb: albumin; ALP: alkaline phosphatase; BMI: body mass index; Ccr: creatinine clearance; CRP: C-reactive protein; ECOG PS: Eastern Cooperative Oncology Group performance status; Hb: hemoglobin; LDH: lactate dehydrogenase; LMR: lymphocyte to monocyte ratio; Lym: lymphocyte; Mono: monocyte; mGPS: modified Glasgow prognostic score; Neu: neutrophil; NLR: neutrophil to lymphocyte ratio; SD: standard deviation.
Background
  Age (years)a67.2 ± 9.067.9 ± 9.667.0 ± 8.90.45b67.0 ± 9.267.8 ± 8.40.54b
  Sex (N), male/female114/4520/494/410.22c83/3731/80.31c
  Stage (N), IIIB/IV30/1291/2329/1060.049c27/933/360.057c
  ECOG PS (N), 0 - 1/2/3124/27/810/8/6114/19/2< 0.01c103/15/221/12/6< 0.01c
  BMIa21.9 ± 3.120.2 ± 3.422.2 ± 3.00.01b22.4 ± 2.820.4 ± 3.5< 0.01b
Laboratory dataa
  Neu (cells/µL)6,004 ± 3,92410,359 ± 7,0685,229 ± 2,362< 0.01b5,168 ± 2,3988,575 ± 6,084< 0.01b
  Lym (cells/µL)1,673 ± 7411,235 ± 1,1361,751 ± 621< 0.01b1,738 ± 6541,473 ± 943< 0.01b
  Mono (cells/µL)554 ± 3711,026 ± 714470 ± 166< 0.01b486 ± 183764 ± 6380.02b
  NLR4.33 ± 4.4810.22 ± 8.673.28 ± 1.85< 0.01b3.38 ± 2.157.25 ± 7.57< 0.01b
  LMR3.58 ± 1.781.28 ± 0.483.99 ±1.60< 0.01b3.91 ± 1.692.57 ± 1.69< 0.01b
  Hb (g/dL)12.8 ± 1.612.0 ± 1.712.9 ±1.5< 0.01b13.0 ± 1.512.1 ± 1.6< 0.01b
  Sodium (mEq/L)138.7 ± 3.6136.4 ± 5.0139.1 ± 3.1< 0.01b139.3 ± 3.1137.1 ± 4.4< 0.01b
  Ccr (mL/min)60.9 ± 16.959.5 ± 16.161.1 ± 17.10.6561.8 ± 16.158.0 ± 19.30.13b
  LDH (IU/L)301 ± 456396 ± 717284 ± 3940.07257 ± 273435 ± 7790.10b
  ALP (IU/L)317 ± 256449 ± 452293 ± 1960.02292 ± 257392 ± 239< 0.01b
  Alb (g/dL)3.6 ± 0.53.0 ± 0.53.7 ± 0.5< 0.01b3.8 ± 0.42.9 ± 0.4< 0.01b
  CRP (mg/dL)2.6 ± 4.06.1 ± 5.32.0 ± 3.4< 0.01b1.6 ± 3.35.8 ± 4.5< 0.01b


Table 2. Treatment and Efficacy
 
All, N = 159LMRmGPS
< 1.97, N = 24≥ 1.97, N = 135P0 - 1, N = 1202, N = 39P
aFisher’s exact test. bLog-rank test. Bev: bevacizumab; CBDCA: carboplatin; CDDP: cisplatin; CI: confidence interval; DCR: disease control rate; ICI: immuno-checkpoint inhibitor; LMR: lymphocyte to monocyte ratio; mGPS: modified Glasgow prognostic score; PEM: pemetrexed; PFS: progression-free survival; RR: response rate; TRT: thoracic radiotherapy.
First-line regimen
  Single or combination (N)
    Single/combination4/1550/244/1311.00a4/1160/390.57a
  Platinum-based (N)
    CDDP/CBDCA52/1038/1644/871.00a43/739/300.12a
  PEM-containing (N)7713640.66a59180.85a
  Bev-containing (N)324280.79a2390.65a
  Concurrent TRT (N)8080.61a621.00a
First-line response
  RR (%) (95% CI)40.9 (33.2 - 48.9)8.3 (1.0 - 27.0)46.7 (38.0 - 55.4)< 0.01a45.0 (35.9 - 54.3)28.2 (15.0 - 44.9)0.09a
  DCR (%) (95% CI)69.8 (62.0 - 76.8)33.3 (15.6 - 55.3)76.3 (68.2 - 83.2)< 0.01a76.7 (68.1 - 83.9)48.7 (32.4 - 65.2)< 0.01a
  PFS (months) (95% CI)5.4 (4.6 - 6.3)2.7 (1.0 - 3.7)5.7 (5.3 - 6.6)< 0.01b5.7 (5.2 - 6.8)3.1 (1.6 - 5.3)0.01b
Second or further line (N)96591< 0.01a8412< 0.01a
  ICI (N)201190.31a1820.16a


Table 3. Univariate and Multivariate Cox Proportional Hazard Analysis of Factors Associated With Overall Survival
 
UnivariateMultivariate
HR95% CIPHR95% CIP
ALP: alkaline phosphatase; BMI: body mass index; CI: confidence interval; Ccr: creatinine clearance; CS: current smoker; ECOG PS: Eastern Cooperative Oncology Group performance status; Ex: ex-smoker; HR: hazard ratio; LDH: lactate dehydrogenase; mGPS: modified Glasgow prognostic score; LMR: lymphocyte to monocyte ratio; NLR: neutrophil to lymphocyte ratio; NS: non-smoker.
Age (years), < 75 vs. ≥ 751.470.97 - 2.230.071.210.78 - 1.890.39
Sex, female vs. male1.500.99 - 2.260.0541.130.73 - 1.730.59
Stage IIIB vs. IV1.100.68 - 1.760.70
ECOG PS, 0 - 1 vs. 2 - 44.773.07 - 7.40< 0.013.432.12 - 5.53< 0.01
BMI, ≥ 18.5 vs. < 18.50.980.92 - 1.040.45
Smoking status, NS, Ex vs. CS1.140.80 - 1.640.47
Hemoglobin (g/dL)0.940.83 - 1.050.28
Ccr (mL/min) (/10)0.920.82 - 1.030.15
Sodium (mEq/L) (/10)0.610.42 - 0.900.011.280.78 - 2.100.33
LDH (IU/L) (/100)1.030.99 - 1.060.15
ALP (IU/L) (/100)1.060.99 - 1.130.081.000.92 - 1.090.99
NLR, < 4.05 vs. ≥ 4.052.171.50 - 3.13< 0.011.090.67 - 1.780.72
LMR, < 1.97 vs. ≥ 1.970.220.14 - 0.36< 0.010.390.21 - 0.72< 0.01
mGPS, 0,1 vs. 22.601.73 - 3.90< 0.011.951.20 - 3.16< 0.01


Table 4. Cox Proportional Hazard Analysis of Overall Survival According to Combination of LMR and mGPS
 
HR95% CIP
Adjusted for age, sex, ECOG PS, sodium, ALP and NLR. CI: confidence interval; HR: hazard ratio; mGPS: modified Glasgow prognostic score; LMR: lymphocyte to monocyte ratio.
LMR ≥ 1.97 + mGPS 0 - 11
LMR < 1.97 or mGPS 21.650.96 - 2.830.07
LMR < 1.97 + mGPS 25.982.64 - 13.5< 0.01


Table 5. Review of Previous Studies of LMR as a Prognostic Factor for Advanced NSCLC [13, 26-28]
 
Author (year)CountryNPatient treatmentCut-offMultivariate analyses
OSPFS
HR (95% CI)PHR (95% CI)P
Ad: adenocarcinoma; CI: confidence interval; EGFR: epidermal growth factor receptor; HR: hazard ratio; LMR: lymphocyte to monocyte ratio; mt: mutation; NA: not assessed; NSCLC: non-small cell lung cancer; PFS: progression-free survival; OS: overall survival; TKI: tyrosine kinase inhibitor.
Lin et al (2014) [13]China370Stage IIIB or IV, platinum-based doublet4.560.530 (0.409 - 0.687)< 0.0010.660 (0.512 - 0.851)0.001
Chen et al (2015) [28]Taiwan253EGFR mt (+) first-line EGFR-TKIs3.292.36 (1.66 - 3.35)< 0.0011.71 (1.14 - 2.56)0.009
Chang et al (2017) [27]Taiwan490Stage IV3.11.844 (1.212 - 1.837)< 0.001NANA
Our (2017) [26]Japan152EGFR mt (+), EGFR-TKIs5.090.88 (0.76 - 1.01)0.071.00 (0.90 - 1.12)0.99
OurJapan159Stage IIIB or IV, Ad, platinum-based1.970.39 (0.21 - 0.72)< 0.01NANA


Table 6. Review of Previous Studies of GPS as a Prognostic Factor for Advanced NSCLC [16, 29-34]
 
Author (year)CountryNPatient treatmentVariablesOSPFS
HR (95% CI)PHR (95% CI)P
Ad: adenocarcinoma; CDDP: cisplatin; CI: confidence interval; ES-SCLC: extensive stage small cell lung cancer; GPS: Glasgow prognostic score; HR: hazard ratio; mGPS, modified Glasgow prognostic score; NA: not assessed; ND: not described; NSCLC: non-small cell lung cancer; OS: overall survival; PFS: progression-free survival.
Forrest et al (2004) [29]UK109Inoperable, platinum-based chemotherapyGPS1.88 (1.25 - 2.84)0.002NANA
Meek et al (2010) [31]UK56InoperablemGPSND< 0.001NANA
Leung et al (2012) [16]UK261InoperablemGPS 0, 1, 21.67 (1.28 - 2.19)< 0.0001NANA
Simmons et al (2015) [32]UK390Stage IV NSCLC (N = 288) or ES-SCLCmGPS 0, 1, 21.67 (1.40 - 2.00)< 0.001NANA
Jiang et al (2015) [34]China138Stage IIIB or IV CDDP-based chemotherapy0 vs. 1
0 vs. 2
0.8 (0.4 - 0.9)
0.5 (0.2 - 0.9)
0.020.8 (0.5 - 0.9)
0.6 (0.2 - 0.8)
0.03
Zhu et al (2016) [33]China105Inoperable stage IIIB or IV, first-line chemotherapymGPS 0, 1, 21.19 (0.81 - 1.75)0.3741.10 (0.79 - 1.53)0.579
Lv et al (2017) [30]China266Recurrence after resection, systemic chemotherapymGPS 0 - 1 vs. 21.47 (1.15 - 1.88)0.002NANA
OurJapan159Stage IIIB or IV, Ad, platinum-basedmGPS 0 - 1 vs. 21.95 (1.20 - 3.16)< 0.01NANA