World Journal of Oncology, ISSN 1920-4531 print, 1920-454X online, Open Access
Article copyright, the authors; Journal compilation copyright, World J Oncol and Elmer Press Inc
Journal website http://www.wjon.org

Original Article

Volume 10, Number 2, April 2019, pages 101-111


Predictors of Progression-Free Survival and Overall Survival in Metastatic Non-Clear Cell Renal Cell Carcinoma: A Single-Center Experience

Figures

Figure 1.
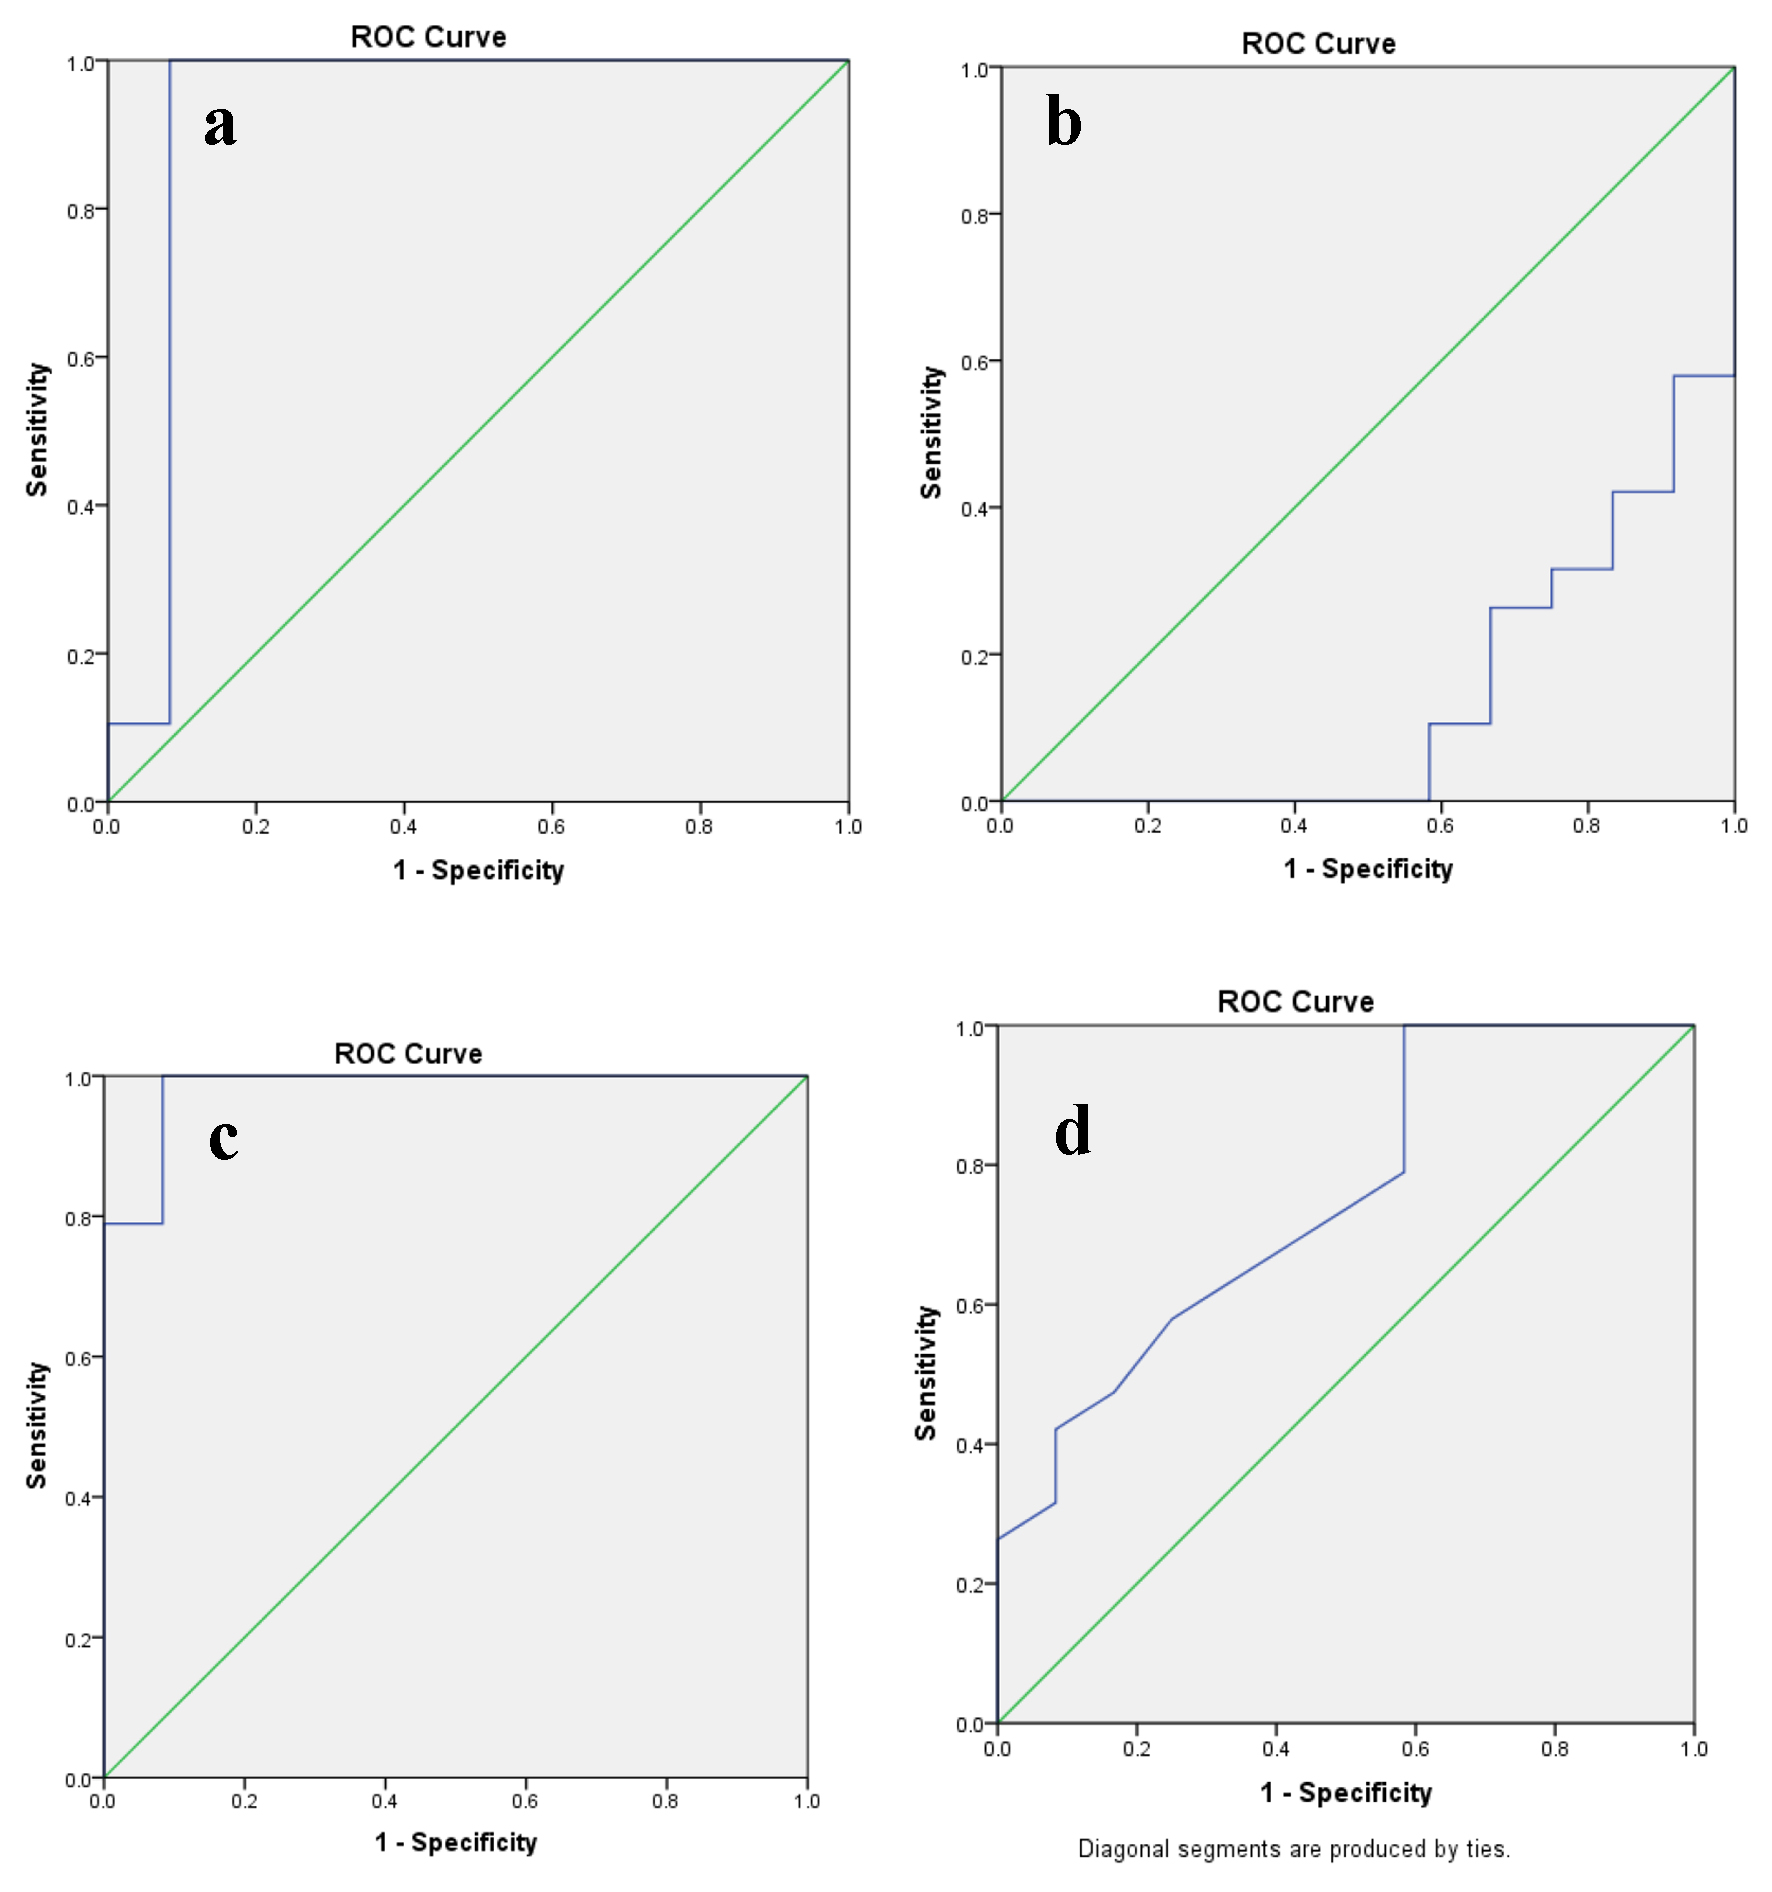
Figure 1. The predictive ability of ROC curve to determine the cut-off point for (a) PLR, (b) LMR, (c) SII index and (d) CAR in relation to disease progression. ROC: receive operating characteristic; PLR: platelet to lymphocyte ratio; LMR: lymphocyte to monocyte ratio; SII: systemic immune inflammation; CAR: C-reactive protein/albumin ratio.
Figure 2.
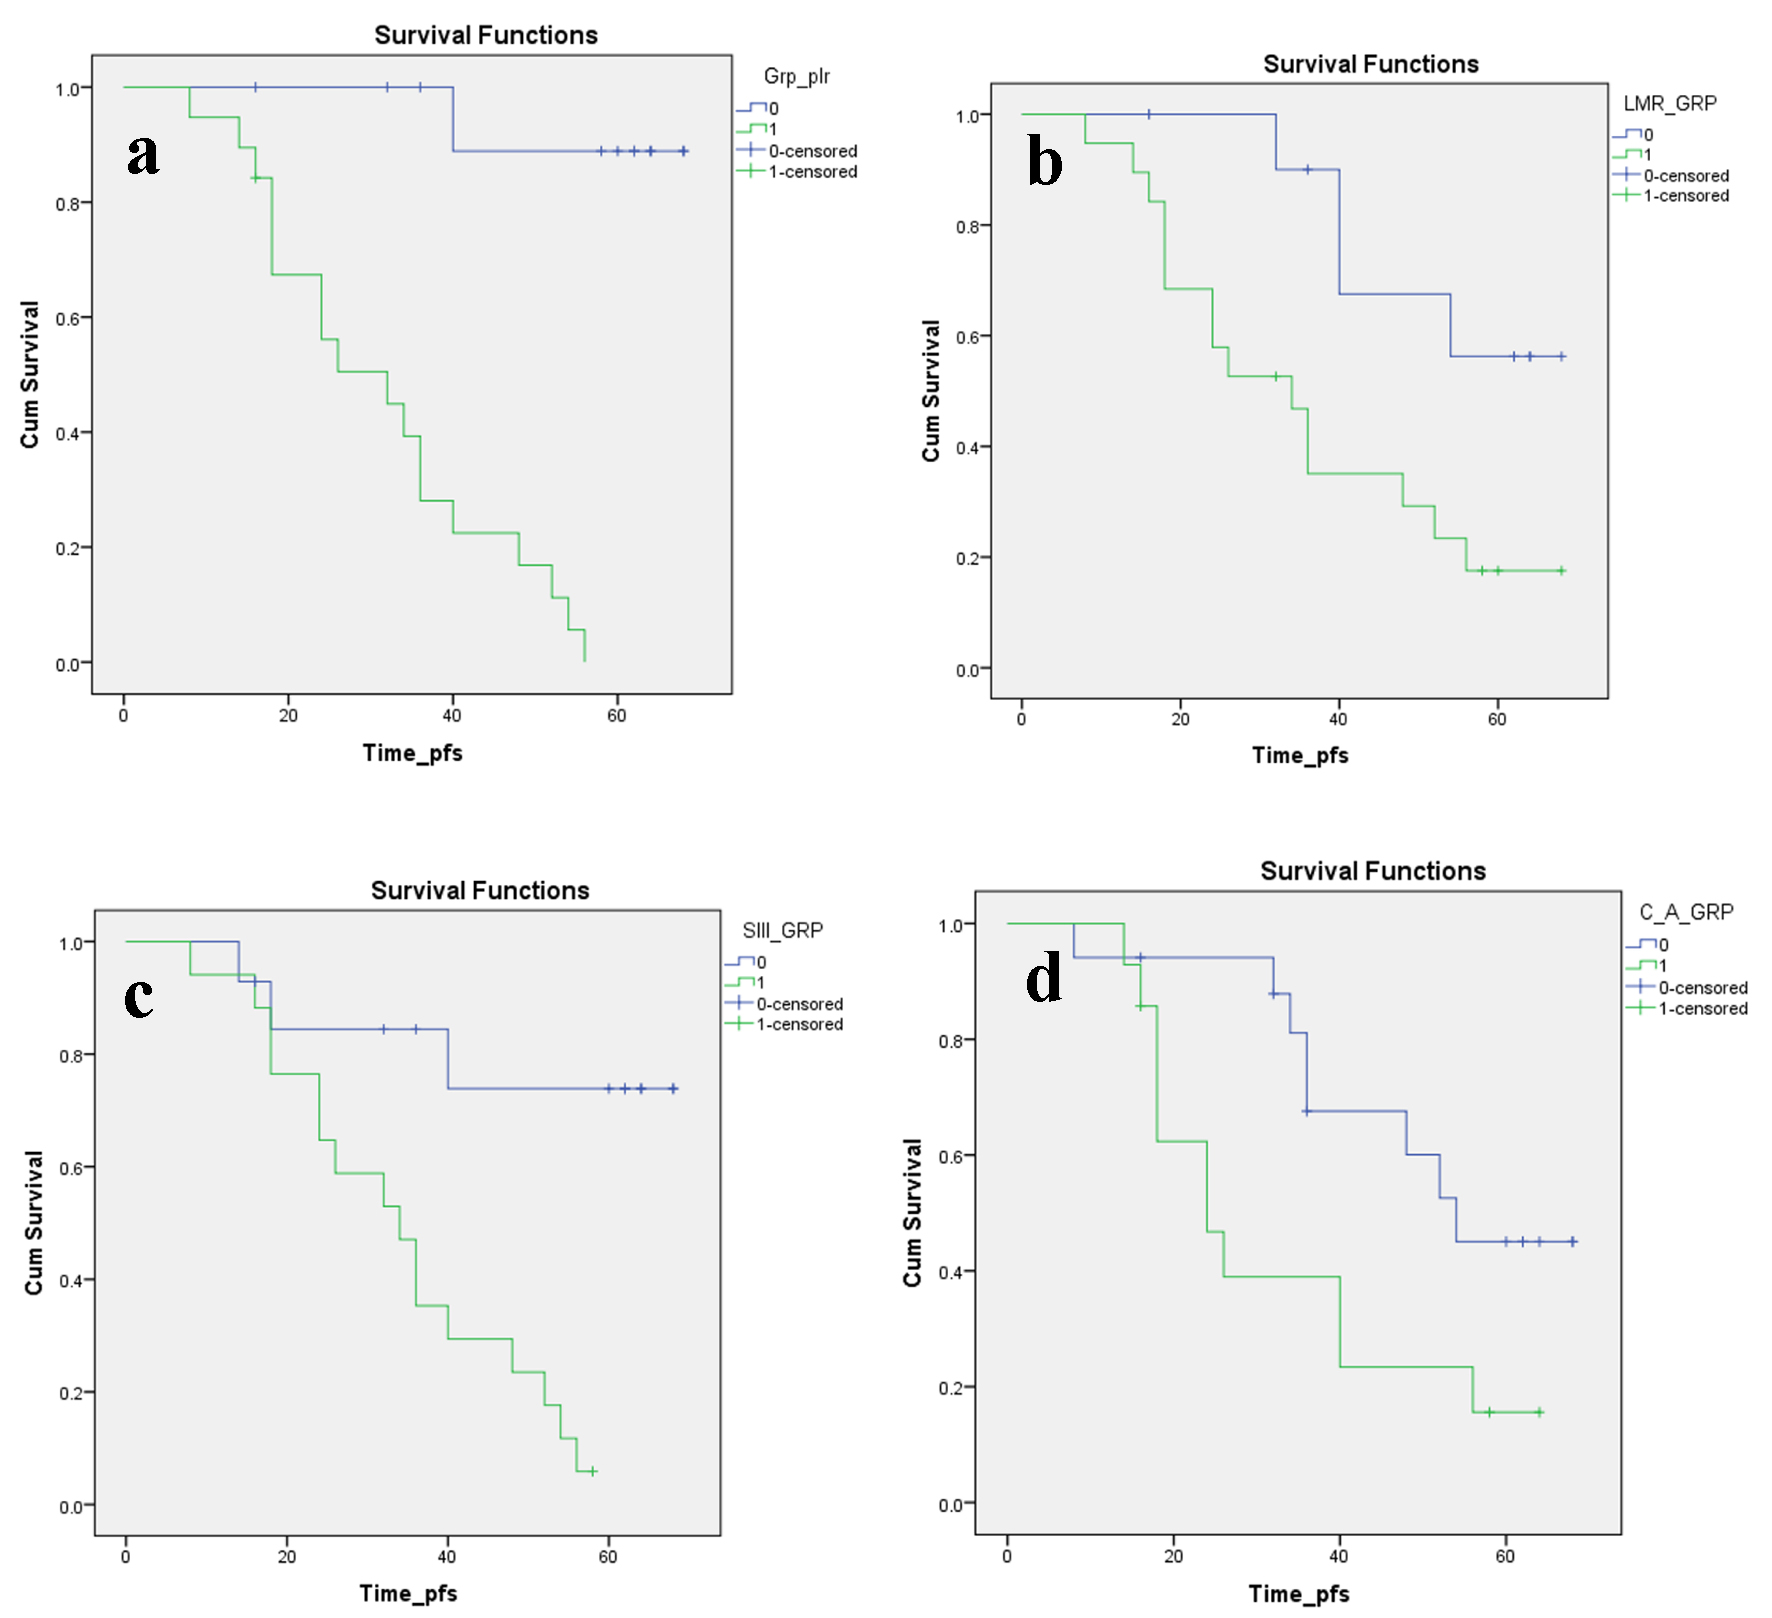
Figure 2. Kaplan-Meier plots illustrating PFS according to the (a) PLR, (b) LMR, (c) SII index and (d) CAR, respectively. PFS: progression-free survival; PLR: platelet to lymphocyte ratio; LMR: lymphocyte to monocyte ratio; SII: systemic immune inflammation; CAR: C-reactive protein/albumin ratio.
Figure 3.
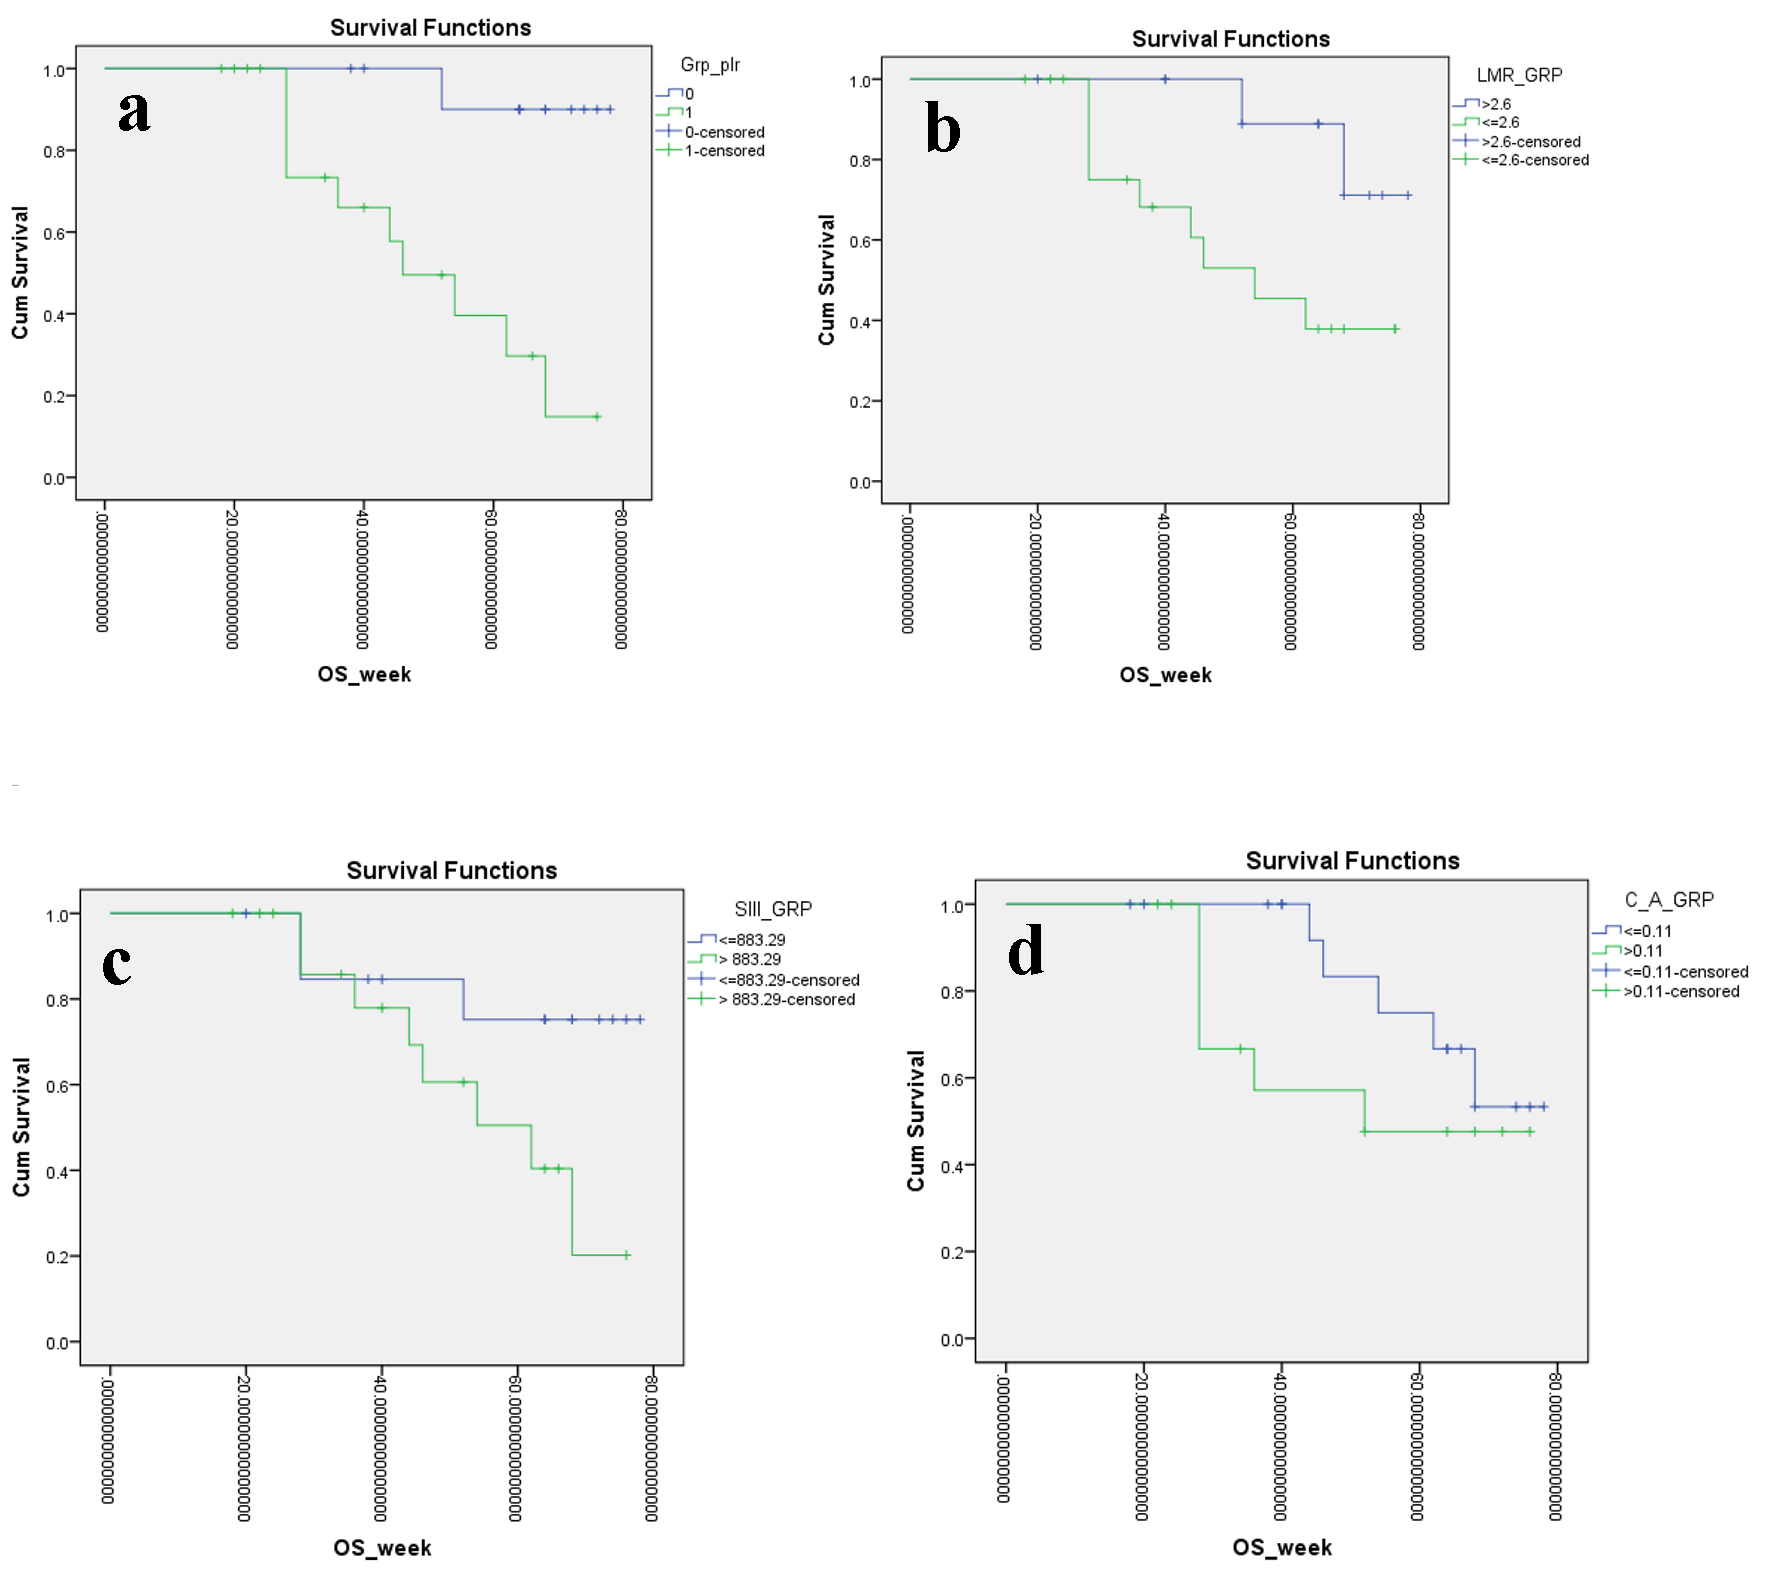
Figure 3. Kaplan-Meier plots illustrating OS according to the (a) PLR, (b) LMR, (c) SII index and (d) CAR, respectively. OS: overall survival; PLR: platelet to lymphocyte ratio; LMR: lymphocyte to monocyte ratio; SII: systemic immune inflammation; CAR: C-reactive protein/albumin ratio.

Tables

Table 1. Epidemiological and Clinicopathological Data in the Progression and Non-Progression Group
 
CharacteristicsProgression, N (%)Non-progression, N (%)Chi-square coefficientP valuePearson’s R coefficientP value
The percentage value depicted denotes the value within the respective progression or non-progression groups. FG: Fuhrman nuclear grade; TN: tumor necrosis; LN: lymph node; MI: microscopic invasion; PLR: platelet to lymphocyte ratio; LMR: lymphocyte to monocyte ratio; SII: systemic immune inflammation; CAR: C-reactive protein/albumin ratio; SST: scan to surgery time; MSKCC: Memorial Sloan Kettering Cancer Center.
Median age (years)62 ± 3.1454 ± 4.52N/A
Histology27.4880.00010.0450.810
  PAP9 (47.4)0
  CHR1 (5.3)5 (41.7)
  COLL07 (58.3)
  UNC9 (47.4)0
Sex0.7930.3730.1600.390
  Male14 (73.7)7 (58.3)
  Female5 (26.3)5 (41.7)
Site0.0010.9810.0040.180
  Rt8 (42.1)5 (41.7)
  Lt11 (57.9)7 (58.3)
Tumor stage0.3270.5670.1030.582
  T1, T26 (31.6)5 (41.7)
  T3, T413 (68.4)7 (58.3)
FG8.760.0423.0710.007
  FG1, FG210 (52.6)5 (41.7)
  FG3, FG49 (47.4)7 (58.3)
TN7.200.0460.0260.891
  Yes10 (52.6)6 (50)
  No9 (47.4)6 (50)
(p) LN status6.5950.0440.6390.032
  Yes9 (47.4)4 (33.3)
  No10 (52.6)8 (66.7)
MI3.9510.0470.3570.049
  Yes13 (68.4)5 (41.7)
  No6 (31.6)7 (58.3)
PLR6.3040.0200.4510.011
  > 17118 (94.7)1 (8.3)
  ≤ 1711 (5.3)11 (91.7)
LMR6.4500.0110.4560.010
  < 2.6115 (78.9)4 (33.3)
  ≥ 2.614 (21.1)8 (66.7)
SII index17.0980.00010.7430.0001
  > 88316 (84.2)1 (8.3)
  ≤ 8833 (15.8)11 (91.7)
CAR4.2130.0430.5220.037
  > 0.1111 (57.9)3 (25)
  ≤ 0.118 (42.1)9 (75)
SST (median)19.7740.000116.7340.0001
  > 3.917 (89.5)0
  ≤ 3.92 (10.5)12 (100)
MSKCC groups13.650.01211.50.034
  Intermediate7 (36.8)8 (72.7)
  Poor12 (63.2)4 (33.3)


Table 2. Multivariate Analysis for Variable Considered for PFS and OS
 
CharacteristicsPFSOS
95% CIHRP value95% CIHRP value
PFS: progression-free survival; OS: overall survival; FG: Fuhrman nuclear grade; TN: tumor necrosis; LN: lymph node; MI: microscopic invasion; PLR: platelet to lymphocyte ratio; LMR: lymphocyte to monocyte ratio; SII: systemic immune inflammation; CAR: C-reactive protein/albumin ratio; SST: scan to surgery time; CI: confidence interval; HR: hazard ratio.
Age (years)0.569 - 1.0730.7810.1270.247 - 1.3160.5700.188
T stage0.023 - 5.8311.1500.9440.029 - 24.8229.1580.558
FG0.847 - 28.41615.510.0650.157 - 22.15015.9220.151
TN9.671 - 25.34915.650.0050.033 - 5.7894.3660.303
(p) LN status4.811 - 24.78114.670.0120.414 - 14.1836.3170.251
MI0.435 - 8.6126.1200.1790.060 - 8.5546.1750.891
PLR1.102 - 1.4601.2690.0010.865 - 1.9331.2930.045
LMR0.253 - 8.3681.4560.0010.713 - 16.1018.6670.001
SII index1.005 - 1.0401.0230.0100.992 - 1.0431.0170.183
CAR0.564 - 6.5784.4450.0010.076 - 1.7631.0020.554
SST0.006 - 0.3110.0410.0020.342 - 15.56011.0240.259


Table 3. Estimated and Actuarial Survival Data for OS Based on Kaplan-Meier Survival Plots
 
VariablesActuarial survival (%)Estimated mean OS (95% CI) (months)SELog rank (Mantel Cox) coefficientP value
9 months12 months14 months
OS: overall survival; PLR: platelet to lymphocyte ratio; LMR: lymphocyte to monocyte ratio; SII: systemic immune inflammation; CAR: C-reactive protein/albumin ratio; CI: confidence interval; SE: standard error.
PLR6649.539.612.6 (10.2 - 14.9)2.4710.830.001
LMR68.25345.513.5 (10.9 - 15.9)5.134.440.035
SII index77.960.650.513.9 (11.5 - 16.2)4.783.430.064
CAR57.152.347.613.5 (10.3 - 16.6)6.511.450.229


Table 4. Estimated and Actuarial Survival Data for PFS Based on Kaplan-Meier Survival Plots
 
VariablesActuarial survival (%)Estimated mean PFS (95% CI) (months)SELog rank (Mantel Cox) coefficientP value
9 months12 months14 months
PFS: progression-free survival; PLR: platelet to lymphocyte ratio; LMR: lymphocyte to monocyte ratio; SII: systemic immune inflammation; CAR: C-reactive protein/albumin ratio; CI: confidence interval; SE: standard error.
PLR39.316.85.67.8 (6.1 - 9.4)2.9322.100.0001
LMR35.129.217.59 (6.8 - 11.3)4.575.790.016
SII index35.323.55.98.5 (6.8 - 10.3)3.6310.730.001
CAR39.323.415.68.2 (5.8 - 10.6)4.914.740.029