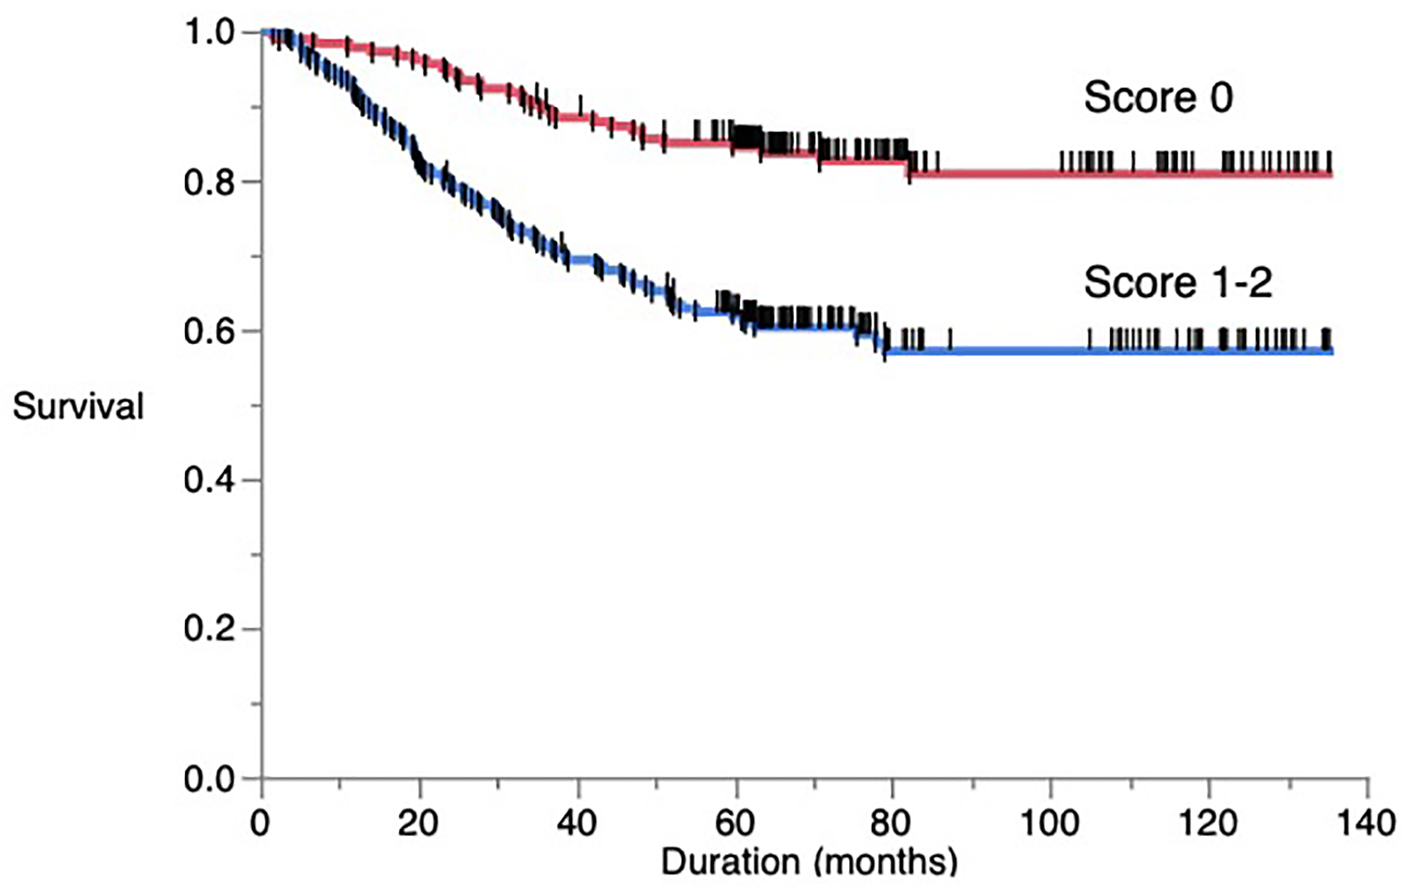
Figure 1. Overall postoperative cancer-specific survival of patients based on a novel score.
| World Journal of Oncology, ISSN 1920-4531 print, 1920-454X online, Open Access |
| Article copyright, the authors; Journal compilation copyright, World J Oncol and Elmer Press Inc |
| Journal website http://www.wjon.org |
Original Article
Volume 10, Number 4-5, October 2019, pages 176-180
The Prognostic Values of a Novel Preoperative Inflammation-Based Score in Japanese Patients With Non-Small Cell Lung Cancer
Figure
Tables
| Neut | Lym | PLT | ALB | CRP | BMI | |
|---|---|---|---|---|---|---|
| Neut: neutrophil count; Lym: lymphocyte count; PLT: platelet count; ALB: serum albumin; CRP: C-reactive protein; BMI: body mass index. | ||||||
| Glasgow prognostic score (GPS) | ○ | ○ | ||||
| Neutrophil/lymphocyte ratio (NLR) | ○ | ○ | ||||
| Platelet/lymphocyte ratio (PLR) | ○ | ○ | ||||
| Prognostic nutritional index (PNI) | ○ | ○ | ||||
| Systemic immune-inflammation index (SII) | ○ | ○ | ○ | |||
| Advance lung cancer inflammation index (ALI) | ○ | ○ | ○ | ○ | ||
| Inflammatory prognostic index (IPI) | ○ | ○ | ○ | ○ | ||
| No. of patients | |
|---|---|
| CEA: carcinoembryonic antigen; ALB: serum albumin; NLR: neutrophil to lymphocyte ratio; CRP: C-reactive protein; BMI: body mass index; PLT: platelet to lymphocyte ratio. | |
| Age | 128 |
| < 65 | 272 |
| ≥ 65 | |
| Gender | 211 |
| Male | 189 |
| Female | |
| Smoking status | 223 |
| Current/former | 177 |
| Never | |
| Histology | 315 |
| Adenocarcinoma | 85 |
| Others | |
| pStage | 307 |
| I | 93 |
| II-III | |
| pT status | 266 |
| pT1 | 134 |
| pT2-3 | |
| pN status | 339 |
| pN0 | 61 |
| pN1-2 | |
| CEA | 292 |
| Normal | 108 |
| High | |
| ALB | 99 |
| Low | 301 |
| Normal | |
| NLR | 257 |
| Low | 143 |
| High | |
| CRP | 276 |
| Normal | 124 |
| High | |
| BMI | 138 |
| Low | 262 |
| High | |
| PLR | 268 |
| Low | 132 |
| High | |
| Factor | Univariate | Multivariate | ||||||
|---|---|---|---|---|---|---|---|---|
| Risk ratio | P value | 95% CI | Risk ratio | P value | 95% CI | |||
| Lower | Upper | Lower | Upper | |||||
| CI: confidence interval; ALB: serum albumin; NLR: neutrophil to lymphocyte ratio; CRP: C-reactive protein; BMI: body mass index; PLT: platelet to lymphocyte ratio. | ||||||||
| ALB | 1.797 | 0.003 | 1.223 | 2.602 | 1.462 | 0.060 | 0.983 | 2.144 |
| NLR | 2.284 | 0.019 | 1.158 | 4.053 | 1.547 | 0.217 | 0.758 | 2.889 |
| CRP | 2.249 | < 0.001 | 1.566 | 3.218 | 1.910 | 0.001 | 1.306 | 2.778 |
| BMI | 1.933 | < 0.001 | 1.348 | 2.766 | 1.720 | 0.004 | 1.191 | 2.477 |
| PLT | 1.726 | 0.004 | 1.198 | 2.473 | 1.346 | 0.143 | 0.903 | 1.982 |
| Factor | Univariate | Multivariate | ||||||
|---|---|---|---|---|---|---|---|---|
| Risk ratio | P value | 95% CI | Risk ratio | P value | 95% CI | |||
| Lower | Upper | Lower | Upper | |||||
| CI: confidence interval; CEA: carcinoembryonic antigen. | ||||||||
| Age | 1.208 | 0.346 | 0.820 | 1.820 | ||||
| Gender | 3.470 | < 0.001 | 2.314 | 5.362 | 2.568 | 0.001 | 1.437 | 4.716 |
| Smoking status | 3.358 | < 0.001 | 2.220 | 5.255 | 1.075 | 0.820 | 0.583 | 2.029 |
| Histology | 3.522 | < 0.001 | 2.427 | 5.067 | 2.100 | < 0.001 | 1.405 | 3.125 |
| pT status | 2.212 | < 0.001 | 1.543 | 3.166 | 1.110 | 0.615 | 0.736 | 1.665 |
| pN status | 2.616 | < 0.001 | 1.718 | 3.882 | 2.069 | 0.003 | 1.289 | 3.270 |
| CEA | 2.243 | < 0.001 | 1.545 | 3.226 | 1.870 | 0.002 | 1.273 | 2.723 |
| Novel score | 2.802 | < 0.001 | 1.884 | 4.282 | 2.025 | 0.001 | 1.343 | 3.132 |