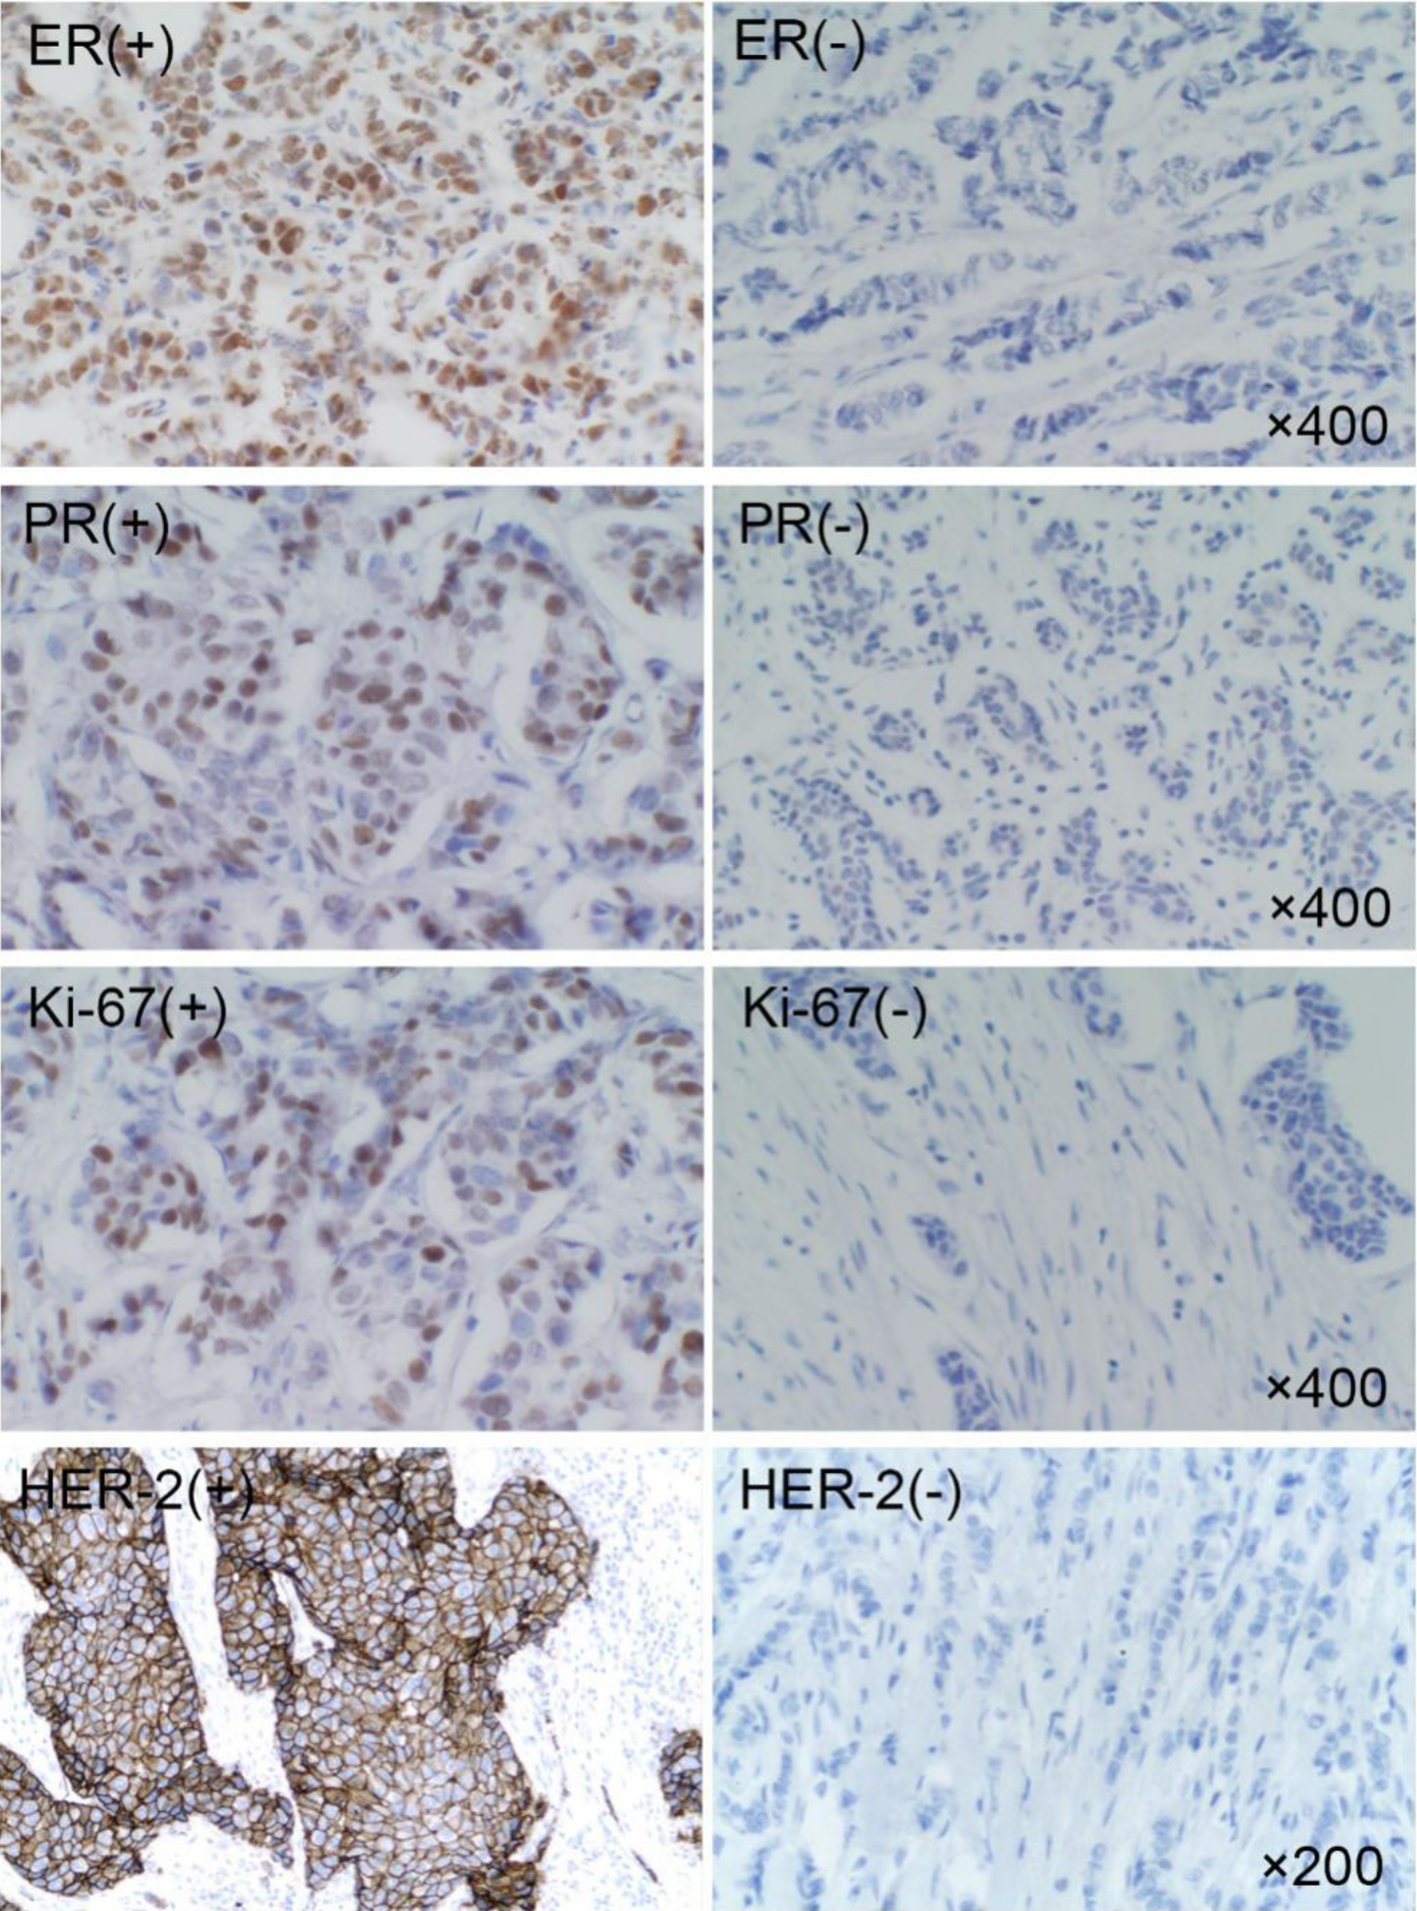
Figure 1. Expression of ER, PR, HER-2 and Ki-67 in breast cancer. ER: estrogen receptor; PR: progesterone receptor; HER-2: human epidermal growth factor receptor-2.
| World Journal of Oncology, ISSN 1920-4531 print, 1920-454X online, Open Access |
| Article copyright, the authors; Journal compilation copyright, World J Oncol and Elmer Press Inc |
| Journal website http://www.wjon.org |
Original Article
Volume 11, Number 1, February 2020, pages 23-32
The Effect of Metformin on the Clinicopathological Features of Breast Cancer With Type 2 Diabetes
Figures
Tables
| Hypoglycemic drugs | Number of cases | % |
|---|---|---|
| T2DM: type 2 diabetes mellitus. | ||
| Sulfonylureas | 19 | 18.6 |
| Insulin | 14 | 13.7 |
| Thiazolidinediones | 2 | 1.9 |
| Acarbose | 4 | 3.9 |
| Metformin alone | 10 | 9.8 |
| Metformin + insulin | 2 | 1.9 |
| Metformin + glinides | 4 | 3.9 |
| Metformin + thiazolidinedione | 1 | 1.0 |
| Metformin + sulfonylureas | 15 | 14.7 |
| Metformin + acarbose | 1 | 1.0 |
| Sulfonylureas + thiazolidinediones | 1 | 1.0 |
| Insulin + sulfonylureas | 1 | 1.0 |
| Herbal medicine | 2 | 1.9 |
| Diet control | 2 | 1.9 |
| Unknown medication | 6 | 5.9 |
| No drug treatment | 5 | 4.9 |
| Observation indicators | Metformin group | Control group | t | P |
|---|---|---|---|---|
| Age | 63.42 ± 8.24 | 65.01 ± 7.45 | 0.627 | > 0.05 |
| BMI | 23.21 ± 3.26 | 25.15 ± 3.67 | 1.281 | > 0.05 |
| T2DM course | 4.52 ± 2.15 | 5.10 ± 3.08 | 1.560 | > 0.05 |
| Clinicopathological features | Metformin group | Control group (N = 56) | χ2 | P |
|---|---|---|---|---|
| ER: estrogen receptor; PR: progesterone receptor; HER-2: human epidermal growth factor receptor-2. *P < 0.05. | ||||
| Tumor size | ||||
| T ≤ 2 cm | 7 (21.2%) | 10 (17.9%) | 0.151 | 0.697 |
| T > 2 cm | 26 (78.8%) | 46 (82.1%) | ||
| Lymph node | ||||
| Negative | 16 (48.5%) | 12 (16.1%) | 7.049 | 0.008* |
| Positive | 17 (51.5%) | 44 (78.6%) | ||
| Clinical stage | ||||
| I | 6 (18.2%) | 9 (16.1%) | 0.066 | 0.797 |
| II, III | 27 (81.8%) | 47 (83.9%) | ||
| Histological grade | ||||
| I | 8 (24.2%) | 8 (14.3%) | 1.396 | 0.237 |
| II, III | 25 (75.8%) | 48 (85.7%) | ||
| ER status | ||||
| Negative | 14 (42.4%) | 31 (55.4%) | 2.796 | 0.095 |
| Positive | 19 (57.6%) | 25 (44.6%) | ||
| PR status | ||||
| Negative | 13 (39.4%) | 34 (60.7%) | 3.787 | 0.052 |
| Positive | 20 (60.6%) | 22 (39.3%) | ||
| HER-2 status | ||||
| Negative | 28 (84.8%) | 41 (73.2%) | 1.613 | 0.204 |
| Positive | 5 (15.2%) | 15 (26.8%) | ||
| Ki-67 | ||||
| < 14% | 21 (63.6%) | 21 (37.5%) | 5.692 | 0.017* |
| ≥ 14% | 12 (36.4%) | 35 (62.5%) | ||
| Molecular typing | ||||
| Luminal | 25 (75.8%) | 30 (53.6%) | 4.329 | 0.037* |
| Others | 8 (24.2%) | 26 (46.4%) | ||
| Immunohistochemical indicators | Metformin group | Control group | χ2 | P |
|---|---|---|---|---|
| EGFR: epidermal growth factor receptor; MMP-2: matrix metalloproteinase-2. *P < 0.05. | ||||
| EGFR | ||||
| Negative | 13 (39.4%) | 17 (30.4%) | 0.759 | 0.384 |
| Positive | 20 (60.6%) | 39 (69.6%) | ||
| E-cadherin | ||||
| Negative | 11 (33.3%) | 30 (53.6%) | 3.423 | 0.064 |
| Positive | 22 (66.7%) | 26 (46.4%) | ||
| N-cadherin | ||||
| Negative | 28 (84.8%) | 43 (76.8%) | 0.837 | 0.360 |
| Positive | 5 (15.2%) | 13 (23.2%) | ||
| MMP-2 | ||||
| Negative | 23 (69.7%) | 24 (42.9%) | 6.002 | 0.014* |
| Positive | 10 (30.3%) | 32 (57.1%) | ||
| Follow-up results | Total number | Metformin group | Control group |
|---|---|---|---|
| Local recurrence | 2 | 0 | 2 |
| Cutaneous metastasis | 1 | 0 | 1 |
| Bone metastases | 2 | 1 | 1 |
| Ipsilateral regional lymph node metastasis | 2 | 1 | 1 |
| Hepatic metastases | 1 | 0 | 1 |
| Pulmonary metastasis | 2 | 1 | 1 |
| Brain metastases | 1 | 0 | 1 |
| Multiple metastasis | 2 | 1 | 1 |
| Total | 13 | 4 | 9 |