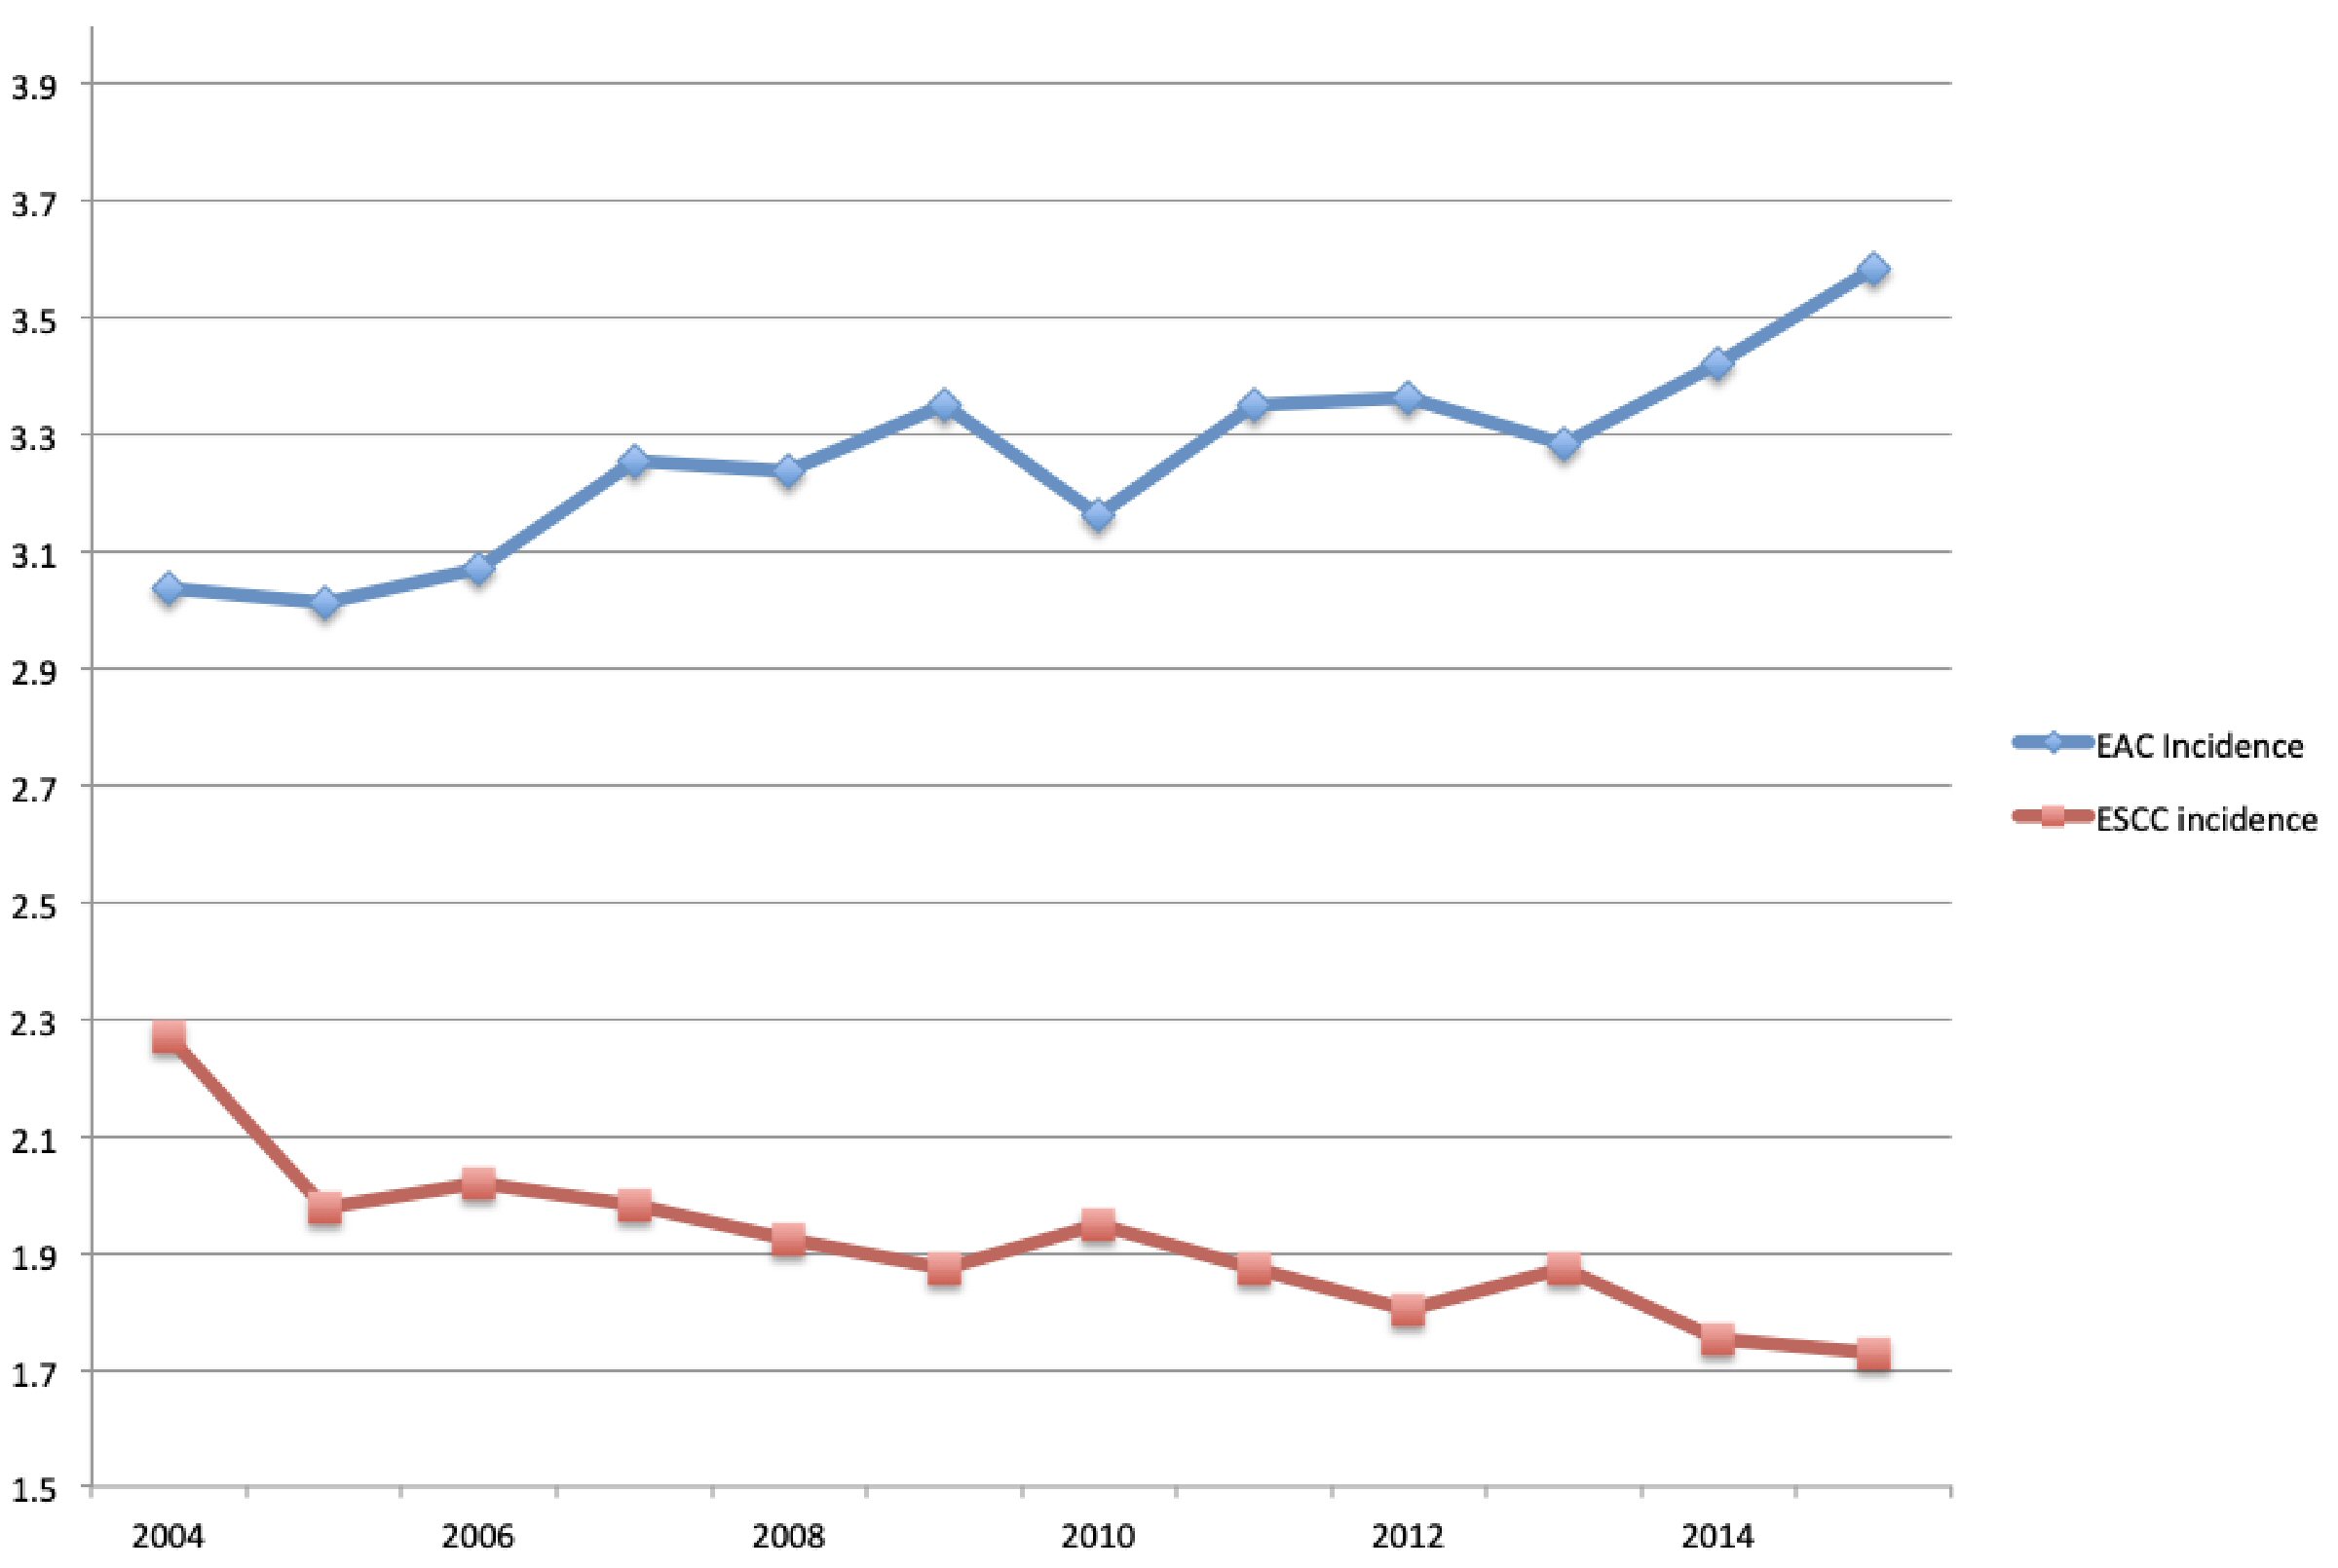
Figure 1. Annual incidence rate of esophageal adenocarcinoma (EAC) and esophageal squamous cell carcinoma (ESCC).
| World Journal of Oncology, ISSN 1920-4531 print, 1920-454X online, Open Access |
| Article copyright, the authors; Journal compilation copyright, World J Oncol and Elmer Press Inc |
| Journal website http://www.wjon.org |
Original Article
Volume 11, Number 2, April 2020, pages 55-64
Esophageal Cancer: An Updated Surveillance Epidemiology and End Results Database Analysis
Figures
Tables
| Variable | Total EAC (n, %) | Total ESCC (n, %) |
|---|---|---|
| EAC: esophageal adenocarcinoma; ESCC: esophageal squamous cell carcinoma. | ||
| Sex | ||
| Male | 20,700 (86.96%) | 9,156 (65.78%) |
| Female | 3,104 (13.04%) | 4,763 (34.22%) |
| Race | ||
| White | 20,951 (88.01%) | 7,754 (55.71%) |
| Black | 649 (2.73%) | 3,649 (26.22%) |
| Hispanic | 1,612 (6.77%) | 1,148 (8.25%) |
| Asian or Pacific Islander | 417 (1.75%) | 1,257 (9.03%) |
| American Indian/Alaskan Native | 124 (0.52%) | 92 (0.66%) |
| Unknown | 51 (0.21%) | 19 (0.14%) |
| Region | ||
| Pacific Coast | 10,098 (42.42%) | 5,940 (42.68%) |
| East | 9,553 (40.13%) | 6,286 (45.16) |
| Northern Plains | 2,959 (12.43%) | 1,274 (9.15%) |
| Southwest | 1,167 (4.90%) | 378 (2.72%) |
| Alaska | 27 (0.11%) | 41 (0.29%) |
| Variable | Total EAC (n, %) | Total ESCC (n, %) |
|---|---|---|
| EAC: esophageal adenocarcinoma; ESCC: esophageal squamous cell carcinoma. | ||
| Tumor grade | ||
| Well differentiated; grade I | 1,227 (5.15%) | 651 (4.68%) |
| Moderately differentiated; grade II | 7,987 (33.55%) | 5,500 (39.51%) |
| Poorly differentiated; grade III | 10,007 (42.04%) | 4,881 (35.07%) |
| Undifferentiated; anaplastic; grade IV | 279 (1.17%) | 106 (0.76%) |
| Unknown | 4,304 (18.09%) | 2,781 (19.98%) |
| Stage | ||
| Stage I | 4,009 (16.84%) | 1,988 (14.28%) |
| Stage II | 4,039 (16.97%) | 2,748 (19.74%) |
| Stage III | 4,355 (18.30%) | 3,091 (22.21%) |
| Stage IV | 8,806 (36.99%) | 3,731 (26.81%) |
| Unknown | 2,595 (10.90%) | 2,361 (16.96%) |
| T staging | ||
| T1 | 6,932 (29.12%) | 3,631 (26.09%) |
| T2 | 2,265 (9.52%) | 1,234 (8.87%) |
| T3 | 7,002 (29.42%) | 3,581 (25.73%) |
| T4 | 2,442 (10.26%) | 2,269 (16.30%) |
| Unknown | 5,163 (21.69%) | 3,204 (23.02%) |
| N staging | ||
| N0 | 13,014 (54.67%) | 7,763 (55.77%) |
| N1 | 10,790 (45.33%) | 6,156 (44.23%) |
| Location | ||
| Upper esophagus | 288 (1.21%) | 2,643 (18.99%) |
| Middle esophagus | 1,846 (7.75%) | 5,444 (39.11%) |
| Lower esophagus | 18,785 (78.92%) | 3,755 (26.98%) |
| Overlapping lesion | 2,885 (12.12%) | 2,077 (14.92%) |
| Surgery | ||
| Surgery performed | 7,831 (32.90%) | 2,214 (15.91%) |
| No surgery performed | 15,973 (67.10%) | 11,705 (84.09%) |
| Radiation | ||
| Radiation given | 12,440 (52.26%) | 8,515 (61.18%) |
| No radiation given | 11,364 (47.74%) | 5,404 (38.82%) |
| Chemotherapy | ||
| Chemotherapy given | 14,830 (62.30%) | 8,384 (60.23%) |
| No chemotherapy given | 8,974 (37.70%) | 5,535 (39.77%) |
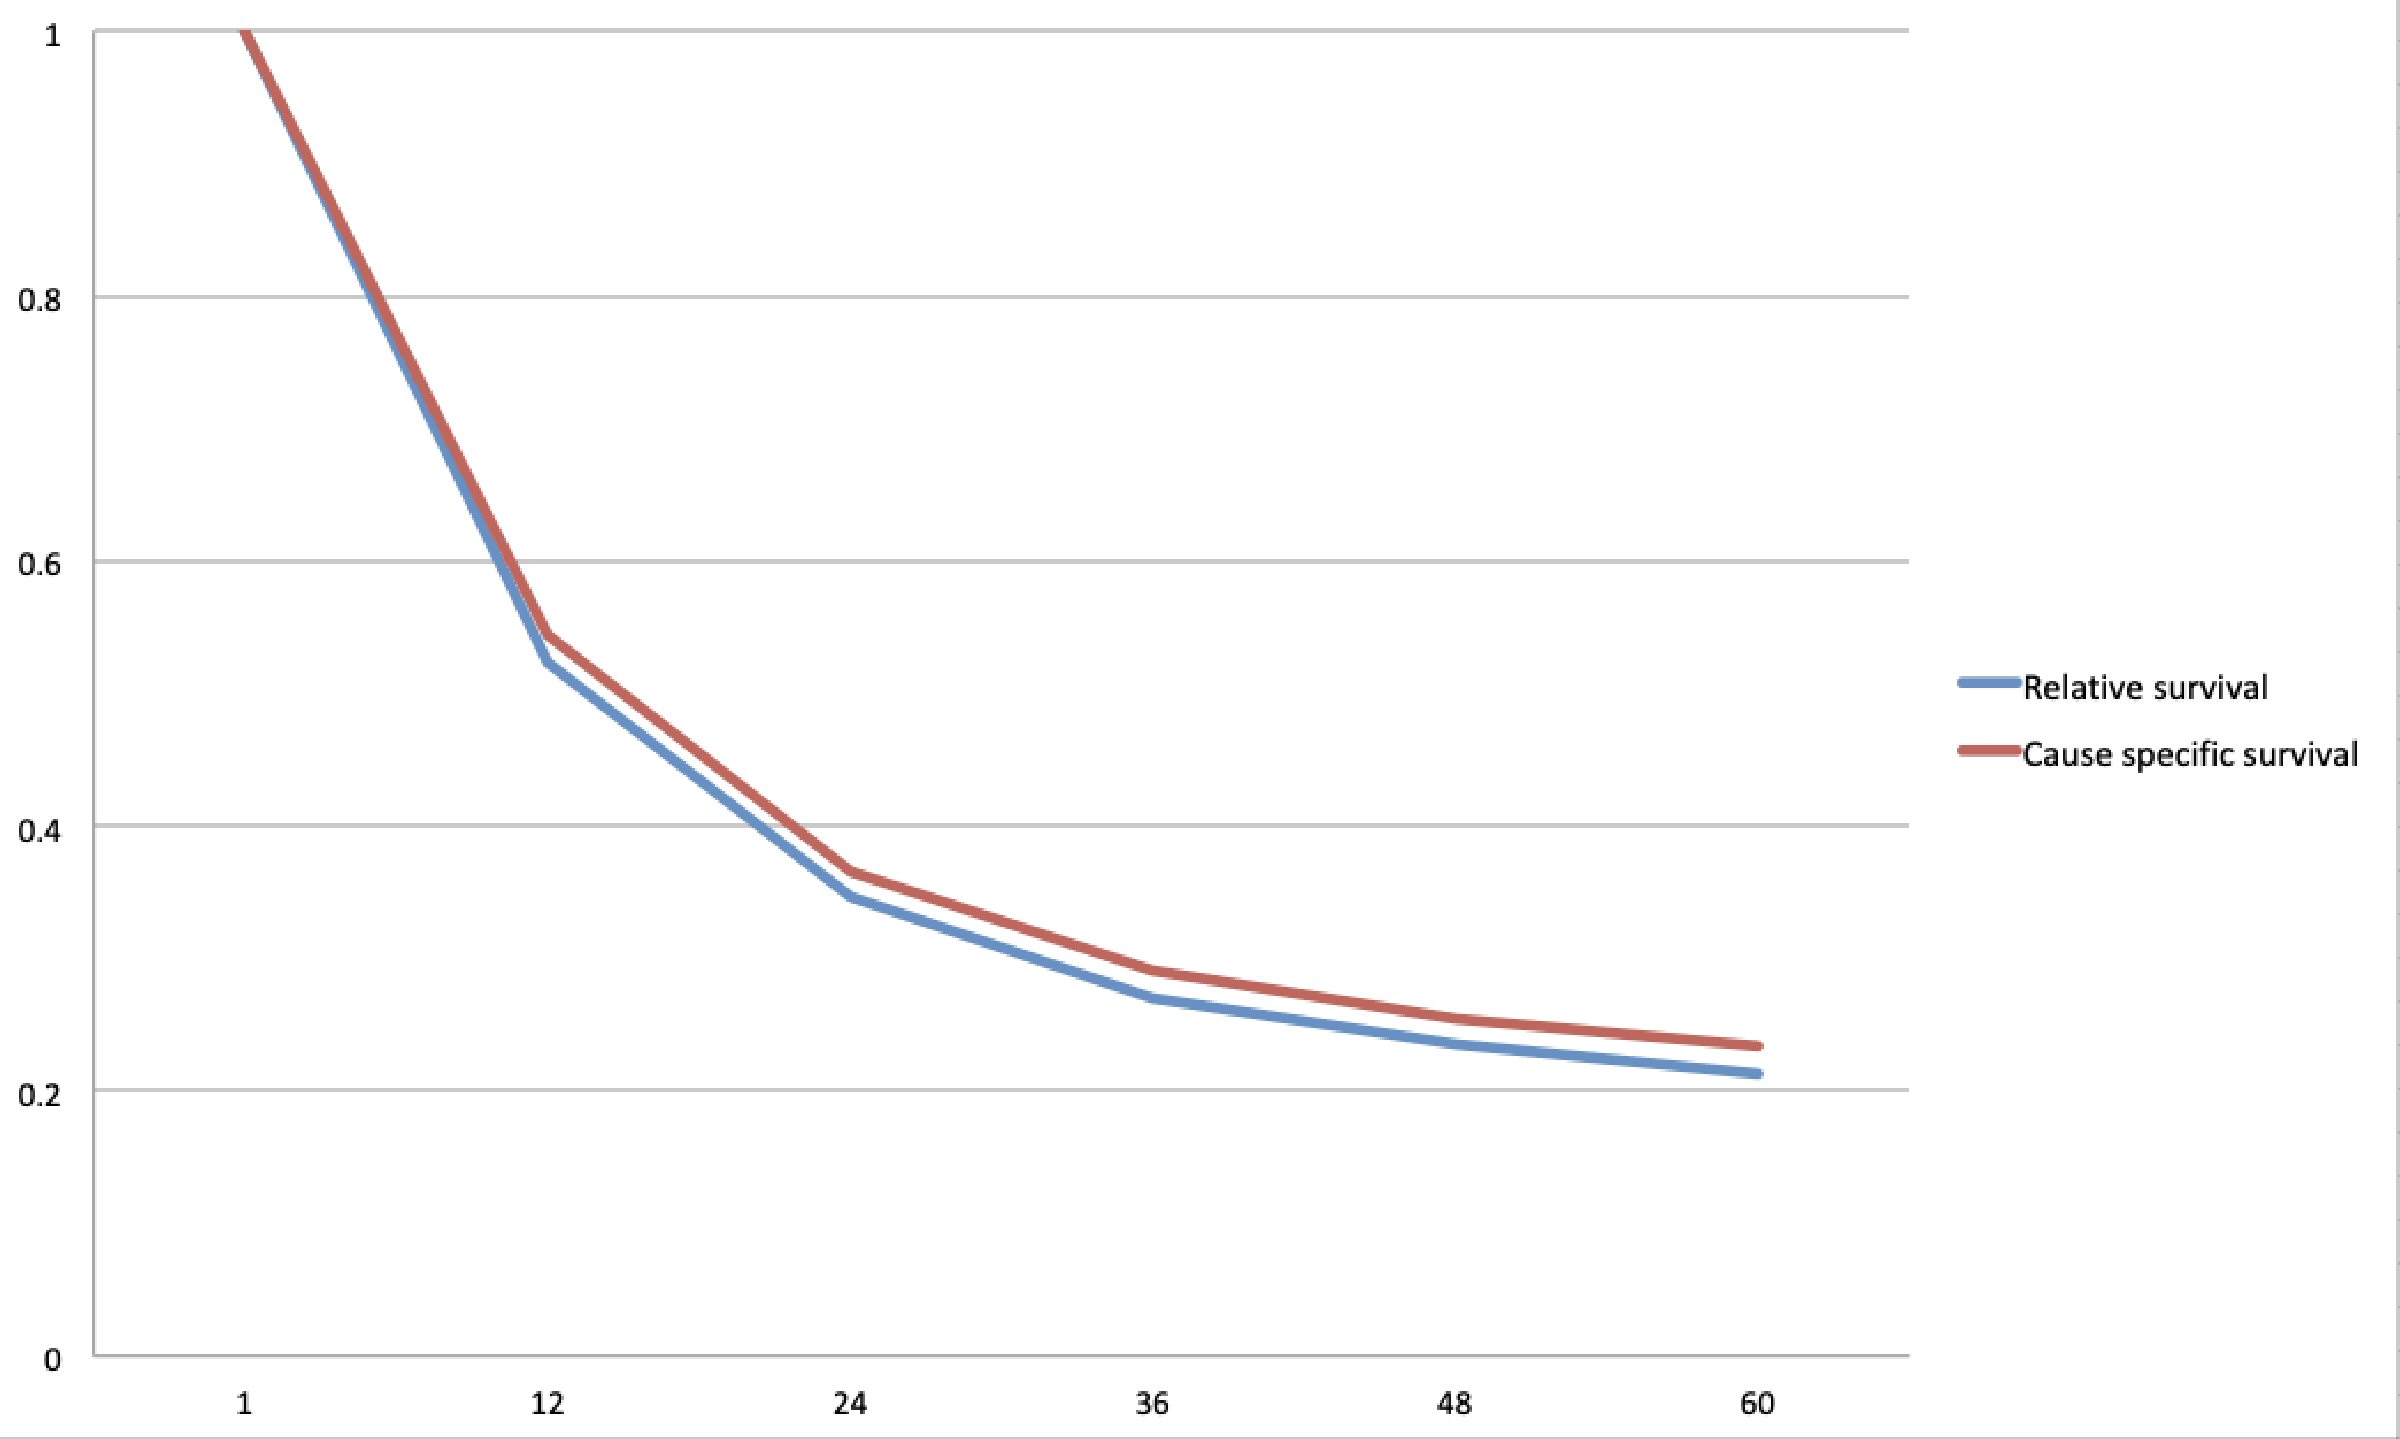
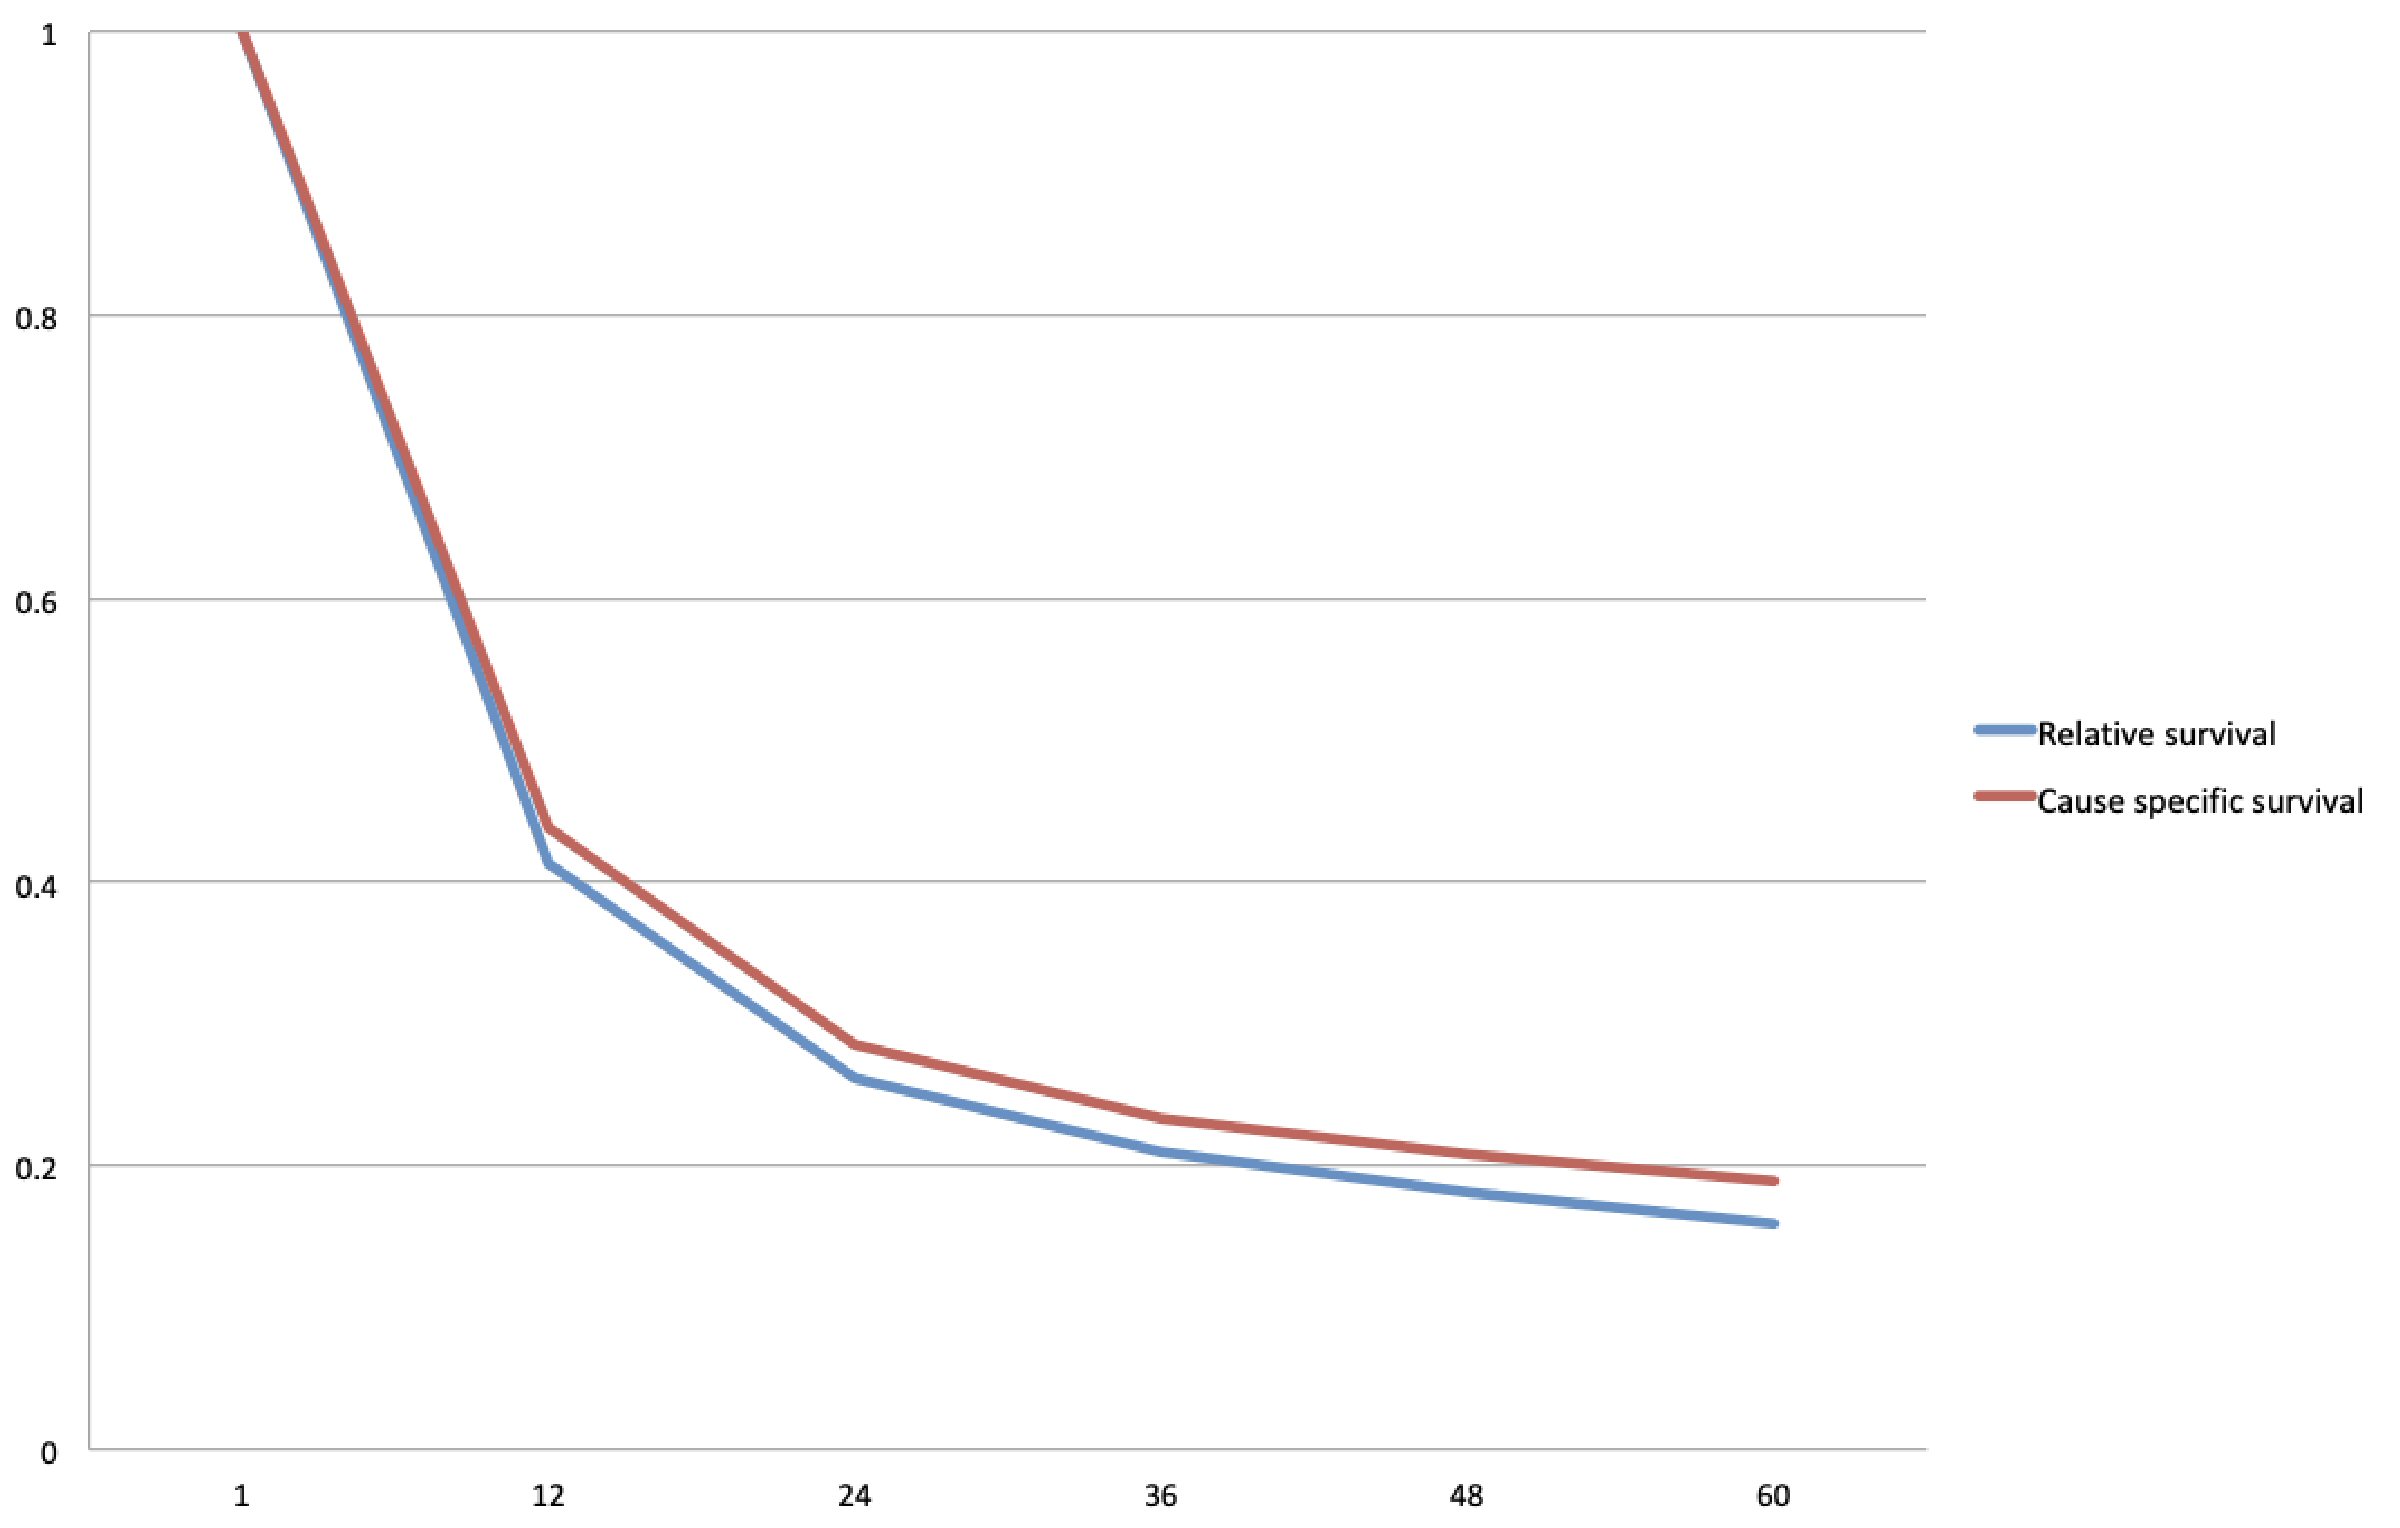
| Survival | EAC | ESCC |
|---|---|---|
| EAC: esophageal adenocarcinoma; ESCC: esophageal squamous cell carcinoma. | ||
| Relative | ||
| 1-year | 52.3% | 41.4% |
| 5-year | 21.3% | 15.9% |
| Median | 13 months | 9 months |
| Cause-specific | ||
| 1-year | 54.4% | 43.8% |
| 5-year | 23.4% | 18.9% |
| Median | 15 months | 10 months |
| Variable | Hazard ratio | 95% Confidence interval | P value |
|---|---|---|---|
| Age at diagnosis | 1.012 | 1.010 - 1.013 | 0.000 |
| Sex | |||
| Male | 1.00 | ||
| Female | 0.932 | 0.892 - 0.975 | 0.002 |
| Race | |||
| White | 1.00 | ||
| Black | 1.091 | 0.996 - 1.194 | 0.061 |
| Hispanic | 1.023 | 0.963 - 1.086 | 0.450 |
| Asian/Pacific Islander | 0.862 | 0.769 - 0.967 | 0.012 |
| American Indian/Alaskan | 1.143 | 0.929 - 1.407 | 0.205 |
| Location | |||
| Upper esophagus | 1.00 | ||
| Middle esophagus | 1.202 | 1.037 - 1.395 | 0.014 |
| Lower esophagus | 1.123 | 0.977 - 1.291 | 0.101 |
| Overlapping lesion | 1.177 | 1.019 - 1.361 | 0.027 |
| Tumor size | 0.999 | 0.999 - 1.000 | 0.812 |
| Grade | |||
| Grade I | 1.00 | ||
| Grade II | 1.226 | 1.134 - 1.325 | 0.000 |
| Grade III | 1.563 | 1.447 - 1.689 | 0.000 |
| Grade IV | 1.404 | 1.204 - 1.637 | 0.000 |
| Unknown | 1.117 | 1.029 - 1.212 | 0.008 |
| Stage | |||
| Stage I | 1.00 | ||
| Stage II | 1.962 | 1.821 - 2.115 | 0.000 |
| Stage III | 2.447 | 2.247 - 2.666 | 0.000 |
| Stage IV | 3.587 | 3.336 - 3.857 | 0.000 |
| Unknown | 1.669 | 1.539 - 1.809 | 0.000 |
| T - stage | |||
| T1 | 1.00 | ||
| T2 | 0.765 | 0.713 - 0.820 | 0.000 |
| T3 | 0.895 | 0.848 - 0.945 | 0.000 |
| T4 | 1.109 | 1.041 - 1.182 | 0.001 |
| Unknown | 1.171 | 1.108 - 1.238 | 0.000 |
| N - stage | |||
| N0 | 1.00 | ||
| N1 | 1.078 | 1.039 - 1.118 | 0.000 |
| Unknown | |||
| Surgery | |||
| Surgery performed | 1.00 | ||
| No surgery performed | 2.545 | 2.443 - 2.652 | 0.000 |
| Radiation | |||
| Radiation given | 1.00 | ||
| No radiation given | 0.917 | 0.884 - 0.950 | 0.000 |
| Chemotherapy | |||
| Chemotherapy given | 1.000 | ||
| No chemotherapy given | 1.689 | 1.622 - 1.758 | 0.000 |
| Variable | Hazard ratio | 95% Confidence interval | P value |
|---|---|---|---|
| Age at diagnosis | 1.005 | 1.003 - 1.007 | 0.000 |
| Sex | |||
| Male | 1.00 | ||
| Female | 0.833 | 0.800 - 0.0868 | 0.000 |
| Race | |||
| White | 1.00 | ||
| Black | 1.117 | 1.068 - 1.169 | 0.000 |
| Hispanic | 0.937 | 0.872 - 1.006 | 0.076 |
| Asian/Pacific Islander | 0.893 | 0.833 - 0.956 | 0.001 |
| American Indian/Alaskan | 1.061 | 0.836 - 1.346 | 0.623 |
| Location | |||
| Upper esophagus | 1.00 | ||
| Middle esophagus | 1.126 | 1.068 - 1.188 | 0.000 |
| Lower esophagus | 1.127 | 1.063 - 1.195 | 0.000 |
| Overlapping lesion | 1.210 | 1.132 - 1.293 | 0.000 |
| Tumor size | 1.000 | 0.999 - 1.000 | 0.400 |
| Grade | |||
| Grade I | 1.00 | ||
| Grade II | 1.322 | 1.200 - 1.457 | 0.000 |
| Grade III | 1.358 | 1.231 - 1.497 | 0.000 |
| Grade IV | 1.169 | 0.923 - 1.480 | 0.194 |
| Unknown | 1.161 | 1.048 - 1.285 | 0.004 |
| Stage | |||
| Stage I | 1.00 | ||
| Stage II | 1.266 | 1.158 - 1.384 | 0.000 |
| Stage III | 1.431 | 1.287 - 1.592 | 0.000 |
| Stage IV | 2.127 | 1.945 - 2.326 | 0.000 |
| Unknown | 1.273 | 1.152 - 1.407 | 0.000 |
| T-stage | |||
| T1 | 1.00 | ||
| T2 | 0.816 | 0.745 - 0.893 | 0.000 |
| T3 | 0.946 | 0.880 - 1.017 | 0.133 |
| T4 | 1.346 | 1.241 - 1.460 | 0.000 |
| Unknown | 1.064 | 0.984 - 1.150 | 0.116 |
| N-stage | |||
| N0 | 1.00 | ||
| N1 | 1.045 | 0.998 - 1.094 | 0.060 |
| Unknown | |||
| Surgery | |||
| Surgery performed | 1.00 | ||
| No surgery performed | 2.370 | 2.226 - 2.52 | 0.000 |
| Radiation | |||
| Radiation given | 1.00 | ||
| No radiation given | 1.319 | 1.258 - 1.384 | 0.000 |
| Chemotherapy | |||
| Chemotherapy given | 1.00 | ||
| No chemotherapy given | 1.840 | 1.755 - 1.930 | 0.000 |