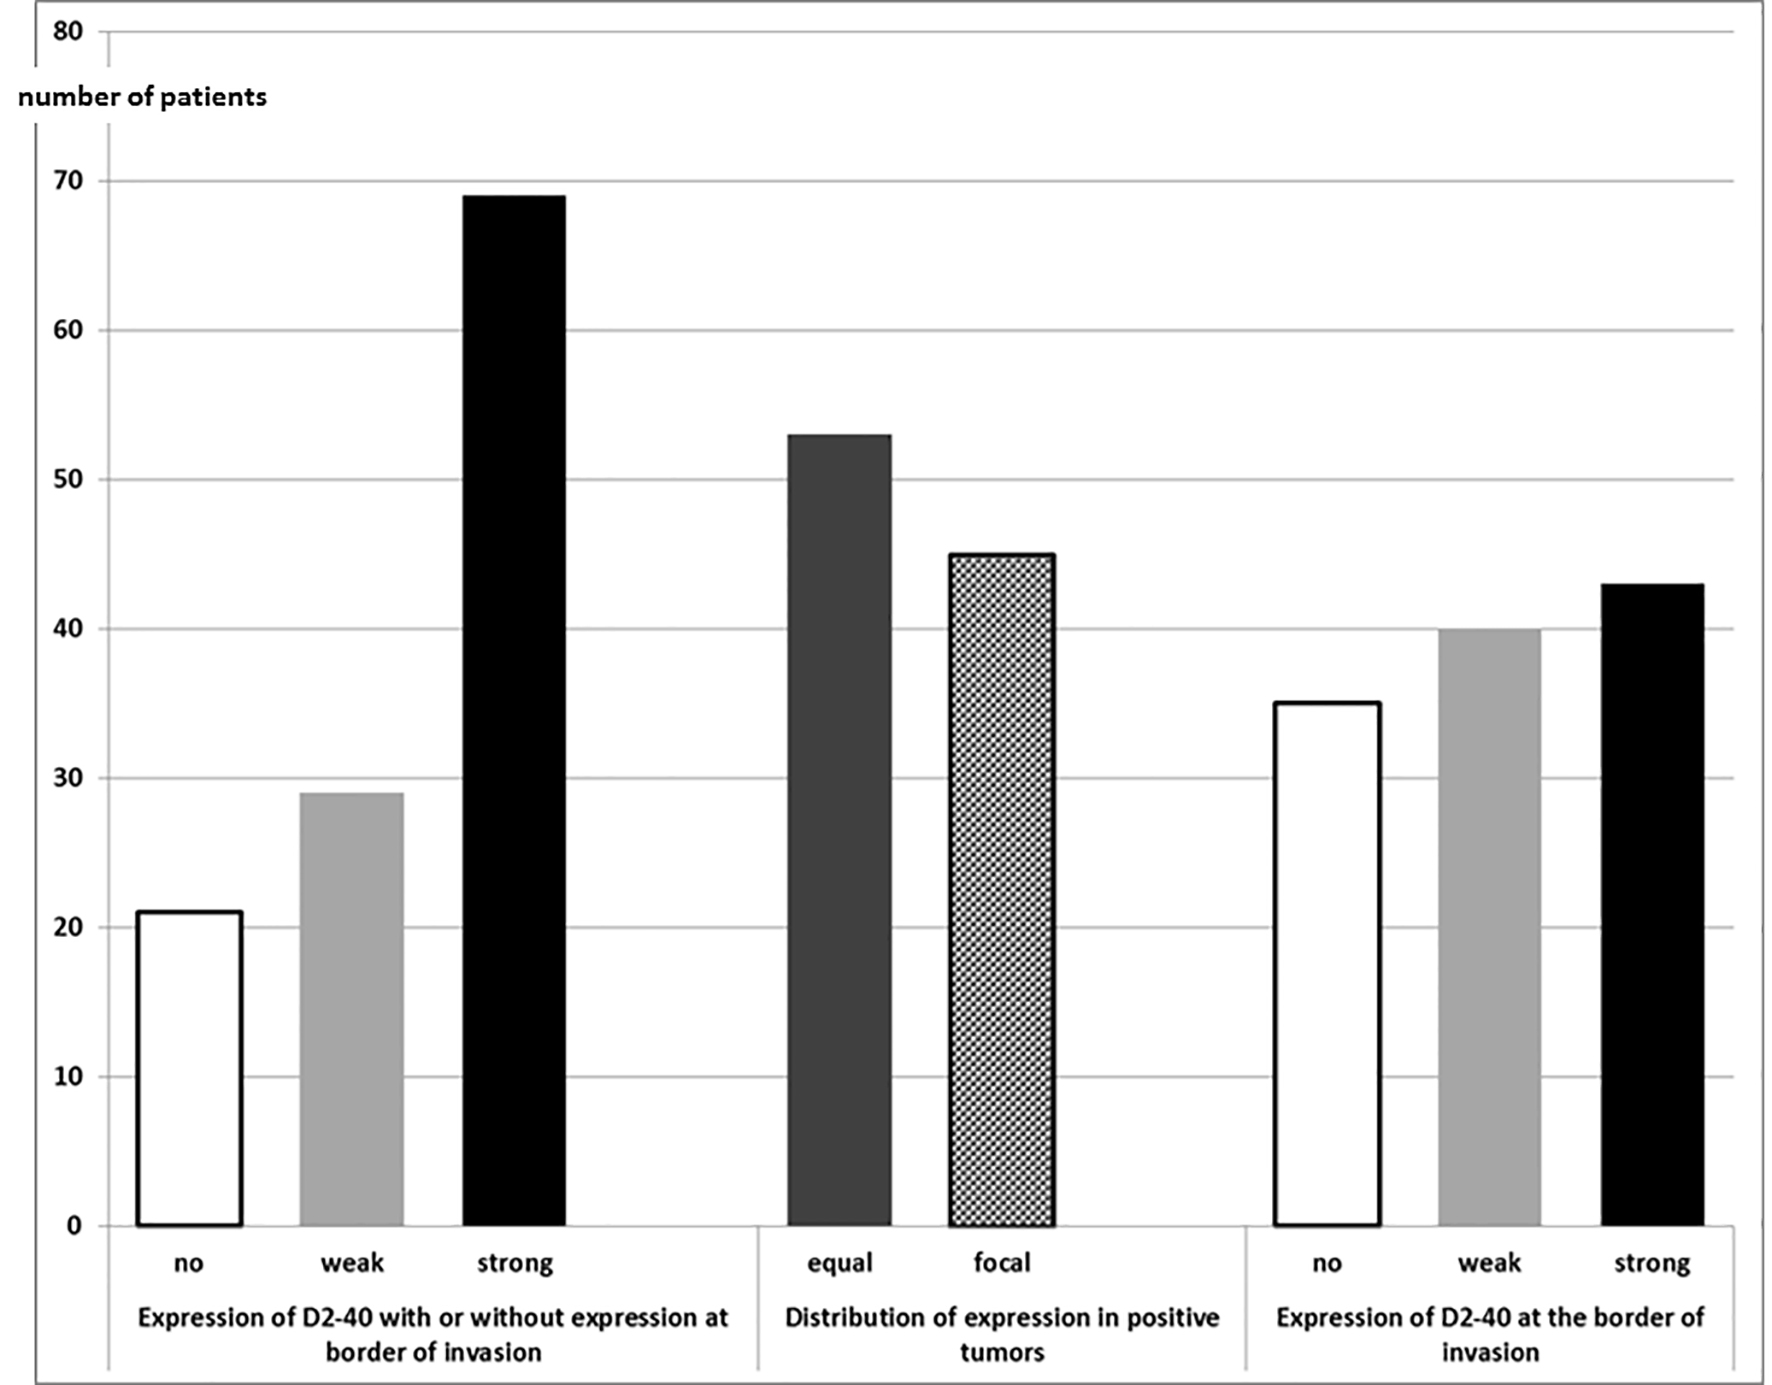
Figure 1. Expression of D2-40 in SCC of larynx and hypopharynx (n = 119). SCC: squamous cell carcinoma.
| World Journal of Oncology, ISSN 1920-4531 print, 1920-454X online, Open Access |
| Article copyright, the authors; Journal compilation copyright, World J Oncol and Elmer Press Inc |
| Journal website http://www.wjon.org |
Original Article
Volume 11, Number 2, April 2020, pages 65-71
Prognostic Potential of the Expression of Podoplanin (D2-40) Within Cells of Squamous Cell Carcinoma of the Larynx and Hypopharynx
Figures
Tables
| Larynx (n = 70) | Hypopharynx (n = 49) | |
|---|---|---|
| *P < 0.05. | ||
| Median age (years) | 62.2 (45 - 85) | 57.2 (38 - 75)* |
| Male/female | 66:4 | 43:6 |
| Median tumor size (cm) | 2.5 (0.6-5.2) | 3.4 (1.0 - 6.5)* |
| Stage (pT1/pT2/pT3/pT4) | 11/5/22/32 | 7/10/17/15 |
| Grading (G1/G2/G3) | 5/43/22 | 1/25/23 |
| Median number of investigated lymph nodes | 30.4 (4 - 76) | 31.5 (5 - 82) |
| pN0/pN+ | 40/30 (43% pN+) | 14/35 (71% pN+)* |
| Median number of nodal metastases in pN+ | 2 (1 - 25) | 3 (1 - 17) |
| Reaction in tumor cells | Reaction at border of invasion | n | % | |
|---|---|---|---|---|
| No | No | 21 | 17.6 | |
| Weak expression | Equally | No | 2 | 1.7 |
| Equally | Positive | 17 | 14.3 | |
| Focally | No | 6 | 5.0 | |
| Focally | Positive | 4 | 3.4 | |
| Strong expression | Equally | Positive | 34 | 28.6 |
| Focally | No | 7 | 5.9 | |
| Focally | Positive | 28 | 23.5 |
| Larynx | Hypopharynx | P (Chi-square) | |||
|---|---|---|---|---|---|
| n | % | n | % | ||
| No difference in the intensity of stain (P > 0.22). | |||||
| No reaction of tumor cells | 7 | 8.7 | 14 | 28.6 | 0.0047 |
| positive reaction anywhere in the tumor | 63 | 91.3 | 35 | 71.4 | |
| No reaction at the border of invasion | 16 | 23.2 | 19 | 38.8 | 0.069 |
| Positive reaction at the border of invasion | 53 | 76.8 | 30 | 61.2 | |
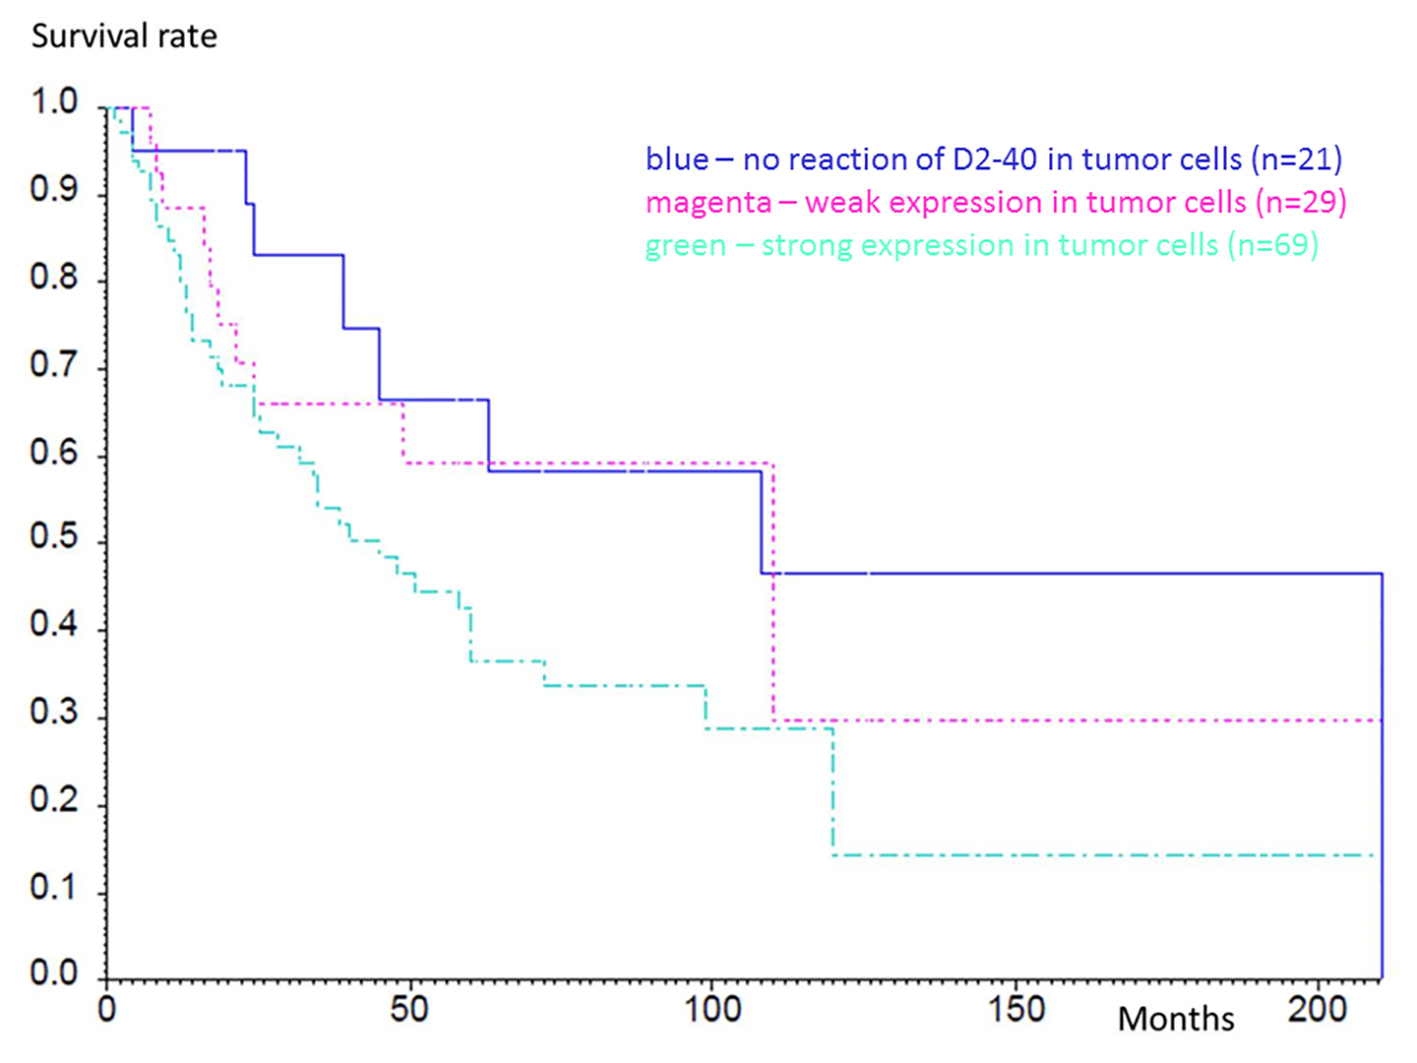
| Survival (months) | All (n = 119) | Negative(n = 21) | Weak expression(n = 29) | Strong expression(n = 69) | |||
|---|---|---|---|---|---|---|---|
| n | % | n | % | n | % | ||
| 0 | 119 | 21 | 100 | 29 | 100 | 69 | 100 |
| 6 | 108 | 19 | 95 | 28 | 100 | 61 | 93 |
| 12 | 93 | 19 | 95 | 22 | 88 | 52 | 80 |
| 24 | 69 | 15 | 83 | 15 | 66 | 39 | 65 |
| 60 | 37 | 8 | 67 | 8 | 59 | 21 | 36 |
| n | HR | 68% CI (HR) | P (Chi-square) | |
|---|---|---|---|---|
| pN+ | 119 | 2.265 | 1.712 (2.996) | 0.0035** |
| D2-40 | 119 | 1.559 | 1.290 (1.884) | 0.019* |