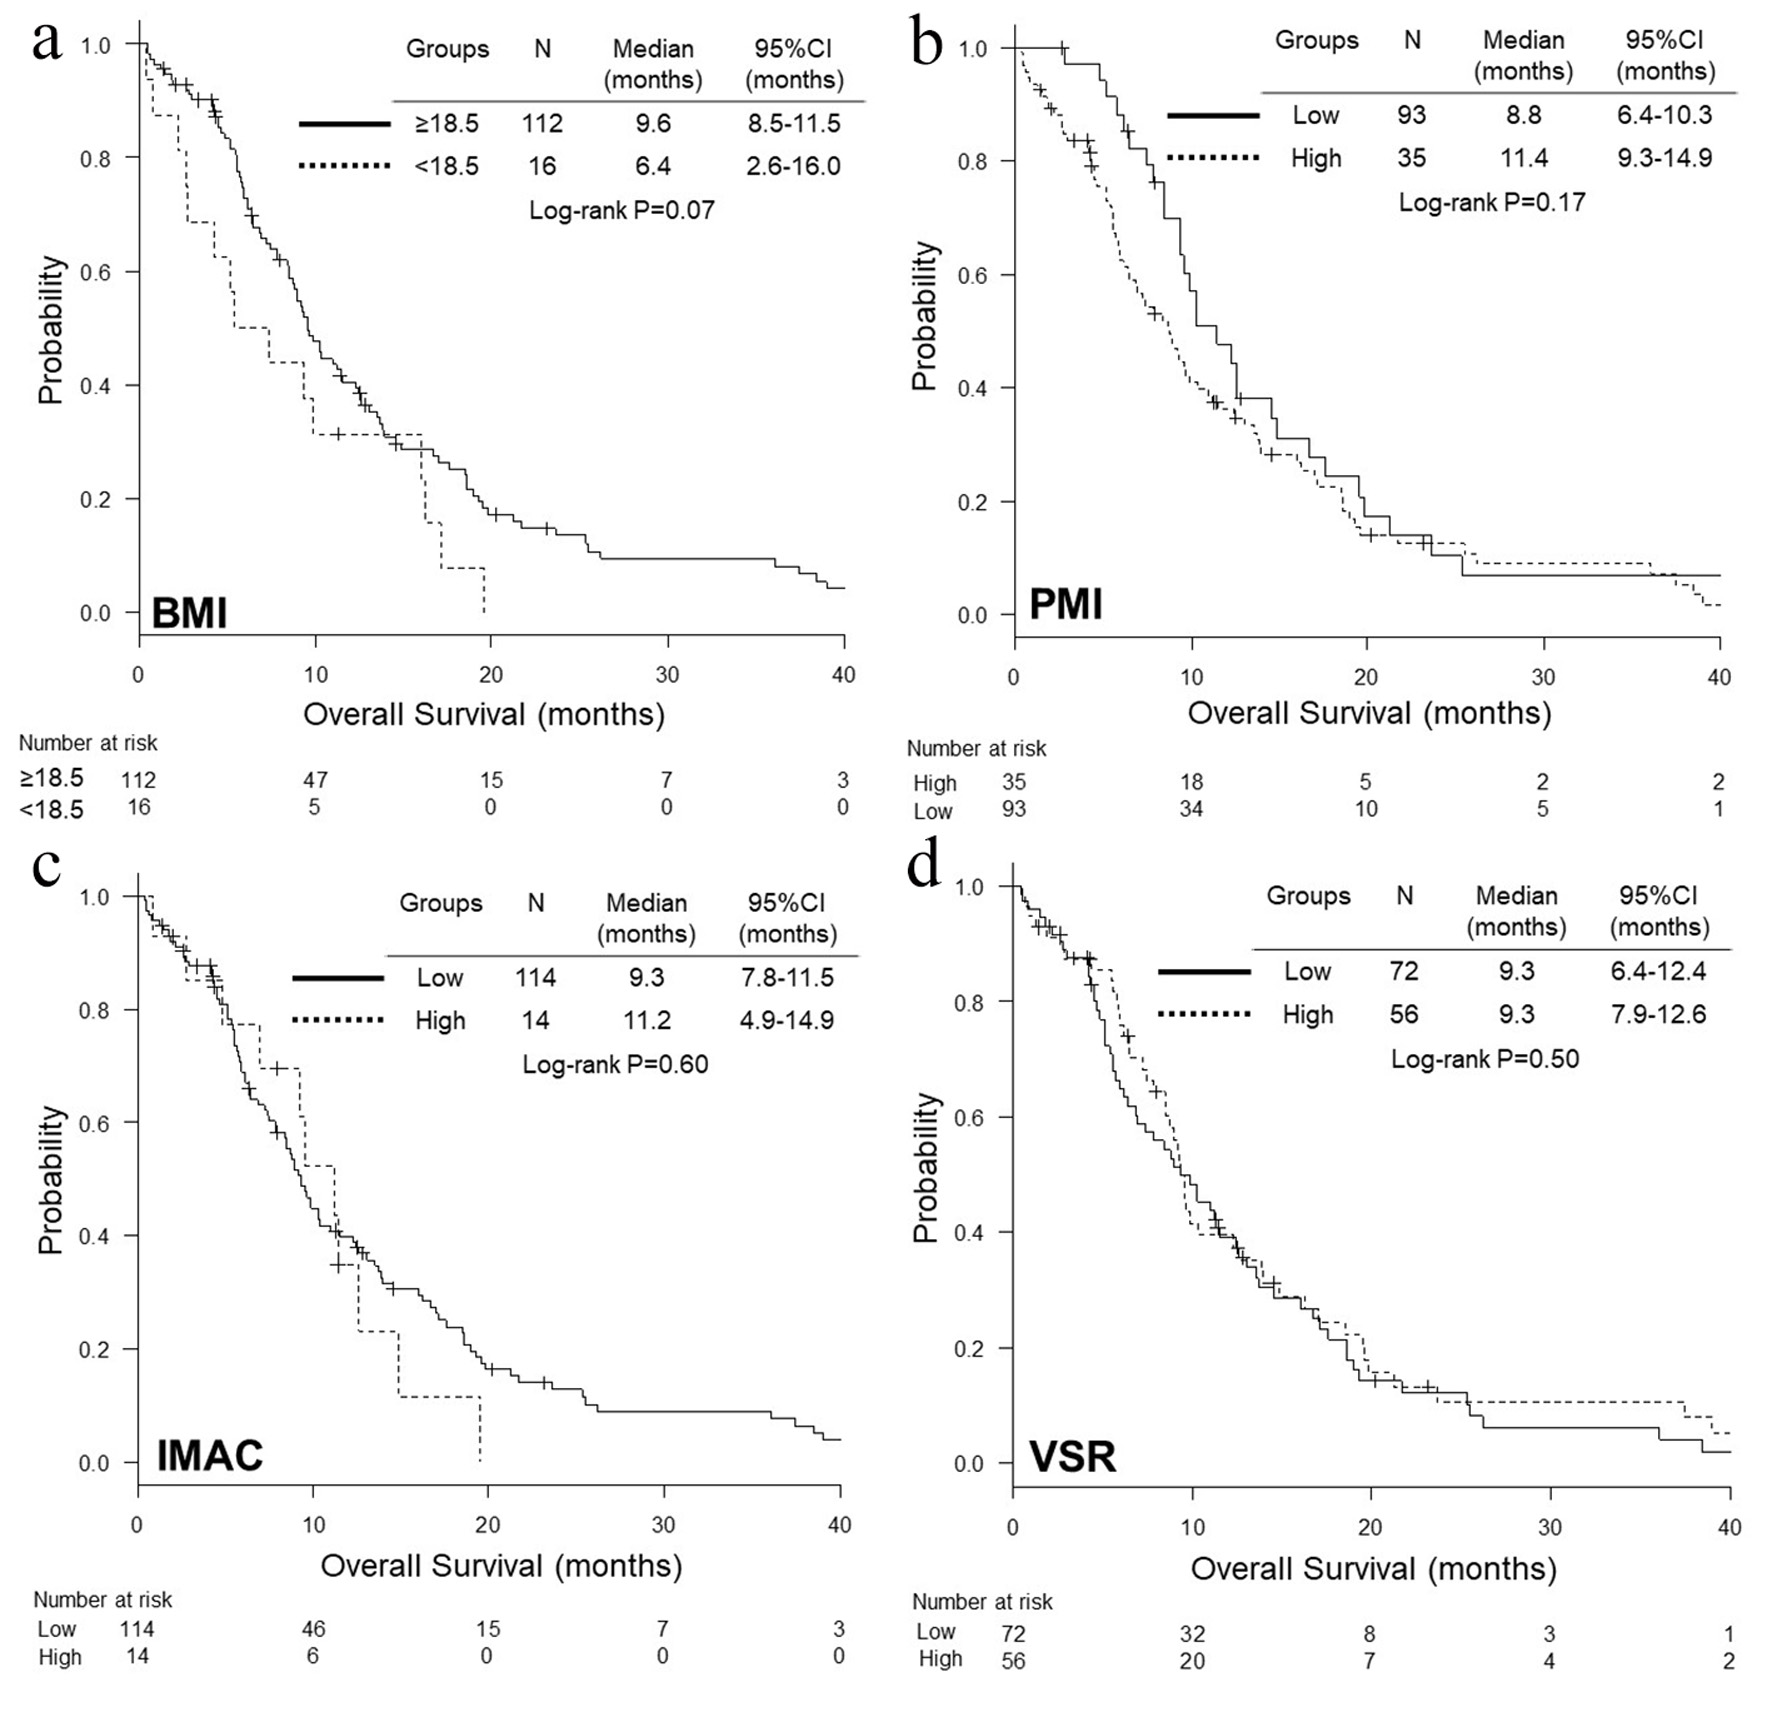
Figure 1. Kaplan-Meier curves of overall survival according to BMI (a), PMI (b), IMAC (c) and VSR (d). BMI: body mass index; PMI: psoas muscle index; IMAC: intramuscular adipose tissue content; VSR: visceral-to-subcutaneous fat ratio.
| World Journal of Oncology, ISSN 1920-4531 print, 1920-454X online, Open Access |
| Article copyright, the authors; Journal compilation copyright, World J Oncol and Elmer Press Inc |
| Journal website https://www.wjon.org |
Original Article
Volume 11, Number 4, August 2020, pages 139-149
Sarcopenia and Visceral Adiposity Are Not Independent Prognostic Markers for Extensive Disease of Small-Cell Lung Cancer: A Single-Centered Retrospective Cohort Study
Figures
Tables
| BMI | P | ||
|---|---|---|---|
| < 18.5 | ≥ 18.5 | ||
| aFisher’s exact test; bMann-Whitney U test. BMI: body mass index; CR: complete response; CS: current smoker; DCR: disease control rate; ECOG-PS: Eastern Cooperative Oncology Group-performance status; Ex: ex-smoker; IQR: interquartile range; NE: not evaluated; NS: non-smoker; ORR: overall response rate; PD: progressive disease; PR: partial response; SD: stable disease; ULN: upper limit of normal range; LDH: lactate dehydrogenase. | |||
| N | 16 | 112 | |
| Backgrounds | |||
| Sex (N), men/women | 10/6 | 91/21 | 0.10a |
| Age (years) | |||
| Median (IQR) | 72.5 (67.8 - 76) | 71.5 (64.8 - 78) | 0.33b |
| < 75/≥ 75 years (N) | 9/7 | 70/42 | 0.78a |
| Smoking status, NS/Ex/CS/unknown | 1/4/11/0 | 2/37/72/1 | 0.45a |
| ECOG-PS, 0 - 1/2/3 | 7/7/2 | 70/24/18 | 0.21a |
| c-stage, IIIB/IV | 1/15 | 18/94 | 0.46a |
| Metastatic sites | |||
| Brain | 2 | 22 | 0.74a |
| Liver | 6 | 31 | 0.56a |
| Bone | 3 | 15 | 0.70a |
| BMI, median (IQR) | 16.9 (16.1 - 17.3) | 23.1 (20.6 - 25.8) | < 0.01b |
| Treatment | |||
| Platinum-based, cisplatin/carboplatin | 2/14 | 29/83 | 0.35a |
| Partner drugs, etoposide/irinotecan | 0/16 | 15/97 | 0.21a |
| Efficacy | |||
| CR/PR/SD/PD/NE | 0/7/2/4/3 | 2/69/15/17/9 | |
| ORR (%) | 43.8 | 63.4 | 0.17a |
| DCR (%) | 56.2 | 76.8 | 0.12a |
| Second or later line (N) | 7 | 62 | 0.43a |
| Amrubicin (N) | 5 | 44 | 0.60a |
| Topotecan (N) | 0 | 13 | 0.37a |
| Irinotecan (N) | 0 | 7 | 0.60a |
| Pretreatment laboratory data | |||
| Albumin (g/dL) | |||
| Median (IQR) | 3.1 (2.8 - 3.9) | 3.7 (3.2 - 3.9) | 0.13b |
| ≥ 3.5/< 3.5 g/dL (N) | 6/10 | 68/44 | 0.11a |
| LDH (IU/L) | |||
| Median (IQR) | 266 (201 - 492) | 286 (217 - 402) | 0.94b |
| < ULN/≥ ULN | 6/10 | 31/81 | 0.56a |
| PMI | P | ||
|---|---|---|---|
| Low | High | ||
| aFisher’s exact test; bMann-Whitney U test. BMI: body mass index; PMI: psoas muscle index; CR: complete response; CS: current smoker; DCR: disease control rate; ECOG-PS: Eastern Cooperative Oncology Group-performance status; Ex: ex-smoker; IQR: interquartile range; NE: not evaluated; NS: non-smoker; ORR: overall response rate; PD: progressive disease; PR: partial response; SD: stable disease; ULN: upper limit of normal range; LDH: lactate dehydrogenase. | |||
| N | 93 | 35 | |
| Backgrounds | |||
| Sex (N), men/women | 75/18 | 26/9 | 0.47a |
| Age (years) | |||
| Median (IQR) | 71 (66 - 76) | 72 (63.5 - 79) | 0.79b |
| < 75/≥ 75 years (N) | 59/34 | 20/15 | 0.55a |
| Smoking status, NS/Ex/CS/unknown | 1/29/62/1 | 2/12/21/0 | 0.43a |
| ECOG-PS, 0 - 1/2/3 | 51/25/17 | 26/6/3 | 0.15a |
| c-stage, IIIB/IV | 14/79 | 5/30 | 1.00a |
| Metastatic sites | |||
| Brain | 17 | 7 | 0.80a |
| Liver | 29 | 8 | 0.39a |
| Bone | 14 | 4 | 0.79a |
| BMI | |||
| Median (IQR) | 21.0 (19.1 - 24.0) | 24.6 (23.2 - 27.1) | < 0.01b |
| ≥ 18.5/< 18.5 | 78/15 | 34/1 | 0.07a |
| Treatment | |||
| Platinum-based, cisplatin/carboplatin | 22/71 | 9/26 | 0.82a |
| Partner drugs, etoposide/irinotecan | 81/12 | 32/3 | 0.76a |
| Efficacy | |||
| CR/PR/SD/PD/NE | 0/57/10/16/10 | 2/19/7/5/2 | |
| ORR (%) | 61.3 | 60.0 | 1.00a |
| DCR (%) | 72.0 | 80.0 | 0.50a |
| Second or later line (N) | 46 | 23 | 0.12a |
| Amrubicin (N) | 34 | 15 | 0.55a |
| Topotecan (N) | 9 | 4 | 0.75a |
| Irinotecan (N) | 5 | 2 | 1.00a |
| Pretreatment laboratory data | |||
| Albumin (g/dL) | |||
| Median (IQR) | 3.6 (3.0 - 3.9) | 3.7 (3.3 - 3.9) | 0.57b |
| ≥ 3.5/< 3.5 g/dL (N) | 49/44 | 25/10 | 0.07a |
| LDH (IU/L) | |||
| Median (IQR) | 282 (218 - 410) | 323 (205 - 410) | 0.69b |
| < ULN/≥ ULN | 26/67 | 11/24 | 0.83a |
| IMAC | P | ||
|---|---|---|---|
| Low | High | ||
| aFisher’s exact test; bMann-Whitney U test. IMAC: intramuscular adipose tissue content; BMI: body mass index; CR: complete response; CS: current smoker; DCR: disease control rate; ECOG-PS: Eastern Cooperative Oncology Group-performance status; Ex: ex-smoker; IQR: interquartile range; NE: not evaluated; NS: non-smoker; ORR: overall response rate; PD: progressive disease; PR: partial response; SD: stable disease; ULN: upper limit of normal range. | |||
| N | 114 | 14 | |
| Backgrounds | |||
| Sex (N), men/women | 89/25 | 12/2 | 0.73a |
| Age (years) | |||
| Median (IQR) | 71.5 (66 - 76) | 76.5 (66.5 - 81.8) | 0.15b |
| < 75/≥ 75 years (N) | 72/42 | 7/7 | 0.39a |
| Smoking status, NS/Ex/CS | 2/36/75/1 | 1/5/8/0 | 0.41a |
| ECOG-PS, 0 - 1/2/3 | 71/27/16 | 6/4/4 | 0.27a |
| c-stage, IIIB/IV | 17/97 | 2/12 | 1.00a |
| Metastatic sites | |||
| Brain | 24 | 0 | 0.07a |
| Liver | 31 | 6 | 0.23a |
| Bone | 17 | 1 | 0.69a |
| BMI | |||
| Median (IQR) | 21.8 (19.5 - 24.5) | 24.1 (22.9 - 25.7) | 0.06b |
| ≥ 18.5/< 18.5 | 98/16 | 14/0 | 0.21a |
| Treatment | |||
| Platinum-based, cisplatin/carboplatin | 29/85 | 2/12 | 0.52a |
| Partner drugs, etoposide/irinotecan | 99/15 | 14/0 | 0.37a |
| Efficacy | |||
| CR/PR/SD/PD/NE | 2/69/14/18/11 | 0/7/3/3/1 | |
| ORR (%) | 62.3 | 50.0 | 0.40a |
| DCR (%) | 74.6 | 71.4 | 0.76a |
| Second or later line (N) | 62 | 7 | 0.78a |
| Amrubicin (N) | 43 | 6 | 0.77a |
| Topotecan (N) | 12 | 1 | 1.00a |
| Irinotecan (N) | 7 | 0 | 1.00a |
| Pretreatment laboratory data | |||
| Albumin (g/dL) | |||
| Median (IQR) | 3.7 (3.1 - 3.9) | 3.4 (2.9 - 3.8) | 0.21b |
| ≥ 3.5/< 3.5 g/dL (N) | 68/46 | 6/8 | 0.26a |
| LDH (IU/L) | |||
| Median (IQR) | 285 (210 - 428) | 292 (225 - 388) | 0.79b |
| < ULN/≥ ULN | 33/81 | 4/10 | 1.00a |
| VSR | P | ||
|---|---|---|---|
| Low | High | ||
| aFisher’s exact test; bMann-Whitney U test. VSR: visceral-to-subcutaneous fat ratio; BMI: body mass index; CR: complete response; CS: current smoker; DCR: disease control rate; ECOG-PS: Eastern Cooperative Oncology Group-performance status; Ex: ex-smoker; IQR: interquartile range; NE: not evaluated; NS: non-smoker; ORR: overall response rate; PD: progressive disease; PR: partial response; SD: stable disease; ULN: upper limit of normal range; LDH: lactate dehydrogenase. | |||
| N | 72 | 56 | |
| Backgrounds | |||
| Sex (N), men/women | 52/20 | 49/7 | 0.049a |
| Age (years) | |||
| Median (IQR) | 69 (64.8 - 76) | 73.5 (67.8 - 78.3) | 0.04b |
| < 75/≥ 75 years (N) | 50/22 | 29/27 | 0.046a |
| Smoking status, NS/Ex/CS | 1/22/49/0 | 2/19/34/1 | 0.54a |
| ECOG-PS, 0 - 1/2/3 | 40/19/13 | 37/12/7 | 0.47a |
| c-stage, IIIB/IV | 10/62 | 9/47 | 0.80a |
| Metastatic sites | |||
| Brain | 15 | 9 | 0.65a |
| Liver | 20 | 17 | 0.85a |
| Bone | 10 | 8 | 1.00a |
| BMI | |||
| Median (IQR) | 21.1 (19.1 - 24.3) | 23.3 (20.9 - 26.2) | 0.02b |
| ≥ 18.5/< 18.5 | 60/12 | 52/4 | 0.18a |
| Treatment | |||
| Platinum-based, cisplatin/carboplatin | 17/55 | 14/42 | 1.00a |
| Partner drugs, etoposide/irinotecan | 65/7 | 48/8 | 0.58a |
| Efficacy | |||
| CR/PR/SD/PD/NE | 1/44/6/14/7 | 1/32/11/7/5 | |
| ORR (%) | 62.5 | 58.9 | 0.72a |
| DCR (%) | 70.8 | 78.6 | 0.42a |
| Second or later line (N) | 37 | 32 | 0.59a |
| Amrubicin (N) | 25 | 24 | 0.37a |
| Topotecan (N) | 7 | 6 | 1.00a |
| Irinotecan (N) | 5 | 2 | 0.47a |
| Pretreatment Laboratory data | |||
| Albumin (g/dL) | |||
| Median (IQR) | 3.4 (3.1 - 3.9) | 3.8 (3.2 - 4.0) | 0.15b |
| ≥ 3.5/< 3.5 g/dL (N) | 35/37 | 39/17 | 0.02a |
| LDH (IU/L) | |||
| Median (IQR) | 270 (217 - 430) | 304 (209 - 402) | 0.63b |
| < ULN/≥ ULN | 21/51 | 16/40 | 1.00a |
| Variables | PFS, HR (95% CI) | P | OS, HR (95% CI) | P |
|---|---|---|---|---|
| Multivariate adjustment for age (< 75 vs. 5 75 years), serum albumin (≥ 3.5 vs. < 3.5 g/dL), LDH (≤ UNL vs. > UNL), c-stage (IIIB vs. IV) and ECOG-PS (0 - 1 vs. 2 - 4). BMI: body mass index; CI: confidence interval; ECOG-PS: Eastern Cooperative Oncology Group-performance status; HR: hazard ratio; IMAC: intramuscular adipose tissue content; LDH: lactate dehydrogenase; PMI: psoas muscle index; UNL: upper limit of normal range; VSR: visceral-to-subcutaneous fat ratio; PFS: progression-free survival; OS: overall survival. | ||||
| BMI | ||||
| ≥ 18.5 | 1 (reference) | 1 (reference) | ||
| < 18.5 | 1.36 (0.79 - 2.34) | 0.27 | 1.47 (0.83 - 2.57) | 0.18 |
| PMI (cm2/m2) | ||||
| High | 1 (reference) | 1 (reference) | ||
| Low | 1.44 (0.94 - 2.19) | 0.09 | 1.32 (0.84 - 2.07) | 0.23 |
| IMAC | ||||
| Low | 1 (reference) | 1 (reference) | ||
| High | 0.97 (0.51 - 1.84) | 0.93 | 0.87 (0.45 - 1.69) | 0.68 |
| VSR | ||||
| Low | 1 (reference) | 1 (reference) | ||
| High | 1.08 (0.73 - 1.59) | 0.71 | 0.96 (0.63 - 1.47) | 0.86 |
| Author (year) | Patients | Sarcopenia definitions | Survival comparison; sarcopenia vs. non-sarcopenia | Multivariate analyses |
|---|---|---|---|---|
| BSC: best supportive care; chemo: chemotherapy; CI: confidence interval; CRT: chemo-radiotherapy; CS: cachexia score; ED: extensive disease; FI: fat index; HR: hazard ratio; LD: limited disease; MI: muscle index; NLR: neutrophil-to-lymphocyte ratio; OS: overall survival; PFS: progression-free survival; PMI: psoas muscle index; SCLC: small-cell lung cancer; SMI: skeletal muscle index; CT: computed tomography. | ||||
| Kim et al (2015) [7] | 149 SCLC; male (85.2%), ED (67.8%), chemo alone (48.3%), CRT (29.5%), BSC alone (20.8%) | L3MI, sarcopenia (79.2%) | OS, 8.6 vs. 16.8 months, P = 0.031 | Non-sarcopenia vs. sarcopenia; OS, HR 1.68, 95% CI 1.04 - 2.72, P = 0.034 |
| Go et al (2016) [8] | 117 male SCLC; ED (54.7%), CRT (45.3%) | SMI of pectoralis muscles, sarcopenia (24.8%) | PFS, 6.0 vs. 7.5 months, P = 0.009; OS, 10.5 vs. 13.5 months, P = 0.052 | Sarcopenia with low NLR + non-sarcopenia vs. sarcopenic with high NLR; PFS, HR 3.805, 95% CI 1.774 - 8.158, P = 0.001; OS, HR 2.230, 95% CI 1.048 - 4.743, P = 0.037 |
| Kim et al (2017) [9] | 127 male SCLC; ED (69.3%), chemo alone (48.0%), CRT (29.1%), BSC alone (21.3%) | CS defined by L3MI and L3FI; CS0 (13.4%), CS1 (74.8%), CS2 (11.8%) | OS, 5.0 (CS2) vs. 8.9 (CS1) vs. 18.3 months (CS0), P = 0.007 | CS0 vs. CS1, OS, HR 1.99, 95% CI 1.05 - 3.78, P = 0.036; CS0 vs. CS2, OS, HR 2.59, 95% CI 1.14 - 5.89, P = 0.023 |
| Ours (2020) | 128 ED-SCLC; male (78.9%), chemo alone (100%) | PMI; low PMI (72.7%) | PFS, 4.5 vs. 5.2 months, P = 0.17; OS, 8.8 vs. 11.4 months, P = 0.17 | High PMI vs. low PMI; PFS, HR 1.44, 95% CI 0.94 - 2.19, P = 0.09; OS, HR 1.32, 95% CI 0.84 - 2.07, P = 0.23 |
| Author (year) | Patients | BMI | Survival comparison | Univariate analyses | Multivariate analyses |
|---|---|---|---|---|---|
| BSC: best supportive care; CBDCA: carboplatin; Chemo: chemotherapy; CI: confidence interval; CRT: chemo-radiotherapy; ED: extensive disease; LD: limited disease; HR: hazard ratio; NA: not accessed; OS: overall survival; PFS: progression-free survival; SCLC: small-cell lung cancer; VP-16: etoposide; BMI: body mass index. | |||||
| Georgiadis et al (1995) [29] | 262 SCLC; male (63%), ED (44%), chemo alone (61%), CRT (39%) | Obese (27.1%), men ≥ 27.8, women ≥ 27.3; severely obese (10.7%), men ≥ 31.1, women ≥ 32.3 | Not described in details, but insignificant | NA | NA |
| Kim et al (2015) [7] | 149 SCLC; male (85.2%), ED (67.8%), chemo alone (48.3%), CRT (29.5%), BSC alone (20.8%) | ≥ 23 vs. < 23 (59.1%) | NA | OS; HR 1.19 (95% CI 0.83 - 1.72), P = 0.340 | NA |
| Go et al (2016) [8] | 117 male SCLC; ED (54.7%), CRT (45.3%) | ≥ 18.5 vs. < 18.5 (10.3%) | NA | PFS, HR 1.749 (95% CI 0.930 - 3.291), P = 0.083; OS, HR 1.077 (95% CI 0.554 - 2.096), P = 0.827 | PFS, 1.001 (0.500 - 2.006), P = 0.998; OS, not assessed |
| Kim et al (2017) [9] | 127 male SCLC; ED (69.3%), chemo alone (48.0%), CRT (29.1%), BSC alone (21.3%) | ≥ 18.5 vs. < 18.5 (15.0%) | NA | OS, HR 2.32 (95% CI 1.38 - 3.89), P < 0.001 | NA |
| Abdel-Rahman (2018) [28] | 455 ED-SCLC in a phase III trial; male (72.5%), CBDCA + VP-16 (100%) | < 25 (48.1%) vs. ≥ 25 | NA | PFS, HR 0.891 (95% CI 0.644 - 1.234), P = 0.487; OS, HR 0.856 (95% CI 0.678 - 1.082), P = 0.194 | PFS, OS; NA |
| Shen et al (2019) [30] | 178 SCLC; male (79.78%), ED (71.91%), VP-16 containing chemo alone | 18.5 - 24 (56.74%) vs. < 18.5 (6.74%) vs. ≥ 24 | P = 0.4107 | PFS, 18.5 - 24 vs. < 18.5, P = 0.851; 18.5 - 24 vs. ≥ 24, P = 0.212 | NA |
| Shepshelovich et al (2019) [31] | 2,787 SCLC from 16 studies; male (56%), ED (59%), | < 18.5 vs. normal | OS (ED), P < 0.001; OS (LD), P = 0.002 | HR 1.16 (95% CI 0.89 - 1.51), P = 0.28 | HR 1.20 (95% CI 0.92 - 1.6), P = 0.18 |
| 25 - 30 vs. normal | HR 0.97 (95% CI 0.87 - 1.07), P = 0.51 | HR 0.93 (95% CI 0.84 - 1.0), P = 0.20 | |||
| > 30 vs. normal | HR 1.05 (95% CI 0.94 - 1.19), P = 0.39 | HR 1.07 (95% CI 0.95 - 1.2), P = 0.24 | |||
| Ours (2020) | 128 ED-SCLC; male (78.9%), chemo alone (100%) | ≥ 18.5 vs. < 18.5 (12.5%) | PFS, P = 0.39; OS, P = 0.07 | NA | PFS, 1.36 (0.79 - 2.34), P = 0.27; OS, 1.47 (0.83 - 2.57), P = 0.18 |