Figures

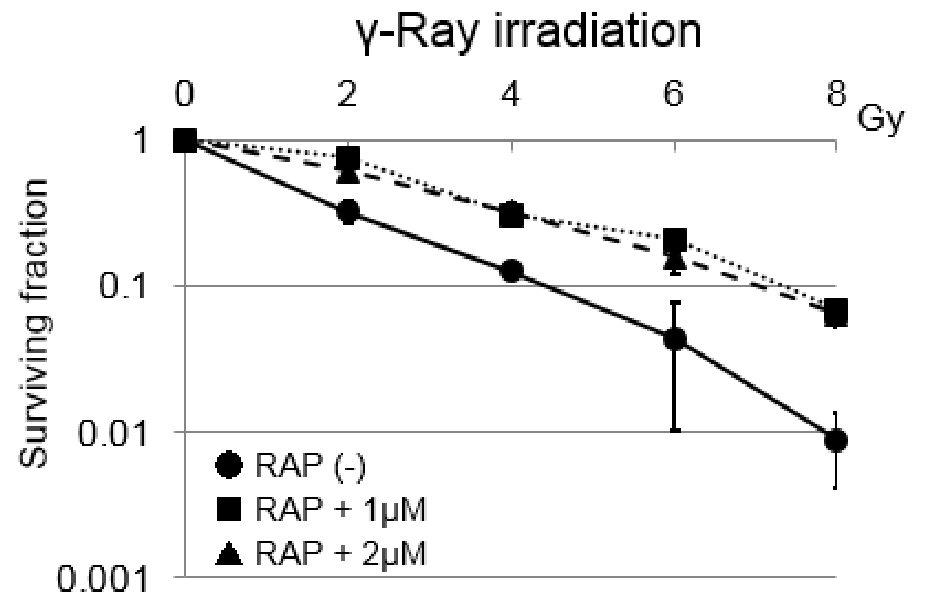
Figure 1. Cell survival curves of SAS tumor cells under γ-ray irradiation combined with or without rapamycin. Error bars indicate standard deviations (SDs) calculated from three independent experiments. Both 1 and 2 µM rapamycin induced significant radio-resistance to γ-rays in SAS cells. The differences between control and RAP (1 µM) were significant (P < 0.05). The same tendency was observed with control and RAP (1 µM). RAP: rapamycin.

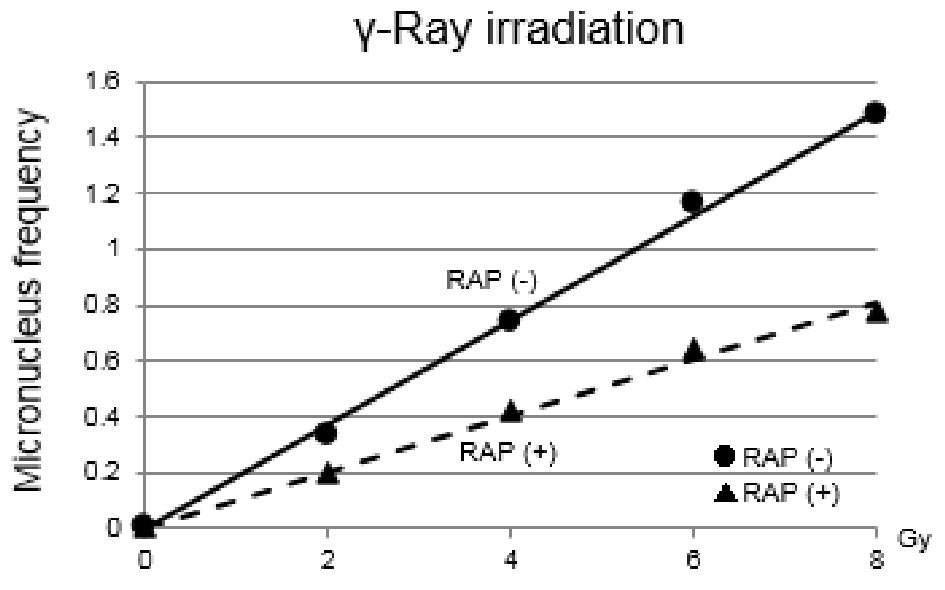
Figure 2. Dose-response curves of micronucleus frequencies under γ-ray irradiation are shown. Clear difference in micronucleus frequency under γ-ray irradiation was detected between with and without rapamycin. With rapamycin, micronucleus frequency was reduced through combining with rapamycin treatment. The differences between the two values were significant (P < 0.05). RAP: rapamycin.

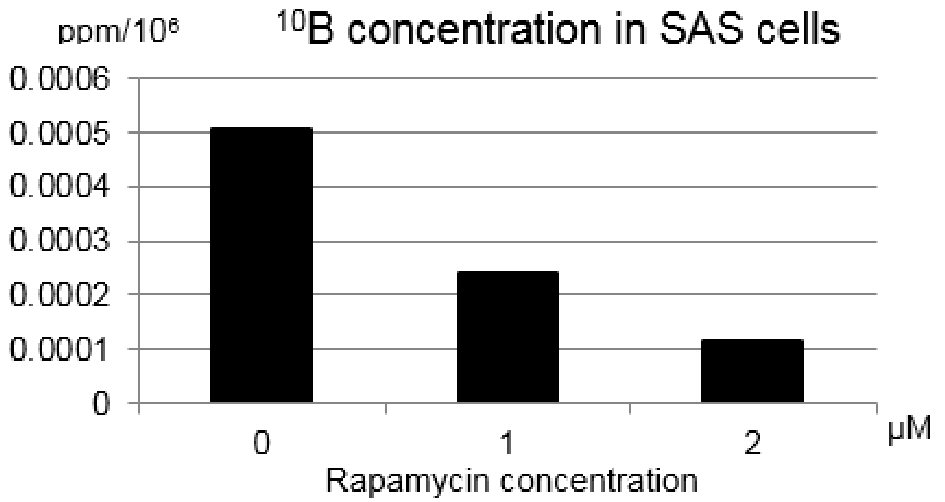
Figure 3. Changes in the 10B concentrations of single cell suspensions at the density of 200,000 SAS cells per 1.0 mL of 10B free cell culture medium after treatment with rapamycin (1 µM or 2 µM) for 24 h. The concentration of 10B from boronophenylalanine-10B into SAS cells was reduced through combining with rapamycin.

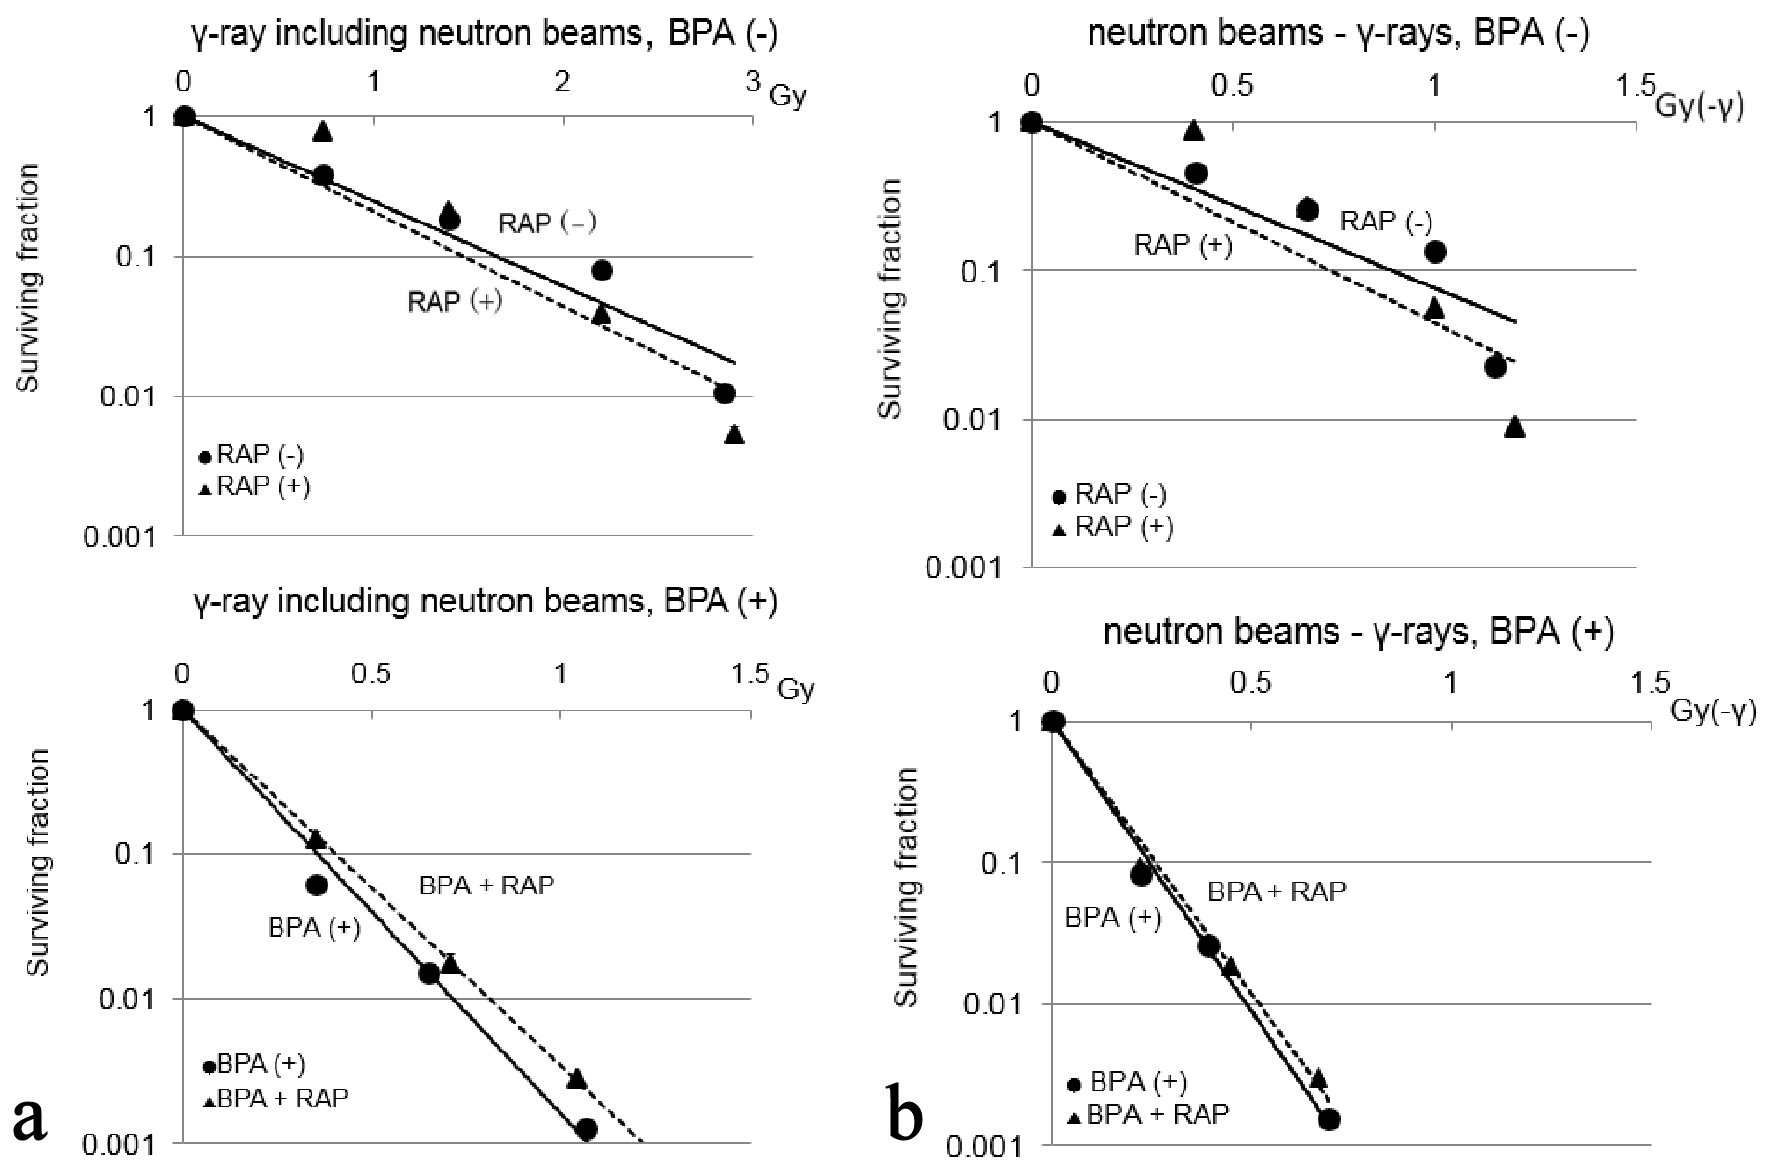
Figure 4. Cell survival curves for neutron beams without and with BPA are shown in (a) and (b), respectively. Error bars indicate standard deviations (SDs) calculated from three independent experiments. The quantification of cell survival following reactor neutron beam irradiation was normalized with the cell survival for γ-ray irradiation alone by dividing the data for neutron beams by the data for γ-ray irradiation alone in order to obtain the data on cell survival for irradiation with “neutron beams-γ-rays” (b). Under irradiation with γ-ray including neutron beams without BPA, the cell survival did not show significant difference between with and without rapamycin. With BPA, significantly higher survival fraction was observed with rapamycin treatment compared to untreated control (P < 0.05). However, under “neutron beams-γ-rays”, with or without BPA, no clear differences in cell survival were detected between treatments with and without rapamycin. BPA: boronophenylalanine-10B; RAP: rapamycin.

Figure 5. Dose-response curves of after irradiation with γ-ray including neutron beams without and with BPA are shown in (a) and (b), respectively. Clear difference in micronucleus frequency under neutron beam irradiation without BPA was not detected between with and without rapamycin. With BPA, micronucleus frequency was reduced through combining with rapamycin treatment (P < 0.05). This suggested that the delivery of 10B from BPA into cultured SAS cells was reduced through the treatment with rapamycin. BPA: boronophenylalanine-10B; RAP: rapamycin.
Tables
Table 1. Dose-Modifying Factorsa for SAS Cells Combined With Rapamycin Compared Without Rapamycin Under the Irradiation With γ-Rays Only or γ-Ray Including Neutron Beams
| γ-rays | Neutron irradiation |
|---|
| Without BPA | With BPA |
|---|
| aThe ratio of irradiation dose necessary to obtain each endpoint with rapamycin to without rapamycin under the irradiation with γ-rays only or γ-ray including neutron beams. BPA: boronophenylalanine-10B. |
| Surviving fraction = 0.3 | 2.0 | 0.9 | 1.2 |
| Surviving fraction = 0.03 | - | 0.9 | 1.2 |
| Micronucleus frequency = 0.6 | 1.8 | 1.2 | 1.4 |
Table 2. Relative Biological Effectivenessa Under the Irradiation With “Neutron Beams-γ-Rays” Compared With γ-Rays Only at the Surviving Fraction of 0.3
| Without BPA | With BPA |
|---|
| aThe ratio of irradiation dose necessary to obtain each endpoint with γ-rays to irradiation dose with γ-ray excluding neutron beams. BPA: boronophenylalanine-10B. |
| Surviving fraction = 0.3 | | |
| Incubation with rapamycin | 5.5 | 15.3 |
| Incubation without rapamycin | 4.6 | 16.5 |


