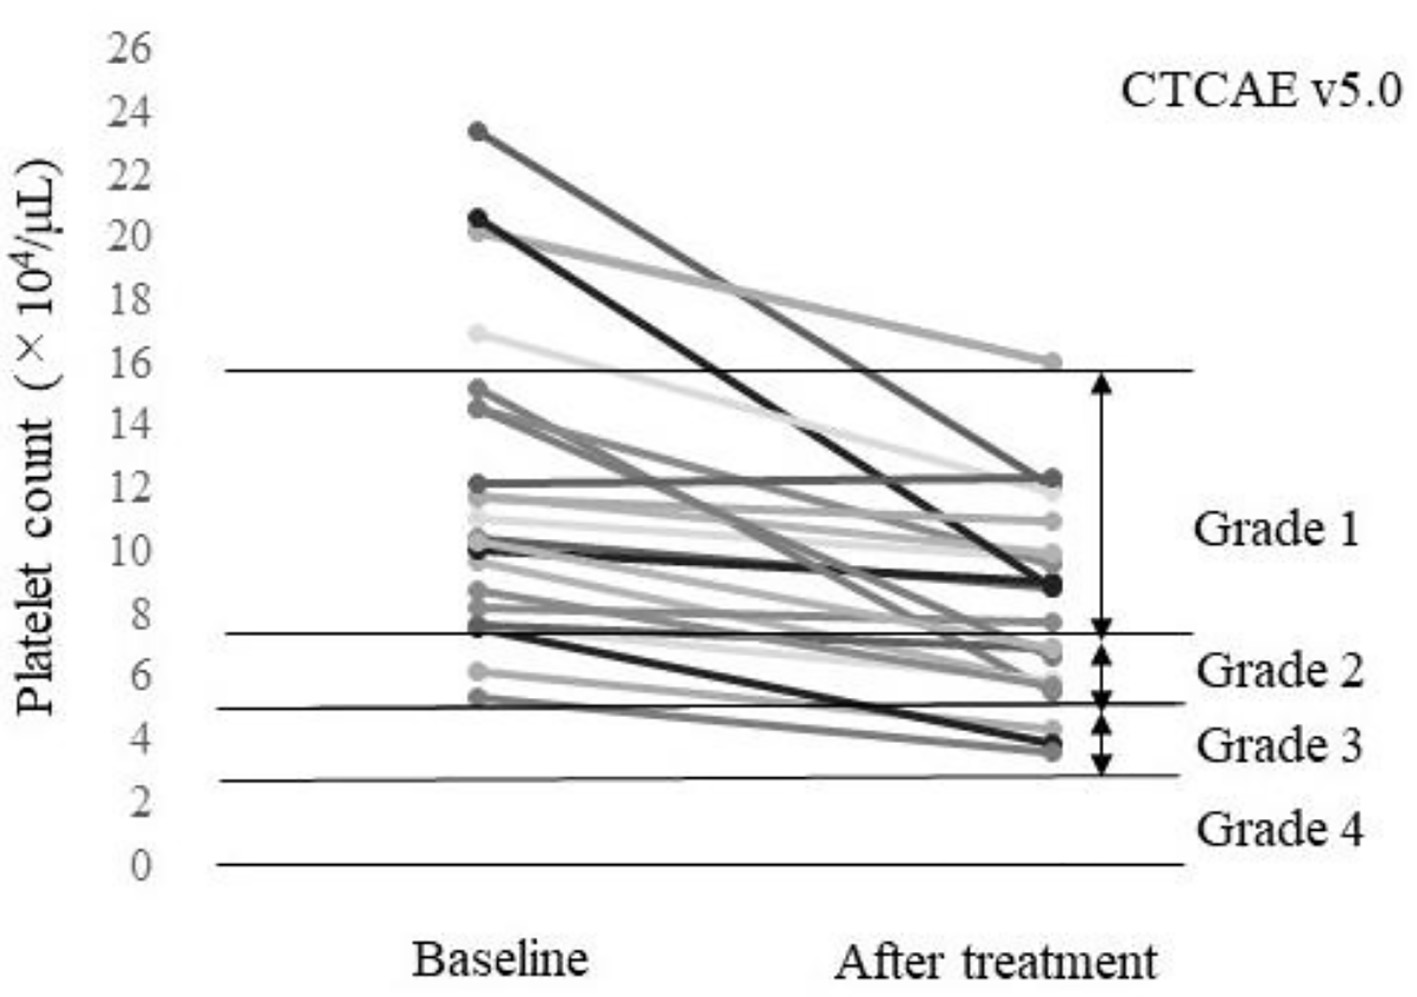
Figure 1. Platelet count of each patient at baseline and after treatment (n = 23). A total of 52.2% (12/23) of the patients had a worsened platelet count grade according to the Common Terminology Criteria for AEs v5.0 (CTCAE v5.0).
| World Journal of Oncology, ISSN 1920-4531 print, 1920-454X online, Open Access |
| Article copyright, the authors; Journal compilation copyright, World J Oncol and Elmer Press Inc |
| Journal website https://www.wjon.org |
Original Article
Volume 000, Number 000, October 2021, pages 000-000
Maximum Plasma Concentration of Lenvatinib Is Useful for Predicting Thrombocytopenia in Patients Treated for Hepatocellular Carcinoma
Figures
Tables
| Characteristic | Number or median (range) |
|---|---|
| ALBI: albumin-bilirubin; BCLC: Barcelona Clinic Liver Cancer. | |
| Age (years) | 77 (56 - 93) |
| Sex (male/female) | 19/4 |
| Body weight (< 60 kg/≥ 60 kg) | 11/12 |
| Total bilirubin (mg/dL) | 0.96 (0.4 - 1.9) |
| Albumin (g/dL) | 3.5 (2.6 - 4.3) |
| White blood cell count (/µL) | 5,070 (2,630 - 8,070) |
| Platelet count (104/µL) | 11.1 (5.4 - 23.4) |
| Prothrombin time (%) | 86.5 (51.5 - 14.8) |
| ALBI score | -2.13 (-3.03 to -1.35) |
| Child-Pugh class (A/B/C) | 15/8/0 |
| BCLC stage (B/C) | 11/12 |
| Starting dose of lenvatinib (4 mg/8 mg/12 mg) | 10/8/5 |
| Adverse event | n (%) |
|---|---|
| Platelet count decrease | 12 (52.2%) |
| Hypertension | 11 (47.8%) |
| Anorexia | 11 (47.8%) |
| Malaise | 9 (39.1%) |
| Diarrhea | 8 (34.8%) |
| Hypothyroidism | 6 (26.1%) |
| White blood cell count decrease | 5 (21.7%) |
| Palmar-plantar erythrodysesthesia syndrome | 3 (13.0%) |
| Hoarseness | 3 (13.0%) |
| Encephalopathy | 2 (8.7%) |
| Hemobilia | 1 (4.3%) |
| Colitis | 1 (4.3%) |
| Creatine increase | 1 (4.3%) |
| β | SE | Standardized β | t | P-value | |
|---|---|---|---|---|---|
| R = 0.88, P = 0.027. SE: standard error; Cmax: maximum plasma concentration. | |||||
| Constant | -80.769 | 33.788 | -2.390 | 0.027 | |
| Starting dose (mg) | 10.177 | 1.400 | 0.797 | 7.271 | < 0.0001 |
| Albumin (g/dL) | 23.219 | 9.712 | 0.262 | 2.391 | 0.027 |