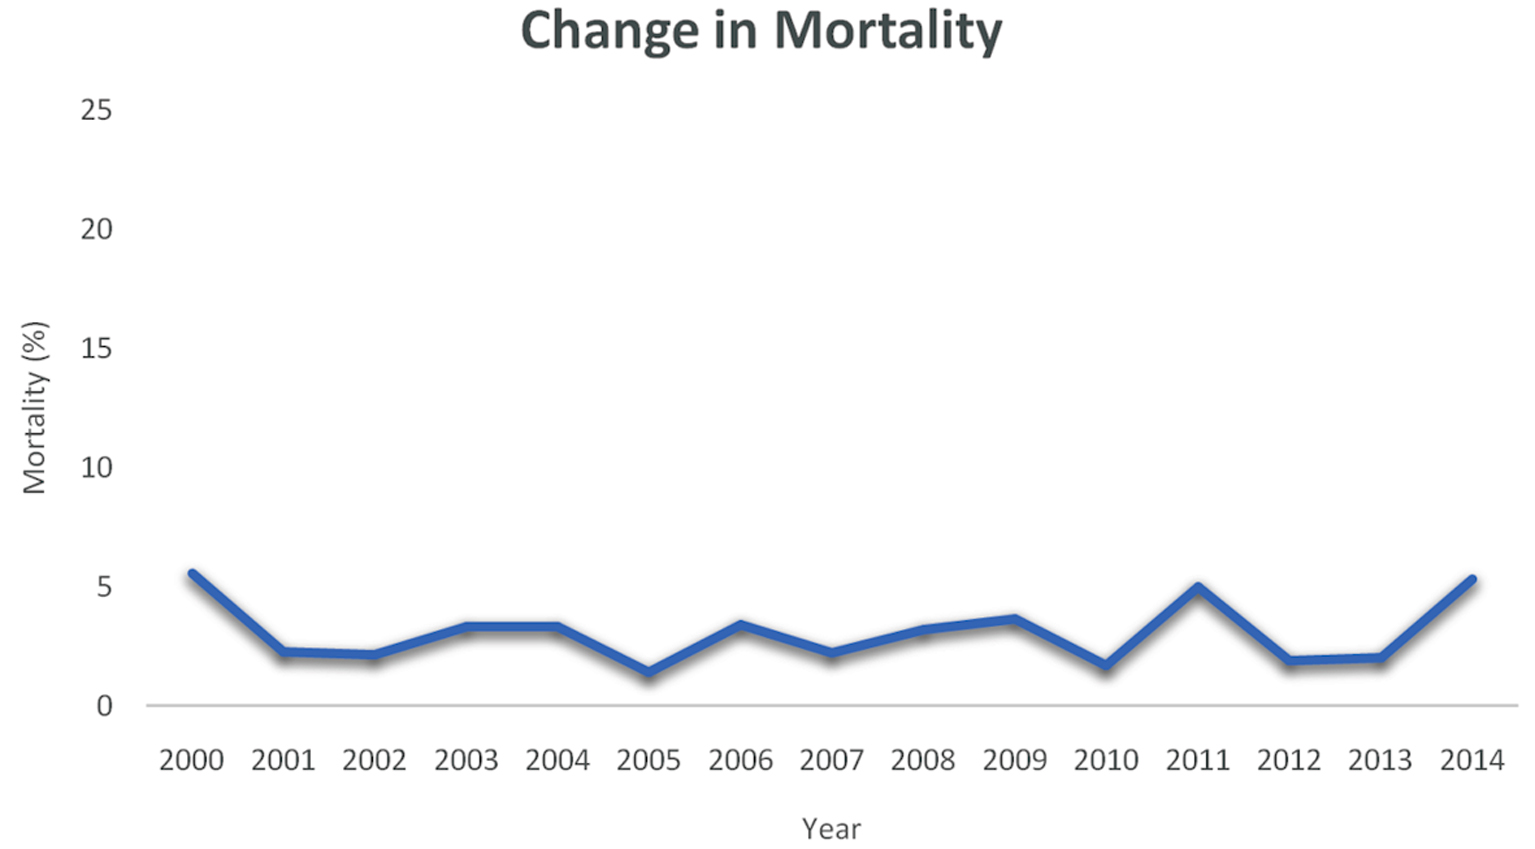
Figure 1. The change in mortality from the year 2000 to 2014 is shown. Mortality is expressed as a percentage of the total number of cases performed in the study period.
| World Journal of Oncology, ISSN 1920-4531 print, 1920-454X online, Open Access |
| Article copyright, the authors; Journal compilation copyright, World J Oncol and Elmer Press Inc |
| Journal website https://www.wjon.org |
Original Article
Volume 12, Number 6, December 2021, pages 225-231
Analysis of Demographics and Outcomes of Surgical Resection in the Central Nervous System of Patients With Metastatic Melanoma
Figure
Tables
| Characteristic | Patients, n (%) |
|---|---|
| SNFs/LTAC: skilled nursing facilities/long-term acute care; CCI: Charlson Comorbidity Index. | |
| Sex | |
| Male | 844 (69.4%) |
| Female | 372 (30.6%) |
| Age | |
| < 65 | 783 (64.4%) |
| > 65 | 433 (35.6%) |
| Race | |
| White | 965 (79.4%) |
| Nonwhite | 251 (20.6%) |
| Hospital bed size | |
| Small | 113 (9.3%) |
| Medium | 184 (15.1%) |
| Large | 912 (75.0%) |
| Unknown | 7 (0.6%) |
| Census division | |
| New England | 19 (1.6%) |
| Middle Atlantic | 37 (3.0%) |
| Northeast | 53 (4.4%) |
| Northwest | 23 (1.9%) |
| South Atlantic | 62 (5.1%) |
| Southeast | 21 (1.7%) |
| Southwest | 34 (2.8%) |
| Mountain | 21 (1.7%) |
| Pacific | 66 (5.4%) |
| Unknown | 880 (72.4%) |
| Location/teaching status | |
| Rural non-teaching | 22 (1.8%) |
| Urban | 231 (19.0%) |
| Teaching | 859 (70.6%) |
| Unknown | 104 (8.6%) |
| Region of hospital | |
| Northeast | 209 (17.2%) |
| Midwest | 225 (18.5%) |
| South | 466 (38.3%) |
| West | 316 (26.0%) |
| Primary expected payer | |
| Medicare | 421 (34.6%) |
| Medicaid | 115 (9.5%) |
| Private insurance | 596 (49.0%) |
| Self-pay | 45 (3.7%) |
| No charge | 2 (0.2%) |
| Other | 34 (2.8%) |
| Unknown | 3 (0.2%) |
| Discharge disposition | |
| Home | 724 (59.5%) |
| Home health | 172 (14.1%) |
| SNFs/LTAC | 278 (22.9%) |
| Others | 4 (0.3%) |
| Unknown | 38 (3.1%) |
| CCI | |
| 1 - 3 | 93 (7.6%) |
| 4 - 6 | 27 (2.2%) |
| > 6 | 1,096 (90.1%) |
| Year | |
| 2000 | 54 (4.4%) |
| 2001 | 44 (3.6%) |
| 2002 | 47 (3.9%) |
| 2003 | 60 (4.9%) |
| 2004 | 60 (4.9%) |
| 2005 | 72 (5.9%) |
| 2006 | 59 (4.9%) |
| 2007 | 91 (7.5%) |
| 2008 | 94 (7.7%) |
| 2009 | 82 (6.7%) |
| 2010 | 117 (9.6%) |
| 2011 | 100 (8.2%) |
| 2012 | 105 (8.6%) |
| 2013 | 99 (8.1%) |
| 2014 | 132 (10.9%) |
| Measure | Characteristic | Odds ratio | Standard error | z | P > |z| | 95% CI |
|---|---|---|---|---|---|---|
| Age, sex, and white are patient characteristics. Midwest, South, and West are hospital geographic locations. Cons was used to estimate baseline odds. P was considered significant if < 0.05. CCI: Charlson Comorbidity Index; CI: confidence interval. | ||||||
| Mortality | Age > 65 | 1.12 | 0.39 | 0.33 | 0.74 | 0.57 - 2.20 |
| Sex | 0.71 | 0.28 | -0.87 | 0.39 | 0.33 - 1.54 | |
| White | 1.03 | 0.45 | 0.06 | 0.95 | 0.43 - 2.44 | |
| Midwest | 0.60 | 0.34 | -0.91 | 0.37 | 0.20 - 1.80 | |
| South | 0.48 | 0.23 | -1.55 | 0.12 | 0.19 - 1.21 | |
| West | 0.93 | 0.42 | -0.16 | 0.87 | 0.39 - 2.24 | |
| CCI | 1.00 | 0.08 | 0.03 | 0.97 | 0.86 - 1.17 | |
| Cons | 0.05 | 0.04 | -3.52 | 0.00 | 0.01 - 0.26 | |
| Measure | Characteristic | Odds ratio | Standard error | z | P > |z| | 95% CI |
|---|---|---|---|---|---|---|
| Age, sex, and white are patient characteristics. Midwest, South, and West are hospital geographic locations. Cons was used to estimate baseline odds. P was considered significant if < 0.05. LOS: length of stay; CCI: Charlson Comorbidity Index; CI: confidence interval. | ||||||
| Ln(LOS) | Age > 65 | 0.12 | 0.05 | 2.39 | 0.02 | 0.02 - 0.21 |
| Sex | 0.03 | 0.05 | 0.60 | 0.55 | -0.07 - 0.13 | |
| White | -0.01 | 0.06 | -0.21 | 0.83 | -0.13 - 0.10 | |
| Midwest | -0.09 | 0.08 | -1.18 | 0.24 | -0.25 - 0.06 | |
| South | -0.21 | 0.07 | -3.08 | 0.00 | -0.34 - (-0.07) | |
| West | -0.23 | 0.07 | -3.27 | 0.00 | -0.37 - (-0.09) | |
| CCI | 0.07 | 0.01 | 6.44 | 0.00 | 0.05 - 0.09 | |
| Year | 0.00 | 0.01 | -0.56 | 0.58 | -0.01 - 0.01 | |
| Cons | 7.45 | 11.24 | 0.66 | 0.51 | -14.60 - 29.4 | |
| Measure | Characteristic | Odds ratio | Standard error | z | P > |z| | 95% CI |
|---|---|---|---|---|---|---|
| Age, sex, and white are patient characteristics. Midwest, South, and West are hospital geographic locations. Cons was used to estimate baseline odds. P was considered significant if < 0.05. SNFs: skilled nursing facilities; CCI: Charlson Comorbidity Index; CI: confidence interval. | ||||||
| SNFs | Age > 65 | 2.94 | 0.44 | 7.30 | 0.00 | 2.20 - 3.93 |
| Sex | 1.26 | 0.20 | 1.46 | 0.14 | 0.92 - 1.72 | |
| White | 0.87 | 0.16 | -0.74 | 0.46 | 0.61 - 1.25 | |
| Midwest | 1.39 | 0.33 | 1.42 | 0.16 | 0.88 - 2.20 | |
| South | 0.76 | 0.16 | -1.31 | 0.19 | 0.51 - 1.14 | |
| West | 0.63 | 0.14 | -2.01 | 0.05 | 0.40 - 0.99 | |
| CCI | 1.22 | 0.05 | 5.11 | 0.00 | 1.13 - 1.32 | |
| Year | 1.03 | 0.02 | 1.81 | 0.07 | 1.00 - 1.07 | |
| Cons | 0.00 | 0.00 | -1.90 | 0.06 | 0.00 - 10.21 | |