Figures
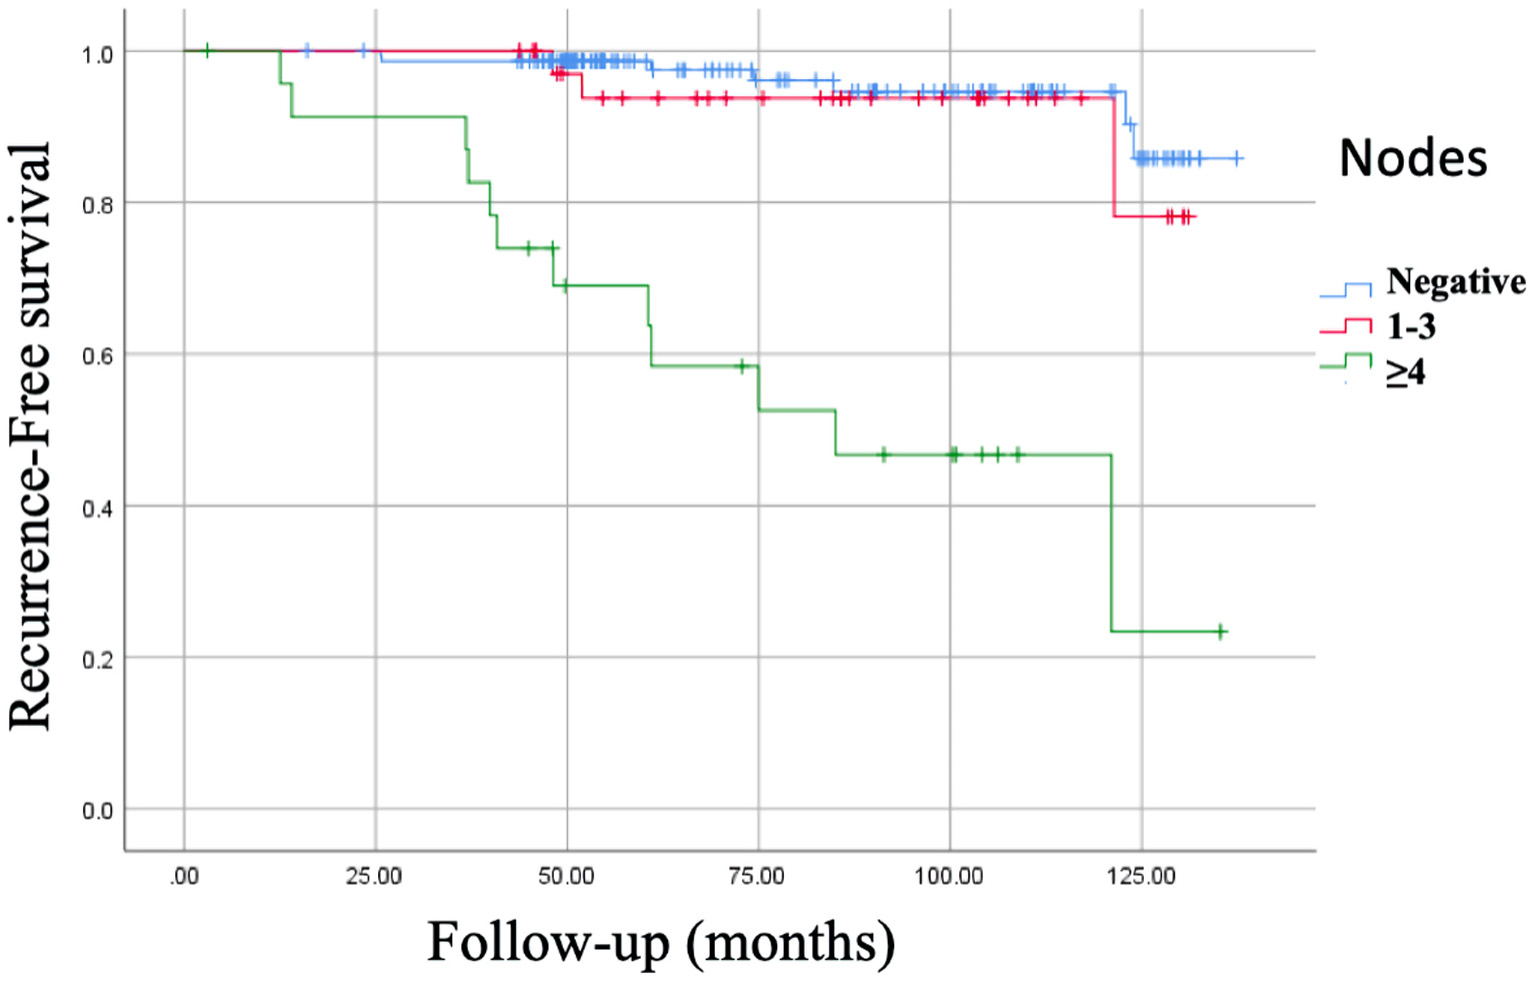
Figure 1. Kaplan-Meier curve of recurrence-free survival (RFS) of nodes. RFS of negative nodes: 95.2%, 132.06 ± 1.93 months (95% CI: 128.27 - 135.86 months). RFS of 1 - 3 positive nodes: 91.7%, 124.52 ± 3.67 months (95% CI: 117.31 - 131.73 months). RFS of ≥ 4 positive nodes: 50%, 85.89 ± 9.59 months (95% CI: 67.08 - 104.69 months), P = 0.0001. CI: confidence interval.
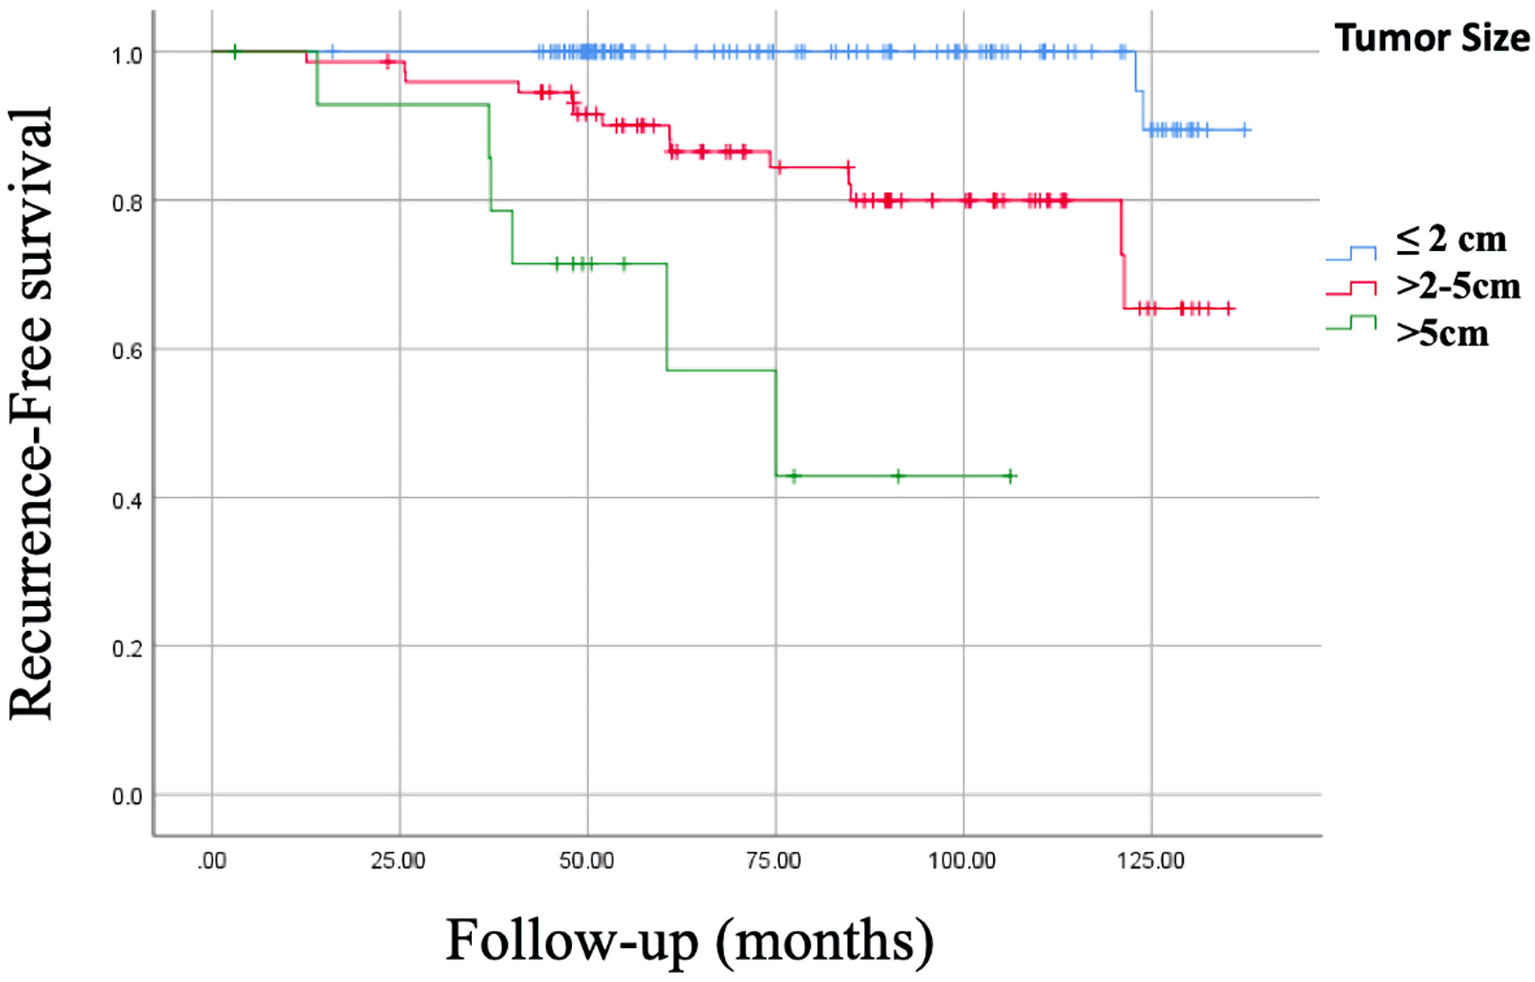
Figure 2. Kaplan-Meier curve of recurrence-free survival (RFS) of tumor size. RFS of tumor ≤ 2 cm: 98.3%, 135.89 ± 0.98 months (95% CI: 133.97 - 137.82 months). RFS of tumor > 2 - 5 cm: 81.1%, 117.28 ± 4.28 months (95% CI: 108.89 - 125.68 months). RFS of tumor > 5 cm: 60%, 74.01 ± 9.54 months (95% CI: 55.31 - 92.72 months), P = 0.0001. CI: confidence interval.
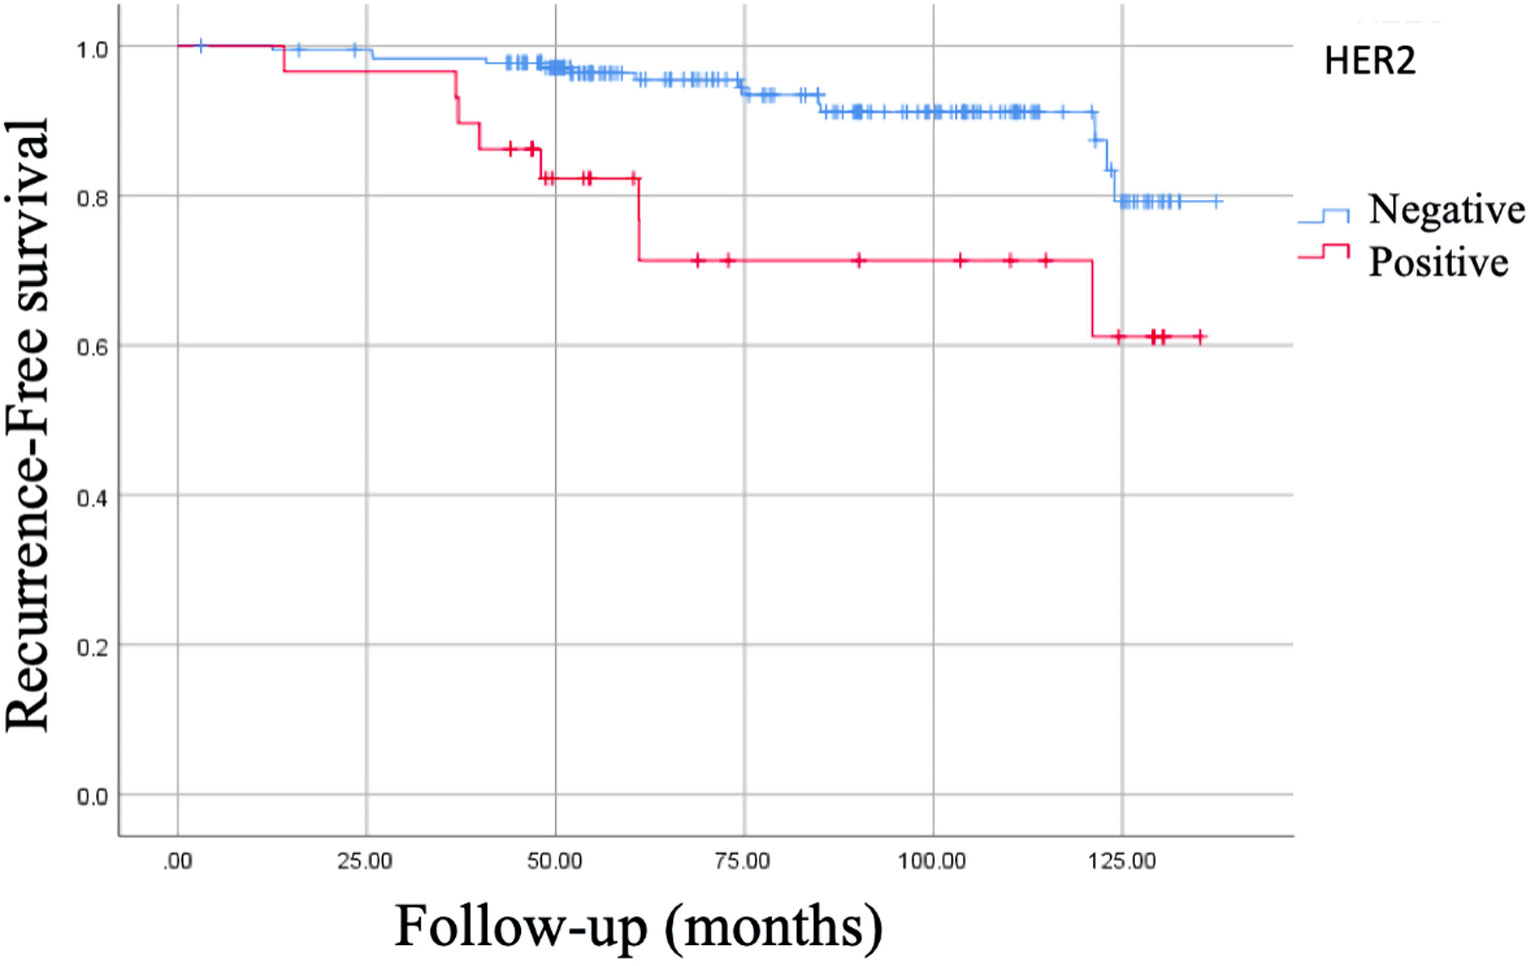
Figure 3. Kaplan-Meier curve of recurrence-free survival (RFS) of Her2. RFS of Her2 (-): 92.1%, 128.75 ± 2.16 months (95% CI: 124.50 - 132.99 months). RFS of Her2 (+): 72.4%, 108.01 ± 8.35 months (95% CI: 91.63 - 124.39 months), P = 0.0001. CI: confidence interval.
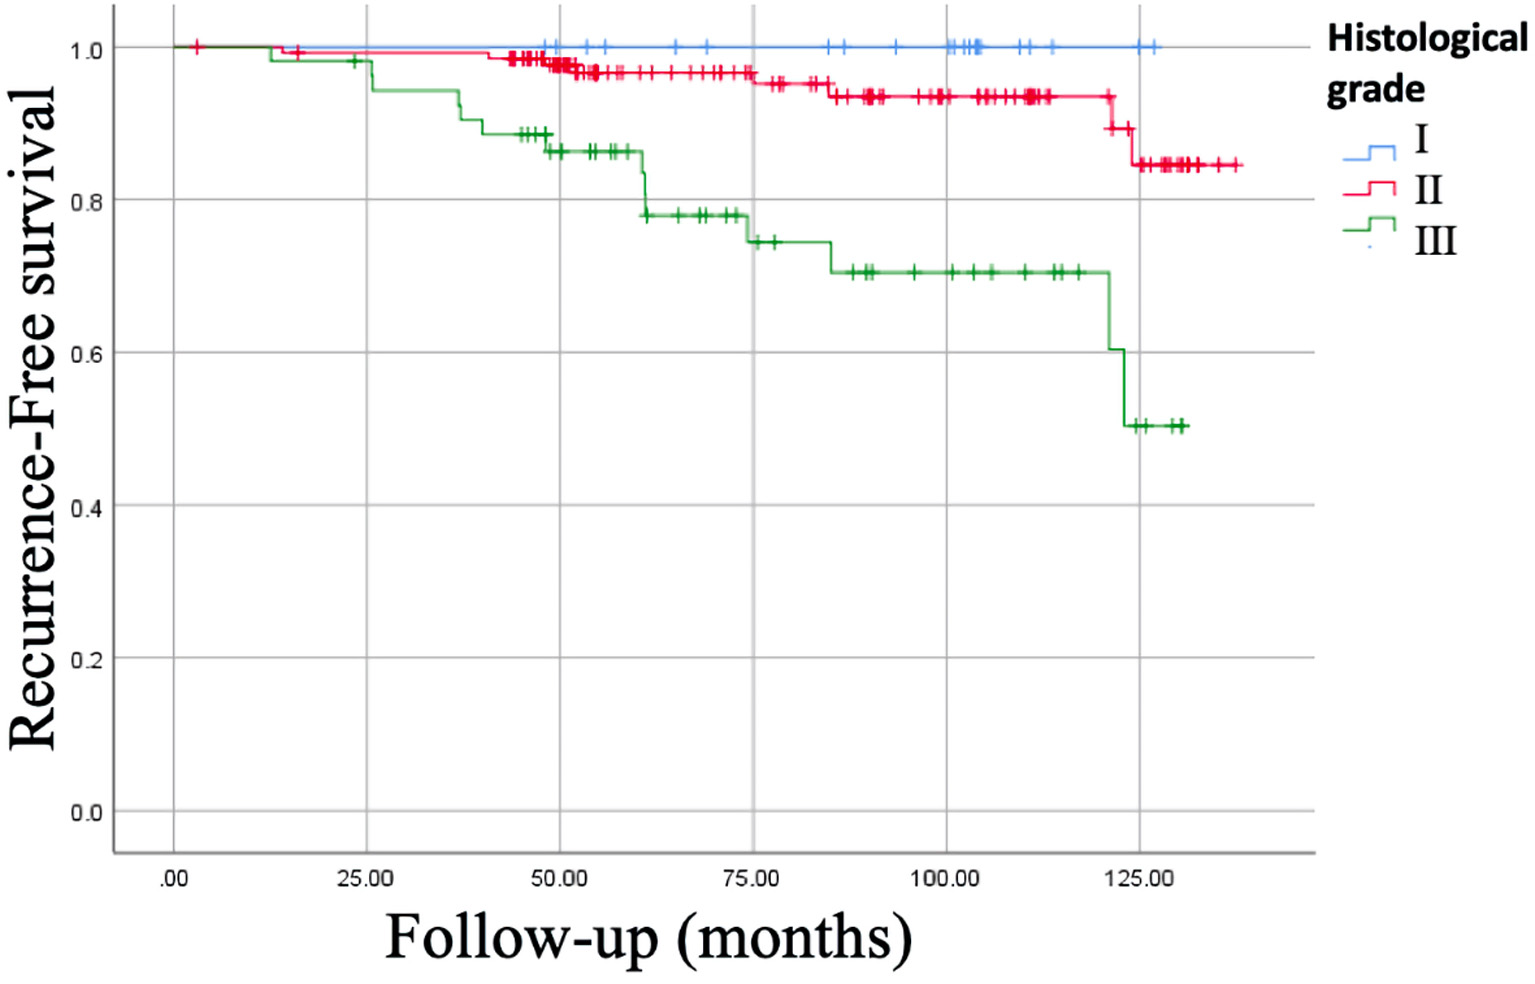
Figure 4. Kaplan-Meier curve of recurrence-free survival (RFS) of histological grade. RFS for well differentiated (histological grade I) was of 100% vs. 73.6% for the poorly differentiated (histological grade III), P = 0.0001.
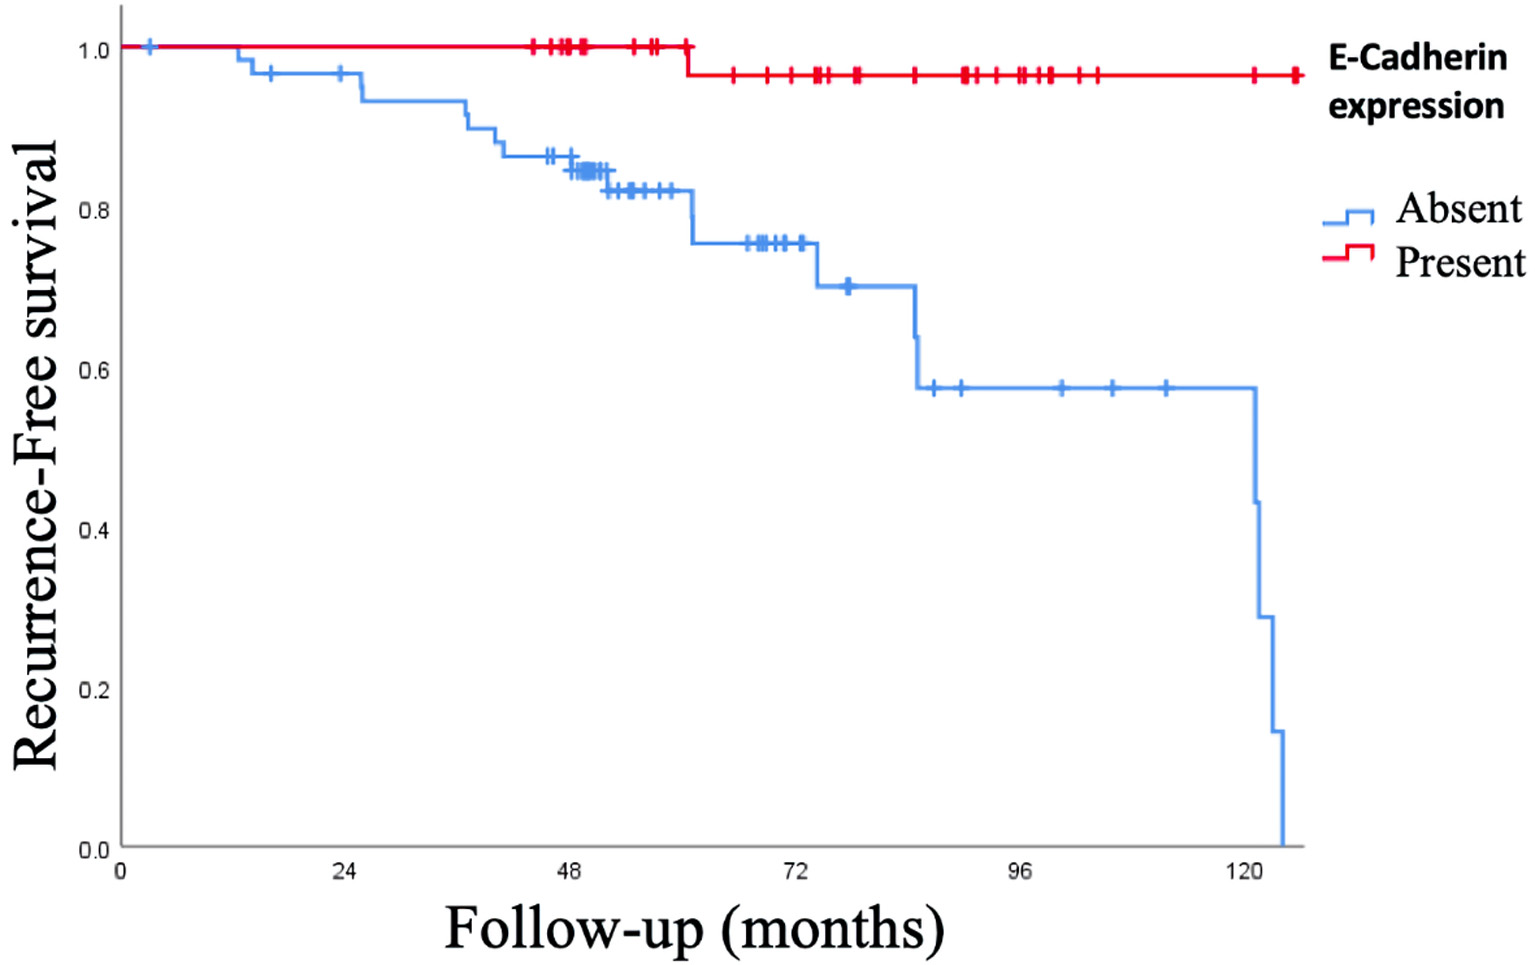
Figure 5. Kaplan-Meier curve of recurrence-free survival (RFS) of expression of epithelial-cadherin (E-cadherin). The positive expression of E-cadherin was associated with an increase in the RFS of 97.4%, with a mean of 128.6 ± 2.4 months (95% CI: 123.75 - 133.45 months) compared to the absence of expression E-cadherin: signal log ratio (SLR) 68.9%, a mean of 95 ± 6 months (95% CI: 83.28 - 106.88 months), P < 0.001. CI: confidence interval.
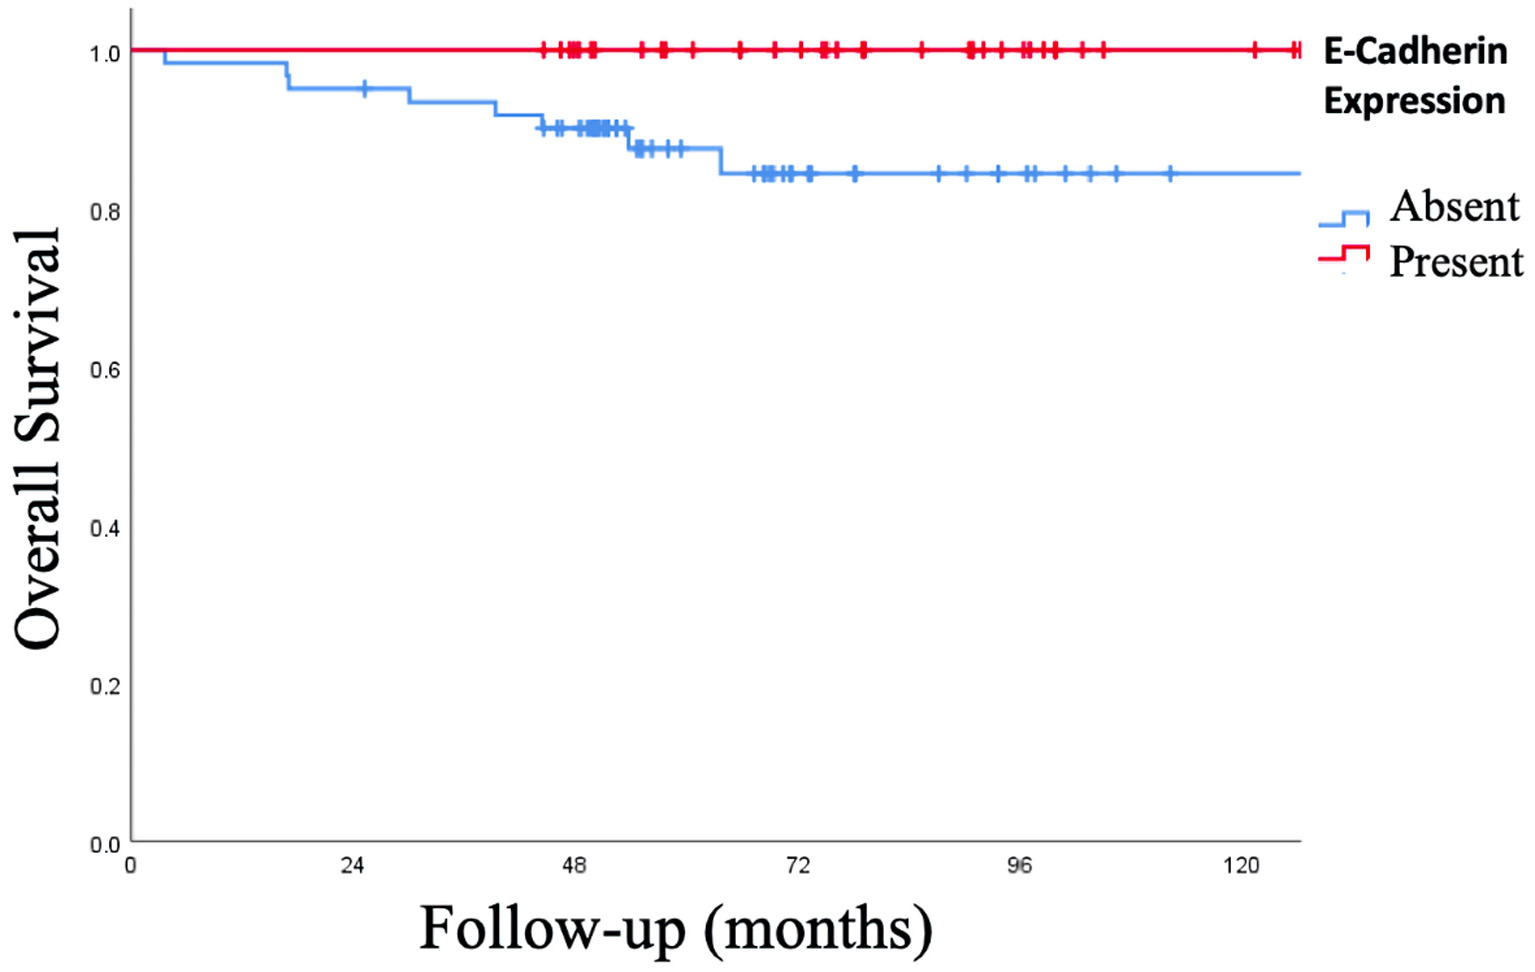
Figure 6. Kaplan-Meier curve of overall survival (OS) of expression of epithelial-cadherin (E-cadherin). The presence of E-cadherin expression increased the OS of 100% vs. 86.9% with the absence, P = 0.015.
Table
Table 1. General Characteristics
| Characteristic | N (%) |
|---|
| Age (years old) | |
| < 35 | 7 (3.4%) |
| 35 - 60 | 92 (44.4%) |
| > 60 | 108 (52.2%) |
| Menopausal condition | |
| Premenopausal | 56 (27.1%) |
| Postmenopausal | 151 (72.9%) |
| Smoke | |
| Negative | 151 (72.9%) |
| Positive | 56 (27.1%) |
| Expression of estrogen receptor (ER) | |
| Absent | 16 (7.7%) |
| Present | 191 (92.3%) |
| Expression of progestin receptor (PR) | |
| Absent | 29 (14%) |
| Present | 178 (86%) |
| Ki67 | |
| < 14% | 118 (57%) |
| ≥ 15% | 89 (43%) |
| Molecular subtype | |
| Luminal A | 109 (52.7%) |
| Luminal B | 87 (42%) |
| Her2 enriched | 1 (0.5%) |
| Triple negative | 10 (4.8%) |
| Malignancy grade-according to Scarff-Bloom-Richardson | |
| G1 | 22 (10.6%) |
| G2 | 132 (63.8%) |
| G3 | 53 (25.6%) |
| Presence of cancerous cells in blood and lymphatics vessels | |
| Yes | 49 (23.7%) |
| No | 158 (76.5%) |
| Presence of cancerous cells perineural | |
| Yes | 33 (15.9%) |
| No | 174 (84.1%) |
| Positive surgical margin | |
| Yes | 31 (15%) |
| No | 176 (85%) |
| Expression of E-cadherin | |
| Positive | 39 (18.8%) |
| Lack | 61 (29.5%) |
| Tumor size | |
| < 2 cm | 118 (57%) |
| 2 - 5 cm | 74 (35.7%) |
| > 5 cm | 15 (7.3%) |
| Nodes | |
| Negative | 147 (71%) |
| 1 - 3 | 36 (17.4%) |
| ≥ 4 | 24 (11.6%) |