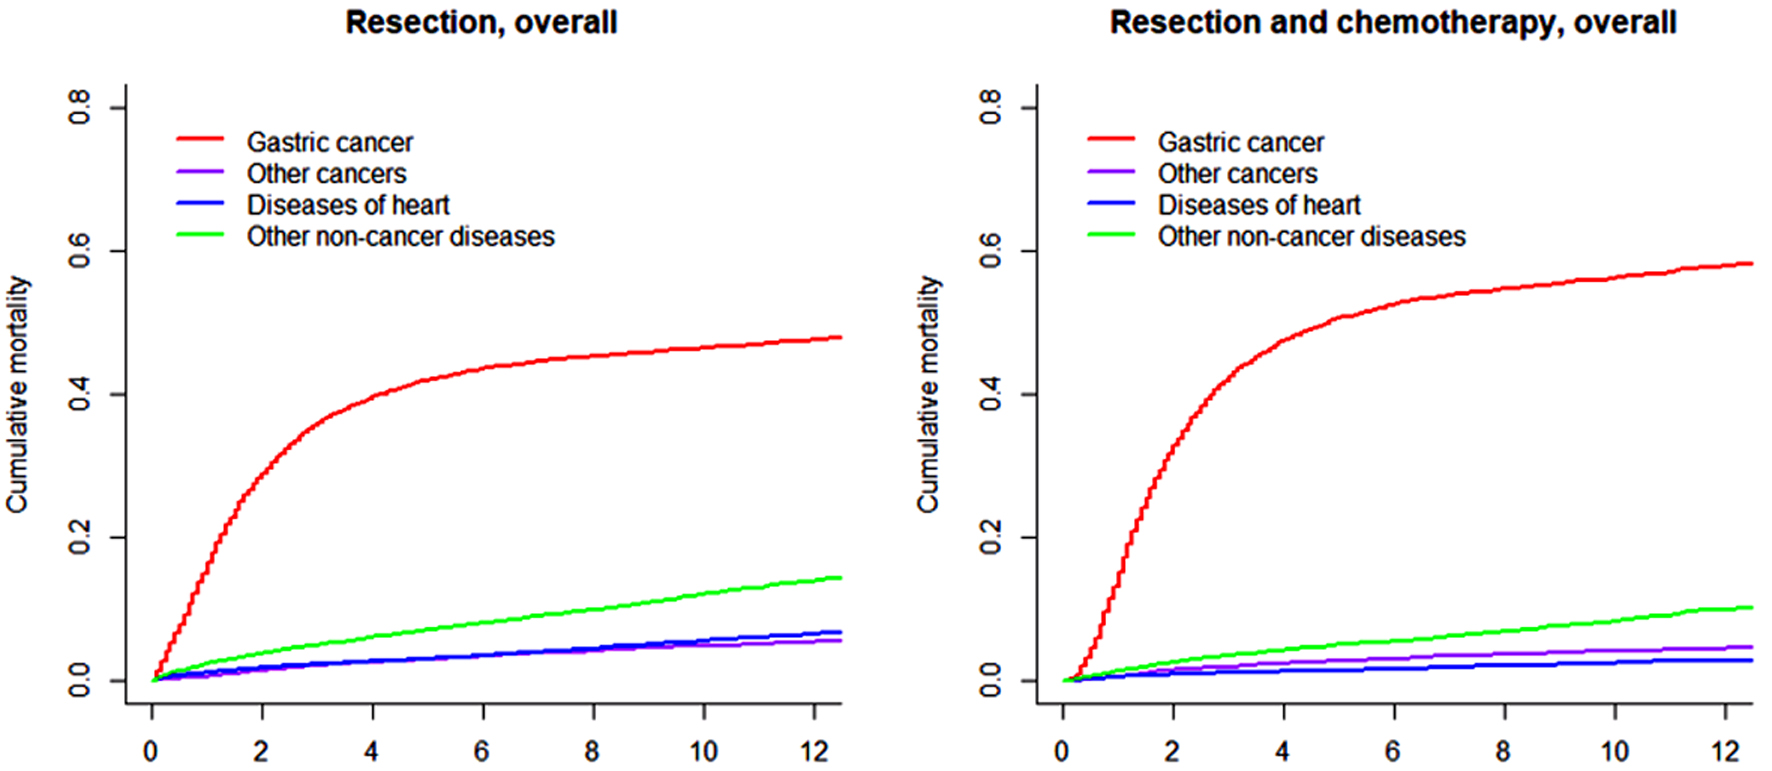
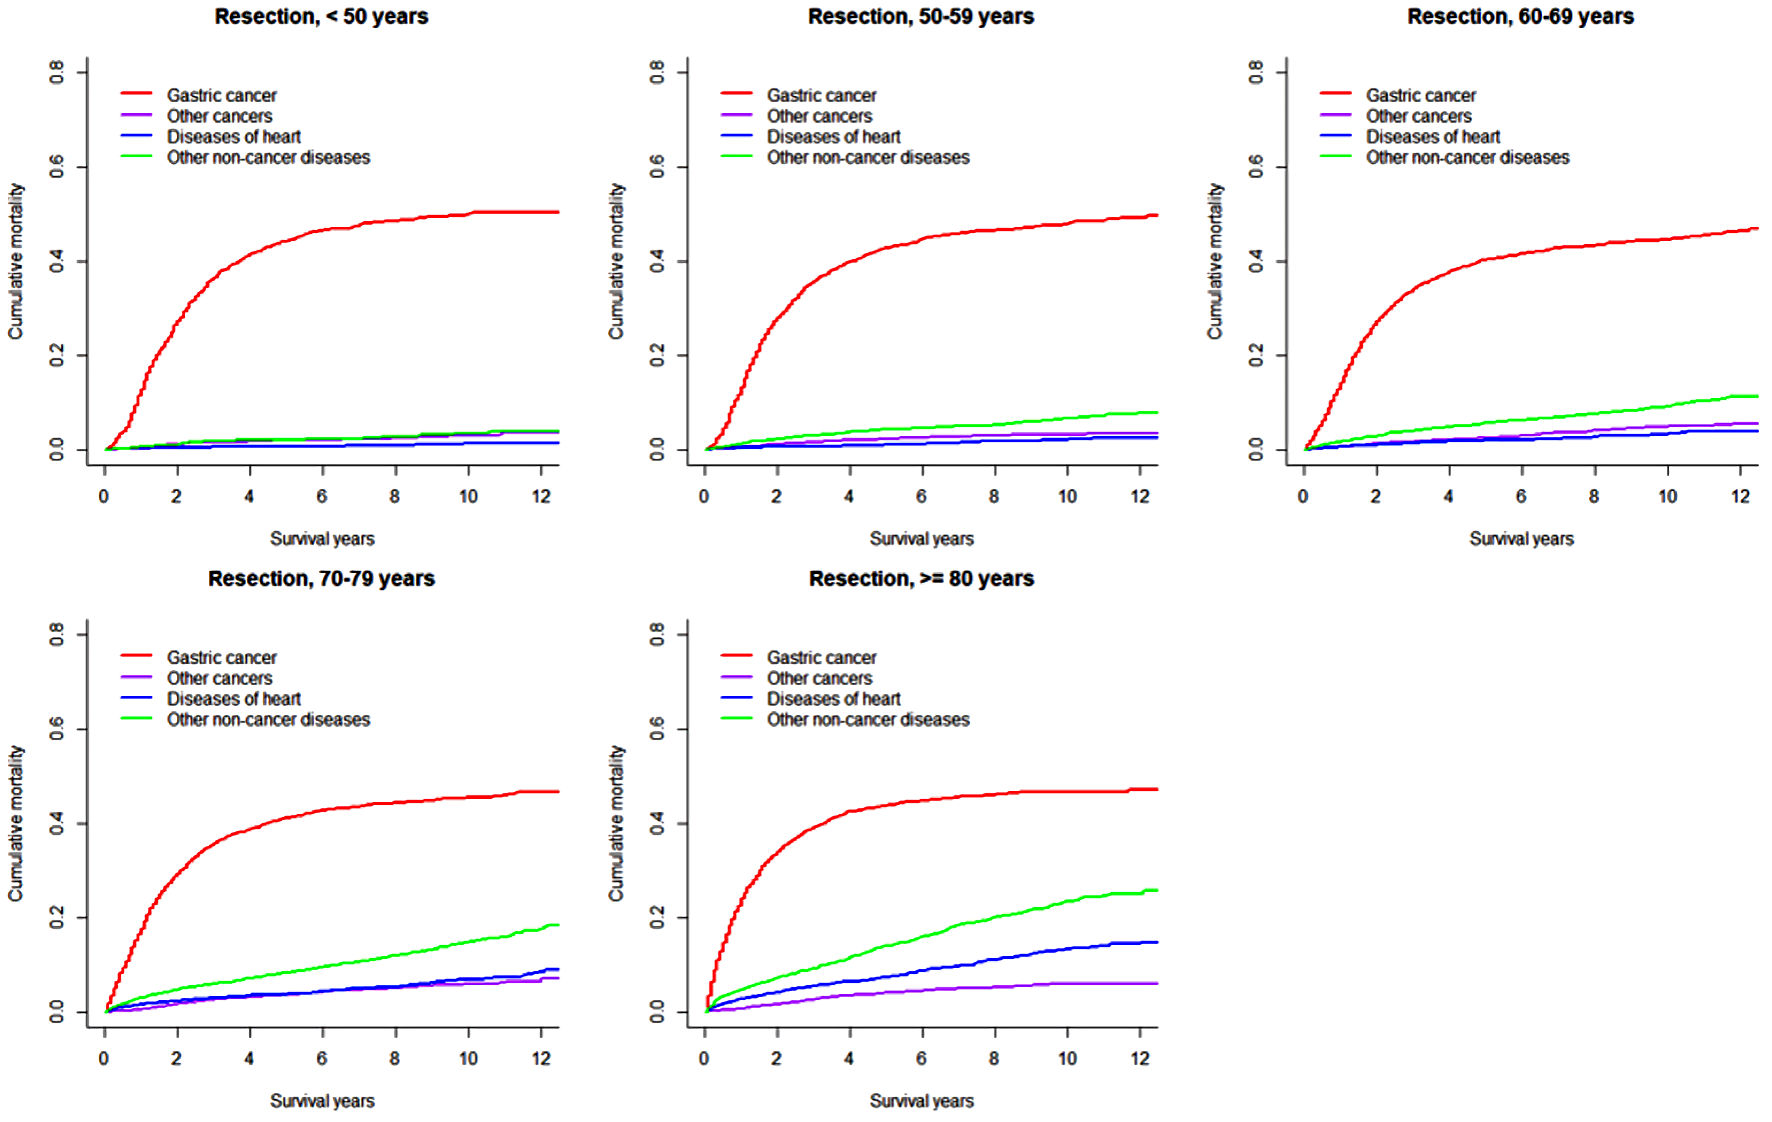
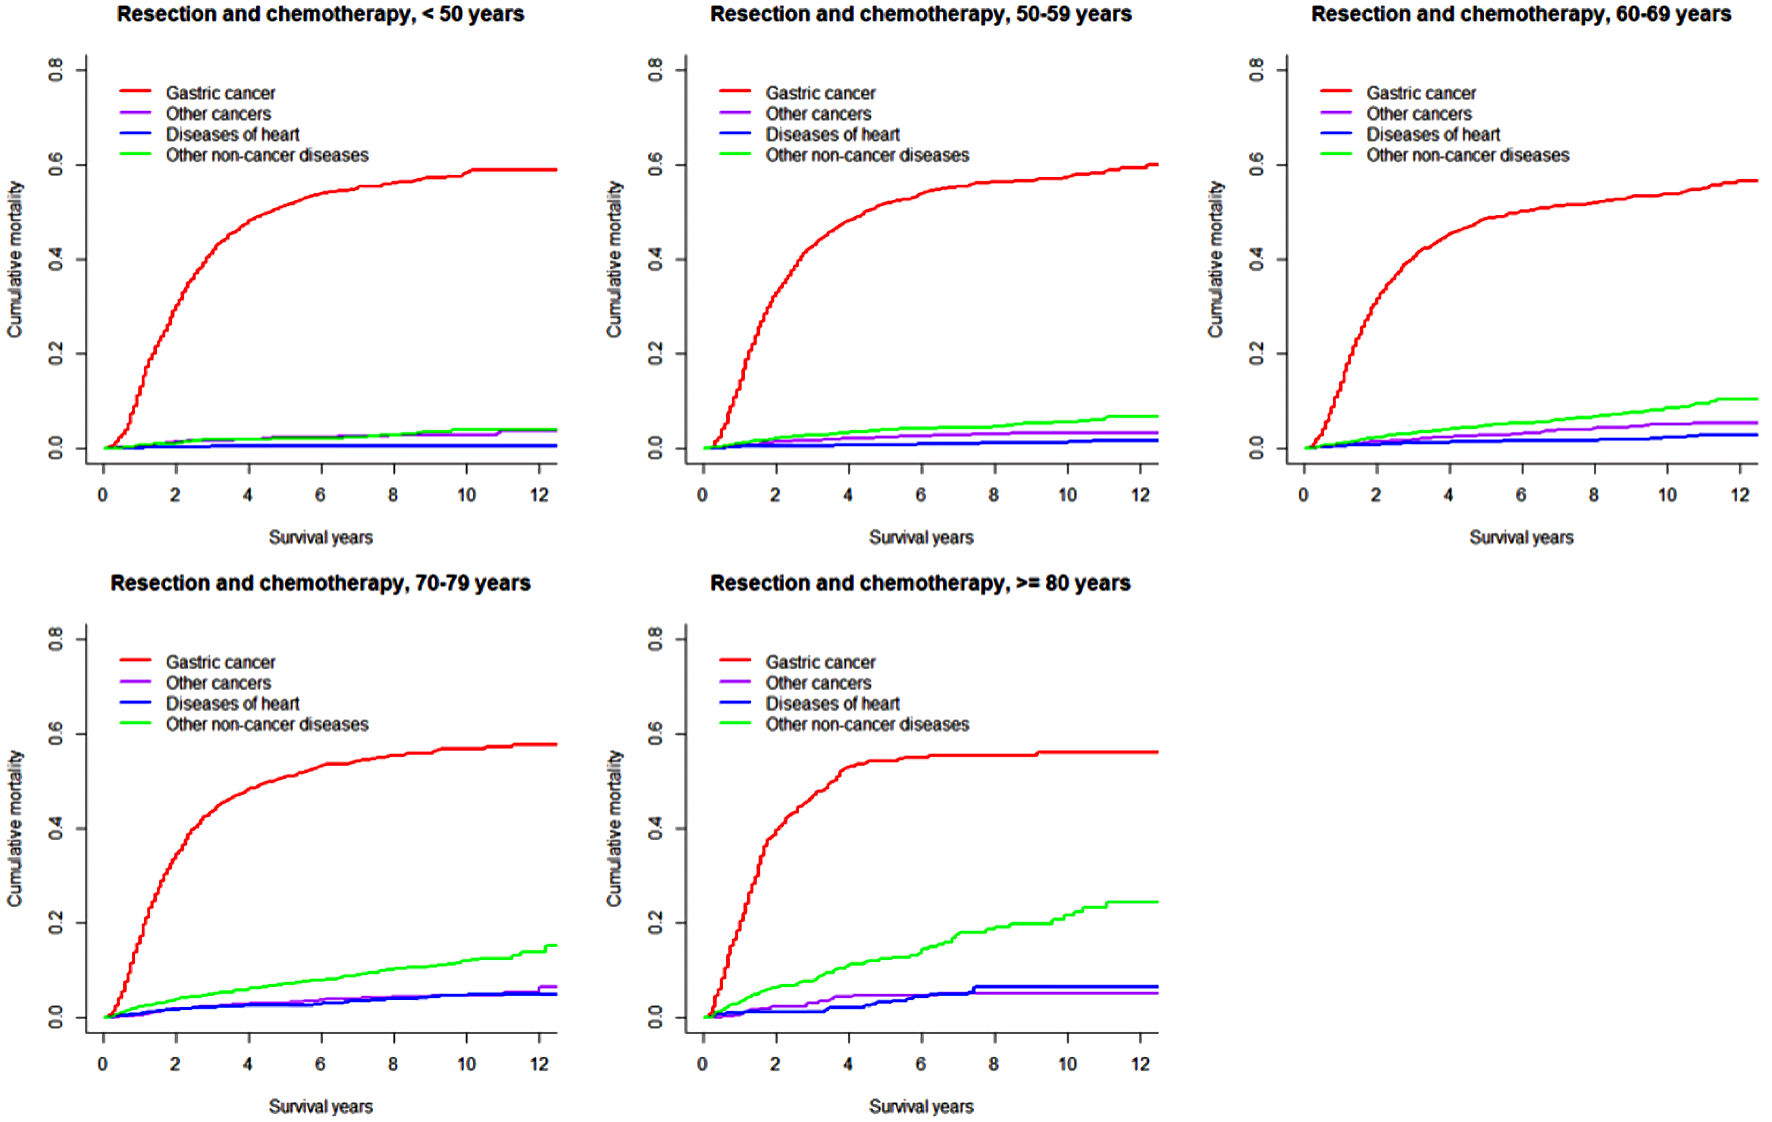
Figure 1. Cumulative incidence function curves illustrating mortality from gastric cancer, other cancers, diseases of heart, and other non-cancer diseases in patients with gastric adenocarcinoma undergoing resection (and chemotherapy).
| World Journal of Oncology, ISSN 1920-4531 print, 1920-454X online, Open Access |
| Article copyright, the authors; Journal compilation copyright, World J Oncol and Elmer Press Inc |
| Journal website https://www.wjon.org |
Original Article
Volume 13, Number 2, April 2022, pages 69-83
Long-Term Cardiac Disease- and Cancer-Associated Mortalities in Patients With Non-Metastatic Stomach Adenocarcinoma Receiving Resection and Chemotherapy: A Large Competing-Risk Population-Based Cohort Study
Figures
Tables
| Variable | Category/comment | Resection | Resection and chemotherapy |
|---|---|---|---|
| aCategorical data are shown as count (percentage (%)), and continuous data as mean ± standard deviation, median (interquartile range). Records are complete otherwise specified below. bLesser curvature, greater curvature, overlapping lesion of stomach, and stomach (NOS). cUnknown tumor local invasion: resection, 300 (1%); resection and chemotherapy, 210 (2%). dUnknown positive lymph node count: resection, 358 (2%); resection and chemotherapy, 257 (2%). eUnknown differentiation grade: 1,555 (7%); 621 (6%). fUnknown size: 2,948 (14%); 1,523 (14%). gThe other category for the non-surgical variables was “no/unknown”, considering the low sensitivity. hShown as median (interquartile range) and computed using the reverse Kaplan-Meier method. NOS: not otherwise specified. | |||
| N | 21,257 | 10,718 | |
| Year of diagnosis | 2010 - 2016 | 10,984 (52) | 6,142 (57) |
| Sex | Male | 13,485 (63) | 7,237 (68) |
| Age (years) | As continuous | 66 ± 13, 67 (57 - 76) | 62 ± 12, 62 (54 - 70) |
| < 50 | 2,399 (11) | 1,730 (16) | |
| 50 - 59 | 3,969 (19) | 2,618 (24) | |
| 60 - 69 | 5,800 (27) | 3,451 (32) | |
| 70 - 79 | 5,752 (27) | 2,391 (22) | |
| ≥ 80 | 3,337 (16) | 528 (5) | |
| Ethnicity | White | 14,245 (67) | 7,402 (69) |
| Black | 2,661 (13) | 1,322 (12) | |
| American Indian/Alaska Native | 181 (1) | 107 (1) | |
| Asian/Pacific Islander | 4,092 (19) | 1,851 (17) | |
| Other unspecified/unknown | 78 (< 1) | 36 (< 1) | |
| Tumor location | Gastric cardia | 6,357 (30) | 3,927 (37) |
| Gastric fundus/body | 2,537 (12) | 1,152 (11) | |
| Gastric antrum/pylorus | 6,106 (29) | 2,614 (24) | |
| Otherb | 6,257 (29) | 3,025 (28) | |
| Tumor local invasionc | Lamina propria/submucosa | 5,887 (28) | 970 (9) |
| Muscularis propria/subserosa | 10,087 (48) | 6,354 (60) | |
| Serosa | 3,693 (18) | 2,385 (23) | |
| Adjacent structures | 1,290 (6) | 799 (8) | |
| Positive lymph node countc | As continuous | 3 ± 6, 1 (0 - 4) | 5 ± 7, 2 (0 - 6) |
| 0 | 10,488 (50) | 3,492 (33) | |
| 1 - 2 | 3,420 (16) | 2,255 (22) | |
| 3 - 6 | 3,168 (15) | 2,132 (20) | |
| 7 - 15 | 2,720 (13) | 1,855 (18) | |
| ≥ 16 | 1,103 (5) | 727 (7) | |
| Tumor differentiation gradee | Well | 1,204 (6) | 281 (3) |
| Intermediate | 5,618 (29) | 2,438 (24) | |
| Poor/undifferentiated | 12,880 (65) | 7,378 (73) | |
| Tumor sizef (cm) | As continuous | 4.6 ± 4.1; 4.0 (2.2 - 6.0) | 5.3 ± 4.2; 4.5 (3.0 - 6.5) |
| < 2 | 3,298 (18) | 795 (9) | |
| 2 - 4 | 5,336 (29) | 2,565 (28) | |
| 4 - 6 | 4,707 (26) | 2,799 (30) | |
| 6 - 8 | 2,652 (14) | 1,628 (18) | |
| ≥ 8 | 2,316 (13) | 1,408 (15) | |
| Resection type | Partial/subtotal gastrectomy | 14,182 (67) | 6,764 (63) |
| Total/near-total gastrectomy | 4,365 (21) | 2,741 (26) | |
| Gastrectomy (NOS) | 2,710 (13) | 1,213 (11) | |
| Chemotherapyg | Yes | 10,718 (50) | 10,718 (100) |
| Radiotherapyg | Yes | 7,410 (35) | 6,981 (65) |
| Follow-up monthsh | As continuous | 73 (36 - 113) | 66 (32 - 105) |
| Accumulated follow-up (person-years) | As continuous | 73,711 | 34,265 |
| Cause of death | Alive | 9,953 (47) | 4,943 (46) |
| Gastric cancer | 8,164 (38) | 4,769 (45) | |
| Other cancers | 676 (3) | 285 (3) | |
| Diseases of heart | 764 (4) | 160 (1) | |
| Other non-cancer diseases | 1,700 (8) | 561 (5) | |
| Group | Time | Resection | Resection and chemotherapy | ||
|---|---|---|---|---|---|
| Heart diseases | Gastric cancer | Heart diseases | Gastric cancer | ||
| Overall | 6 months | 0.7 (0.6 - 0.8) | 7.8 (7.5 - 8.2) | 0.2 (0.1 - 0.3) | 4.4 (4.0 - 4.8) |
| 1 year | 1.1 (1.0 - 1.2) | 16.4 (15.9 - 16.9) | 0.4 (0.3 - 0.6) | 15.0 (14.3 - 15.7) | |
| 2 years | 1.7 (1.5 - 1.9) | 29.0 (28.4 - 29.7) | 0.8 (0.6 - 1.0) | 32.8 (31.9 - 33.8) | |
| 3 years | 2.2 (2.0 - 2.5) | 36.0 (35.3 - 36.6) | 1.0 (0.9 - 1.3) | 42.5 (41.5 - 43.5) | |
| 5 years | 3.0 (2.8 - 3.3) | 42.0 (41.3 - 42.7) | 1.4 (1.2 - 1.7) | 50.7 (49.6 - 51.8) | |
| 8 years | 4.4 (4.1 - 4.7) | 45.2 (44.5 - 46.0) | 2.0 (1.6 - 2.3) | 54.6 (53.5 - 55.8) | |
| < 60 years | 6 months | 0.1 (0.1 - 0.3) | 4.3 (3.8 - 4.8) | 0.0 (0.0 - 0.2) | 3.6 (3.1 - 4.2) |
| 1 year | 0.3 (0.2 - 0.5) | 13.2 (12.4 - 14.1) | 0.2 (0.1 - 0.3) | 13.9 (12.9 - 15.0) | |
| 2 years | 0.5 (0.3 - 0.7) | 27.7 (26.6 - 28.9) | 0.3 (0.2 - 0.6) | 32.0 (30.5 - 33.4) | |
| 3 years | 0.6 (0.4 - 0.8) | 36.1 (34.8 - 37.4) | 0.4 (0.3 - 0.7) | 42.6 (41.0 - 44.2) | |
| 5 years | 0.9 (0.7 - 1.2) | 43.4 (42.0 - 44.8) | 0.6 (0.4 - 0.9) | 51.7 (50.0 - 53.4) | |
| 8 years | 1.4 (1.1 - 1.8) | 47.4 (45.9 - 48.8) | 0.8 (0.5 - 1.2) | 56.1 (54.3 - 57.9) | |
| 60 - 69 years | 6 months | 0.3 (0.2 - 0.5) | 6.2 (5.6 - 6.8) | 0.1 (0.1 - 0.3) | 4.1 (3.5 - 4.9) |
| 1 year | 0.6 (0.4 - 0.8) | 14.2 (13.3 - 15.1) | 0.4 (0.2 - 0.7) | 14.0 (12.9 - 15.3) | |
| 2 years | 1.0 (0.7 - 1.3) | 27.2 (26.0 - 28.4) | 0.7 (0.4 - 1.0) | 31.6 (30.0 - 33.3) | |
| 3 years | 1.4 (1.1 - 1.8) | 34.2 (32.9 - 35.5) | 1.1 (0.7 - 1.5) | 40.7 (38.9 - 42.5) | |
| 5 years | 1.9 (1.6 - 2.4) | 40.4 (39.0 - 41.8) | 1.4 (1.0 - 1.9) | 48.7 (46.7 - 50.5) | |
| 8 years | 2.6 (2.1 - 3.1) | 43.3 (41.9 - 44.8) | 1.6 (1.1 - 2.2) | 52.1 (50.0 - 54.0) | |
| 70 - 79 years | 6 months | 1.0 (0.8 - 1.3) | 9.4 (8.7 - 10.2) | 0.4 (0.2 - 0.8) | 5.5 (4.6 - 6.5) |
| 1 year | 1.5 (1.2 - 1.9) | 17.8 (16.8 - 18.8) | 0.8 (0.5 - 1.2) | 17.3 (15.8 - 18.9) | |
| 2 years | 2.3 (2.0 - 2.8) | 29.4 (28.2 - 30.7) | 1.6 (1.1 - 2.2) | 34.7 (32.7 - 36.7) | |
| 3 years | 2.9 (2.5 - 3.4) | 35.7 (34.4 - 37.1) | 2.1 (1.5 - 2.8) | 44.0 (41.8 - 46.1) | |
| 5 years | 3.8 (3.2 - 4.3) | 41.1 (39.8 - 42.5) | 2.6 (1.9 - 3.3) | 50.9 (48.6 - 53.2) | |
| 8 years | 5.3 (4.6 - 6.1) | 44.3 (42.9 - 45.8) | 3.7 (2.8 - 4.8) | 55.4 (52.9 - 57.7) | |
| ≥ 80 years | 6 months | 1.7 (1.3 - 2.2) | 14.7 (13.5 - 15.9) | 0.6 (0.2 - 1.6) | 8.2 (6.0 - 10.7) |
| 1 year | 2.7 (2.2 - 3.3) | 24.0 (22.5 - 25.5) | 0.8 (0.3 - 1.9) | 20.4 (17.0 - 24.0) | |
| 2 years | 4.2 (3.5 - 4.9) | 34.0 (32.4 - 35.7) | 1.2 (0.5 - 2.5) | 40.0 (35.3 - 44.0) | |
| 3 years | 5.5 (4.7 - 6.4) | 39.2 (37.5 - 40.9) | 1.2 (0.5 - 2.5) | 47.2 (42.5 - 51.6) | |
| 5 years | 7.4 (6.5 - 8.4) | 43.8 (42.0 - 45.6) | 3.0 (1.6 - 5.2) | 54.2 (49.3 - 58.8) | |
| 8 years | 11.1 (9.8 - 12.4) | 46.1 (44.3 - 48.0) | 6.5 (3.9 - 9.9) | 55.5 (50.5 - 60.1) | |
| Variable | Subdistribution hazard ratios | Cause-specific hazard ratios | ||||||||||
|---|---|---|---|---|---|---|---|---|---|---|---|---|
| Heart diseases | P | Ptrend | Gastric cancer | P | Ptrend | Heart diseases | P | Ptrend | Gastric cancer | P | Ptrend | |
| *Statistically significant P values. aAdjusted for: period of diagnosis, sex, age group, ethnicity, tumor location, local invasion, positive lymph node number, differentiation grade, and resection type. bLesser curvature, greater curvature, overlapping lesion of stomach, and stomach (NOS). NOS: not otherwise specified. | ||||||||||||
| Period of diagnosis | Reference: 2010 - 2016 | |||||||||||
| 2004 - 2009 | 1.66 (1.40 - 1.96) | < 0.001* | 1.13 (1.08 - 1.18) | < 0.001* | 1.24 (1.04 - 1.49) | 0.019* | 1.10 (1.05 - 1.15) | < 0.001* | ||||
| Sex | Reference: male | |||||||||||
| Female | 0.88 (0.76 - 1.03) | 0.117 | 1.00 (0.95 - 1.05) | 0.871 | 0.83 (0.70 - 0.97) | 0.019* | 0.97 (0.93 - 1.02) | 0.295 | ||||
| Age group | Reference: 60 - 69 years | |||||||||||
| < 50 years | 0.36 (0.21 - 0.60) | < 0.001* | < 0.001* | 0.90 (0.83 - 0.97) | 0.006* | < 0.001* | 0.31 (0.19 - 0.53) | < 0.001* | < 0.001* | 0.85 (0.79 - 0.92) | < 0.001* | < 0.001* |
| 50 - 59 years | 0.58 (0.41 - 0.82) | 0.002* | 0.94 (0.88 - 1.01) | 0.080 | 0.54 (0.38 - 0.77) | 0.001* | 0.92 (0.86 - 0.99) | 0.017* | ||||
| 70 - 79 years | 1.99 (1.59 - 2.49) | < 0.001* | 1.22 (1.14 - 1.29) | < 0.001* | 2.39 (1.91 - 3.00) | < 0.001* | 1.33 (1.25 - 1.42) | < 0.001* | ||||
| ≥ 80 years | 3.88 (3.11 - 4.84) | < 0.001* | 1.49 (1.38 - 1.61) | < 0.001* | 6.06 (4.83 - 7.61) | < 0.001* | 1.79 (1.67 - 1.93) | < 0.001* | ||||
| Ethnicity | Reference: White | |||||||||||
| Black | 1.31 (1.05 - 1.63) | 0.017* | < 0.001* | 0.99 (0.92 - 1.06) | 0.735 | < 0.001* | 1.41 (1.13 - 1.75) | 0.003* | < 0.001* | 1.04 (0.97 - 1.11) | 0.298 | < 0.001* |
| American Indian/Alaska Native | 1.54 (0.72 - 3.31) | 0.269 | 1.18 (0.91 - 1.52) | 0.225 | 1.95 (0.92 - 4.12) | 0.082 | 1.31 (1.04 - 1.65) | 0.021* | ||||
| Asian/Pacific Islander | 0.81 (0.66 - 0.99) | 0.043* | 0.78 (0.74 - 0.83) | < 0.001* | 0.73 (0.59 - 0.89) | 0.002* | 0.75 (0.70 - 0.80) | < 0.001* | ||||
| Tumor location | Reference: gastric cardia | |||||||||||
| Gastric fundus/body | 1.23 (0.93 - 1.63) | 0.155 | 0.043* | 0.70 (0.65 - 0.76) | < 0.001* | < 0.001* | 1.13 (0.85 - 1.49) | 0.413 | 0.436 | 0.70 (0.64 - 0.76) | < 0.001* | < 0.001* |
| Gastric antrum/pylorus | 1.39 (1.11 - 1.75) | 0.004* | 0.74 (0.69 - 0.79) | < 0.001* | 1.21 (0.96 - 1.53) | 0.102 | 0.73 (0.68 - 0.78) | < 0.001* | ||||
| Otherb | 1.24 (0.99 - 1.56) | 0.064 | 0.74 (0.70 - 0.79) | < 0.001* | 1.11 (0.88 - 1.40) | 0.362 | 0.74 (0.69 - 0.78) | < 0.001* | ||||
| Tumor local invasion | Reference: muscularis propria/subserosa | |||||||||||
| Lamina propria/submucosa | 1.14 (0.95 - 1.37) | 0.150 | 0.025* | 0.44 (0.41 - 0.48) | < 0.001* | < 0.001* | 0.95 (0.79 - 1.14) | 0.553 | 0.569 | 0.43 (0.40 - 0.47) | < 0.001* | < 0.001* |
| Serosa | 0.76 (0.59 - 0.98) | 0.034* | 1.44 (1.37 - 1.53) | < 0.001* | 0.99 (0.78 - 1.28) | 0.960 | 1.49 (1.41 - 1.58) | < 0.001* | ||||
| Adjacent structures | 0.77 (0.52 - 1.14) | 0.197 | 1.94 (1.78 - 2.11) | < 0.001* | 1.27 (0.86 - 1.88) | 0.232 | 2.07 (1.92 - 2.24) | < 0.001* | ||||
| Positive lymph node count | Reference: 0 | |||||||||||
| 1 - 2 | 0.82 (0.66 - 1.03) | 0.084 | 0.003* | 1.66 (1.55 - 1.78) | < 0.001* | < 0.001* | 0.96 (0.77 - 1.20) | 0.736 | 0.374 | 1.68 (1.57 - 1.81) | < 0.001* | < 0.001* |
| 3 - 6 | 0.66 (0.51 - 0.86) | 0.002* | 2.10 (1.96 - 2.25) | < 0.001* | 0.88 (0.68 - 1.14) | 0.324 | 2.18 (2.04 - 2.34) | < 0.001* | ||||
| 7 - 15 | 0.71 (0.53 - 0.96) | 0.023* | 2.81 (2.61 - 3.02) | < 0.001* | 1.23 (0.92 - 1.65) | 0.156 | 3.05 (2.85 - 3.28) | < 0.001* | ||||
| ≥ 16 | 0.52 (0.31 - 0.86) | 0.012* | 3.69 (3.36 - 4.05) | < 0.001* | 1.12 (0.68 - 1.86) | 0.657 | 4.15 (3.79 - 4.54) | < 0.001* | ||||
| Differentiation | Reference: poor/undifferentiated | |||||||||||
| Well | 1.11 (0.84 - 1.47) | 0.449 | 0.734 | 0.67 (0.58 - 0.77) | < 0.001* | < 0.001* | 0.99 (0.74 - 1.31) | 0.920 | 0.681 | 0.65 (0.57 - 0.75) | < 0.001* | < 0.001* |
| Intermediate | 1.04 (0.88 - 1.22) | 0.674 | 0.75 (0.71 - 0.79) | < 0.001* | 0.93 (0.79 - 1.10) | 0.388 | 0.73 (0.69 - 0.78) | < 0.001* | ||||
| Resection type | Reference: partial/subtotal gastrectomy | |||||||||||
| Total/near-total gastrectomy | 1.04 (0.84 - 1.30) | 0.712 | 0.020* | 1.16 (1.09 - 1.22) | < 0.001* | < 0.001* | 1.12 (0.90 - 1.40) | 0.306 | 0.001* | 1.17 (1.11 - 1.24) | < 0.001* | < 0.001* |
| Gastrectomy (NOS) | 1.40 (1.11 - 1.78) | 0.005* | 1.18 (1.09 - 1.28) | < 0.001* | 1.63 (1.27 - 2.08) | < 0.001* | 1.22 (1.13 - 1.32) | < 0.001* | ||||
| Variable | Subdistribution hazard ratios | Cause-specific hazard ratios | ||||||||||
|---|---|---|---|---|---|---|---|---|---|---|---|---|
| Heart diseases | P | Ptrend | Gastric cancer | P | Ptrend | Heart diseases | P | Ptrend | Gastric cancer | P | Ptrend | |
| *Statistically significant P values. aAdjusted for: period of diagnosis, sex, age group, ethnicity, tumor location, local invasion, positive lymph node number, differentiation grade, and resection type. bLesser curvature, greater curvature, overlapping lesion of stomach, and stomach (NOS). NOS: not otherwise specified. | ||||||||||||
| Period of diagnosis | Reference: 2010 - 2016 | |||||||||||
| 2004 - 2009 | 1.40 (1.00 - 1.95) | 0.048* | 1.11 (1.05 - 1.19) | 0.001* | 1.00 (0.69 - 1.45) | 0.998 | 1.08 (1.02 - 1.15) | 0.013* | ||||
| Sex | Reference: male | |||||||||||
| Female | 0.84 (0.58 - 1.22) | 0.360 | 0.98 (0.92 - 1.05) | 0.643 | 0.80 (0.55 - 1.15) | 0.233 | 0.98 (0.92 - 1.05) | 0.547 | ||||
| Age group | Reference: 60 - 69 years | |||||||||||
| < 50 years | 0.25 (0.11 - 0.61) | 0.002* | < 0.001* | 0.95 (0.87 - 1.04) | 0.247 | < 0.001* | 0.23 (0.10 - 0.55) | 0.001* | < 0.001* | 0.92 (0.84 - 1.00) | 0.060 | < 0.001* |
| 50 - 59 years | 0.50 (0.29 - 0.86) | 0.012* | 1.01 (0.93 - 1.09) | 0.841 | 0.48 (0.28 - 0.83) | 0.009* | 0.99 (0.92 - 1.08) | 0.869 | ||||
| 70 - 79 years | 1.88 (1.27 - 2.77) | 0.002* | 1.16 (1.07 - 1.26) | 0.001* | 2.23 (1.51 - 3.29) | < 0.001* | 1.24 (1.14 - 1.35) | < 0.001* | ||||
| ≥ 80 years | 2.72 (1.58 - 4.68) | < 0.001* | 1.17 (1.01 - 1.37) | 0.040* | 3.76 (2.18 - 6.48) | < 0.001* | 1.30 (1.13 - 1.50) | < 0.001* | ||||
| Ethnicity | Reference: White | |||||||||||
| Black | 1.63 (1.04 - 2.57) | 0.035* | < 0.001* | 0.97 (0.88 - 1.07) | 0.544 | < 0.001* | 1.74 (1.11 - 2.71) | 0.015* | 0.010* | 0.99 (0.90 - 1.09) | 0.851 | < 0.001* |
| American Indian/Alaska Native | 1.69 (0.40 - 7.10) | 0.477 | 1.19 (0.87 - 1.64) | 0.283 | 2.28 (0.55 - 9.35) | 0.255 | 1.31 (0.99 - 1.74) | 0.061 | ||||
| Asian/Pacific Islander | 0.70 (0.41 - 1.17) | 0.173 | 0.79 (0.73 - 0.86) | < 0.001* | 0.61 (0.36 - 1.01) | 0.057 | 0.76 (0.70 - 0.83) | < 0.001* | ||||
| Tumor location | Reference: gastric cardia | |||||||||||
| Gastric fundus/body | 0.97 (0.52 - 1.81) | 0.912 | 0.723 | 0.69 (0.62 - 0.77) | < 0.001* | < 0.001* | 0.78 (0.42 - 1.44) | 0.423 | 0.655 | 0.66 (0.59 - 0.74) | < 0.001* | < 0.001* |
| Gastric antrum/pylorus | 1.18 (0.76 - 1.83) | 0.454 | 0.75 (0.68 - 0.81) | < 0.001* | 0.94 (0.59 - 1.49) | 0.794 | 0.72 (0.66 - 0.79) | < 0.001* | ||||
| Otherb | 0.92 (0.58 - 1.47) | 0.741 | 0.75 (0.69 - 0.82) | < 0.001* | 0.77 (0.49 - 1.22) | 0.270 | 0.73 (0.67 - 0.79) | < 0.001* | ||||
| Tumor local invasion | Reference: muscularis propria/subserosa | |||||||||||
| Lamina propria/submucosa | 1.20 (0.72 - 2.00) | 0.481 | 0.331 | 0.59 (0.51 - 0.68) | < 0.001* | < 0.001* | 1.04 (0.63 - 1.71) | 0.887 | 0.702 | 0.59 (0.51 - 0.67) | < 0.001* | < 0.001* |
| Serosa | 0.69 (0.44 - 1.09) | 0.113 | 1.38 (1.29 - 1.48) | < 0.001* | 0.85 (0.54 - 1.32) | 0.461 | 1.42 (1.33 - 1.53) | < 0.001* | ||||
| Adjacent structures | 0.90 (0.47 - 1.74) | 0.763 | 1.80 (1.62 - 2.00) | < 0.001* | 1.30 (0.67 - 2.52) | 0.436 | 1.87 (1.69 - 2.07) | < 0.001* | ||||
| Positive lymph node count | Reference: 0 | |||||||||||
| 1 - 2 | 0.86 (0.56 - 1.31) | 0.474 | 0.656 | 1.42 (1.29 - 1.55) | < 0.001* | < 0.001* | 0.95 (0.62 - 1.45) | 0.798 | 0.268 | 1.42 (1.30 - 1.56) | < 0.001* | < 0.001* |
| 3 - 6 | 0.70 (0.44 - 1.14) | 0.151 | 1.82 (1.66 - 1.99) | < 0.001* | 0.83 (0.52 - 1.34) | 0.452 | 1.86 (1.70 - 2.03) | < 0.001* | ||||
| 7 - 15 | 0.92 (0.57 - 1.50) | 0.748 | 2.46 (2.24 - 2.69) | < 0.001* | 1.45 (0.89 - 2.36) | 0.137 | 2.61 (2.38 - 2.86) | < 0.001* | ||||
| ≥ 16 | 0.73 (0.35 - 1.56) | 0.423 | 3.26 (2.89 - 3.67) | < 0.001* | 1.47 (0.68 - 3.19) | 0.324 | 3.59 (3.19 - 4.04) | < 0.001* | ||||
| Differentiation | Reference: poor/undifferentiated | |||||||||||
| Well | 1.18 (0.51 - 2.70) | 0.704 | 0.898 | 0.80 (0.65 - 0.99) | 0.038* | < 0.001* | 1.16 (0.50 - 2.67) | 0.732 | 0.647 | 0.80 (0.65 - 0.99) | 0.038* | < 0.001* |
| Intermediate | 0.96 (0.67 - 1.38) | 0.829 | 0.73 (0.67 - 0.79) | < 0.001* | 0.86 (0.59 - 1.25) | 0.418 | 0.72 (0.66 - 0.78) | < 0.001* | ||||
| Resection type | Reference: partial/subtotal gastrectomy | |||||||||||
| Total/near-total gastrectomy | 0.99 (0.65 - 1.49) | 0.942 | 0.185 | 1.22 (1.14 - 1.31) | < 0.001* | < 0.001* | 1.06 (0.70 - 1.61) | 0.791 | 0.121 | 1.23 (1.15 - 1.32) | < 0.001* | < 0.001* |
| Gastrectomy (NOS) | 1.52 (0.96 - 2.43) | 0.075 | 1.28 (1.16 - 1.42) | < 0.001* | 1.68 (1.02 - 2.76) | 0.041* | 1.29 (1.17 - 1.43) | < 0.001* | ||||