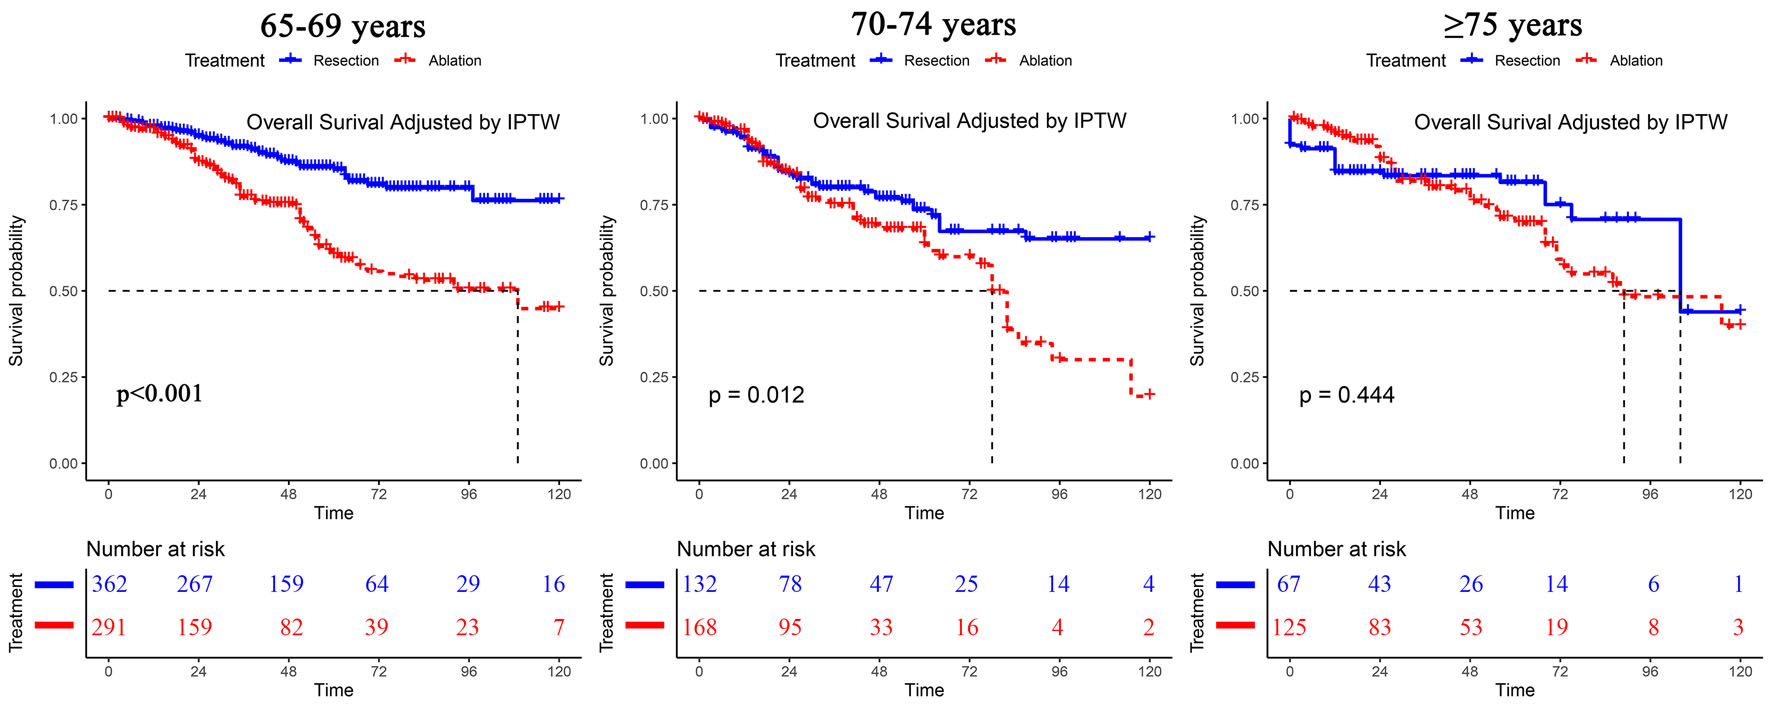
Figure 1. Overall survival analyses of patients stratified by age after IPTW. IPTW: inverse probability of treatment weighting.
| World Journal of Oncology, ISSN 1920-4531 print, 1920-454X online, Open Access |
| Article copyright, the authors; Journal compilation copyright, World J Oncol and Elmer Press Inc |
| Journal website https://www.wjon.org |
Original Article
Volume 14, Number 2, April 2023, pages 125-134
Overall Survival Rates Become Similar Between Percutaneous Ablation and Hepatic Resection With Increasing Age Among Elderly Patients With Early Hepatocellular Carcinoma
Figures
Tables
| Age 65 - 69 | Age 70 - 74 | Age ≥ 75 | P | |
|---|---|---|---|---|
| AFP: α-fetoprotein; ALB: albumin; ALT: alanine aminotransferase; AST: aspartate aminotransferase; HBV: hepatitis B virus; HCC: hepatocellular carcinoma; PLT: platelet; PT: prothrombin time; INR: international normalized ratio; SCr: serum creatinine; TBIL: total bilirubin. | ||||
| Treatment | < 0.001 | |||
| Resection | 362 (55.4%) | 132 (44.0%) | 67 (34.9%) | |
| Ablation | 291 (44.6%) | 168 (56.0%) | 125 (65.1%) | |
| Age | 66.50 ± 1.42 | 71.85 ± 1.45 | 78.61 ± 3.52 | < 0.001 |
| Sex | 0.19 | |||
| Male | 535 (81.9%) | 231 (77.0%) | 152 (79.2%) | |
| Female | 118 (18.1%) | 69 (23.0%) | 40 (20.8%) | |
| Background disease of the liver | 0.001 | |||
| HBV infection | 435 (66.6%) | 181 (60.3%) | 101 (52.6%) | |
| Other | 218 (33.4%) | 119 (39.7%) | 91 (47.4%) | |
| Comorbid illness | ||||
| Hypertension | 180 (27.6%) | 111 (37.0%) | 88 (45.8%) | < 0.001 |
| Diabetes | 108 (16.5%) | 51 (17.0%) | 42 (21.9%) | 0.22 |
| Heart disease | 46 (7.0%) | 32 (10.7%) | 29 (15.1%) | 0.002 |
| Tumor size | 28.39 ± 11.15 | 29.02 ± 10.91 | 29.48 ± 10.99 | 0.43 |
| Tumor count | 0.09 | |||
| 1 | 573 (87.7%) | 256 (85.3%) | 154 (80.2%) | |
| 2 | 61 (9.3%) | 33 (11.0%) | 26 (13.5%) | |
| 3 | 19 (2.9%) | 11 (3.7%) | 12 (6.2%) | |
| AFP | 0.23 | |||
| < 10 | 300 (45.9%) | 121 (40.3%) | 92 (47.9%) | |
| 10 - 100 | 150 (23.0%) | 62 (20.7%) | 46 (24.0%) | |
| 100 - 1,000 | 114 (17.5%) | 65 (21.7%) | 31 (16.1%) | |
| > 1,000 | 89 (13.6%) | 52 (17.3%) | 23 (12.0%) | |
| ALT | 42.07 ± 63.37 | 35.16 ± 28.34 | 32.76 ± 25.85 | 0.03 |
| AST | 42.27 ± 52.45 | 39.46 ± 28.16 | 36.97 ± 27.23 | 0.29 |
| ALB | 41.66 ± 15.45 | 40.51 ± 4.77 | 40.51 ± 4.03 | 0.28 |
| TBIL | 16.69 ± 18.91 | 15.70 ± 8.65 | 15.05 ± 6.85 | 0.35 |
| PLT | 146.00 ± 65.90 | 147.59 ± 68.92 | 148.23 ± 63.27 | 0.89 |
| PT | 12.70 ± 1.76 | 12.87 ± 1.69 | 12.89 ± 1.82 | 0.23 |
| INR | 1.07 ± 0.12 | 1.08 ± 0.12 | 1.06 ± 0.10 | 0.35 |
| SCr | 77.56 ± 26.87 | 80.13 ± 54.37 | 80.36 ± 23.22 | 0.46 |
| Child-Pugh class | 0.36 | |||
| A | 620 (94.9%) | 286 (95.3%) | 187 (97.4%) | |
| B | 33 (5.1%) | 14 (4.7%) | 5 (2.6%) | |
| C | 0 (0%) | 0 (0%) | 0 (0%) | |
| Liver cirrhosis | 0.17 | |||
| Yes | 269 (41.2%) | 142 (47.3%) | 78 (40.6%) | |
| No | 384 (58.8%) | 158 (52.7%) | 114 (59.4%) | |
| Causes of death | ||||
| HCC-related death | 111 (90.2%) | 58 (76.3%) | 35 (76.1%) | 0.035 |
| Liver-related death | 10 (8.1%) | 13 (17.1%) | 8 (17.4%) | |
| Other causes | 2 (1.6%) | 5 (6.6%) | 3 (6.5%) | |
| 65 - 69 years of age after IPTW | 70 - 74 years of age after IPTW | ≥ 75 years of age after IPTW | |||||||
|---|---|---|---|---|---|---|---|---|---|
| Resection (na = 603) | Ablation (na = 671) | P | Resection (na = 258) | Ablation (na = 317) | P | Resection (na = 155) | Ablation (na = 186) | P | |
| aThe sample size was adjusted because of IPTW. IPTW: inverse probability of treatment weighting; AFP: α-fetoprotein; ALB: albumin; ALT: alanine aminotransferase; AST: aspartate aminotransferase; HBV: hepatitis B virus; PLT: platelet; PT: prothrombin time; INR: international normalized ratio; SCr: serum creatinine; TBIL: total bilirubin. | |||||||||
| Age | 66.5 ± 1.5 | 66.5 ± 1.4 | 0.96 | 71.8 ± 1.4 | 71.8 ± 1.4 | 1.00 | 77.9 ± 2.8 | 78.6 ± 3.6 | 0.07 |
| Sex | 0.79 | 0.40 | 0.35 | ||||||
| Male | 496 (82.3%) | 548 (81.7%) | 199 (76.8%) | 252 (79.7%) | 131 (84.5%) | 150 (80.6%) | |||
| Female | 107 (17.7%) | 123 (18.3%) | 60 (23.2%) | 64 (20.3%) | 24 (15.5%) | 36 (19.4%) | |||
| Background disease of the liver | 0.86 | 0.27 | 0.13 | ||||||
| HBV infection | 380 (63.0%) | 436 (64.9%) | 136 (52.7%) | 181 (57.3%) | 73 (47.1%) | 103 (55.4%) | |||
| Other | 223 (37.0%) | 236 (35.1%) | 122 (47.3%) | 135 (42.7%) | 82 (52.9%) | 83 (44.6%) | |||
| Comorbid illness | |||||||||
| Hypertension | 156 (25.9%) | 178 (26.5%) | 0.79 | 81 (31.4%) | 132 (41.6%) | 0.11 | 73 (47.1%) | 81 (43.8%) | 0.54 |
| Diabetes | 96 (15.9%) | 108 (16.1%) | 0.93 | 53 (20.5%) | 61 (19.2%) | 0.71 | 32 (20.6%) | 38 (20.5%) | 0.98 |
| Heart disease | 44 (7.3%) | 49 (7.3%) | 1.00 | 26 (10.0%) | 46 (14.6%) | 0.10 | 23 (14.8%) | 25 (13.5%) | 0.73 |
| Tumor size | 29.0 ± 11.5 | 28.4 ± 11.0 | 0.35 | 28.8 ± 11.5 | 29.1 ± 10.3 | 0.80 | 30.2 ± 11.5 | 28.3 ± 10.2 | 0.11 |
| Tumor count | 0.10 | 0.49 | 0.03 | ||||||
| 1 | 544 (90.2%) | 584 (87.0%) | 221 (85.3%) | 259 (82.0%) | 137 (88.4%) | 149 (80.1%) | |||
| 2 | 51 (8.5%) | 68 (10.2%) | 31 (12.0%) | 44 (13.9%) | 16 (10.3%) | 25 (13.4%) | |||
| 3 | 8 (1.3%) | 19 (2.8%) | 7 (2.7%) | 13 (4.1%) | 2 (1.3%) | 12 (6.5%) | |||
| AFP | 0.44 | 0.26 | 0.46 | ||||||
| < 10 | 288 (47.7%) | 302 (45.0%) | 136 (52.7%) | 146 (46.1%) | 86 (55.5%) | 89 (48.1%) | |||
| 10 - 100 | 131 (21.7%) | 160 (23.8%) | 46 (17.8%) | 54 (17.0%) | 34 (21.9%) | 42 (22.7%) | |||
| 100 - 1,000 | 110 (18.2%) | 137 (20.4%) | 52 (20.2%) | 75 (23.7%) | 18 (11.6%) | 31 (16.8%) | |||
| > 1,000 | 75 (12.4%) | 72 (10.7%) | 24 (9.3%) | 42 (13.2%) | 17 (11.0%) | 23 (12.4%) | |||
| ALT | 43.1 ± 66.6 | 43.2 ± 50.5 | 0.98 | 33.7 ± 24.1 | 31.6 ± 26.7 | 0.32 | 30.7 ± 20.6 | 32.9 ± 25.6 | 0.39 |
| AST | 42.6 ± 53.5 | 42.1 ± 40.4 | 0.87 | 37.8 ± 23.6 | 36.7 ± 28.2 | 0.63 | 32.9 ± 16.9 | 37.7 ± 28.5 | 0.07 |
| ALB | 42.0 ± 15.9 | 41.3 ± 4.5 | 0.27 | 41.0 ± 4.4 | 40.7 ± 4.8 | 0.46 | 41.4 ± 3.5 | 40.3 ± 4.1 | 0.01 |
| TBIL | 15.9 ± 15.1 | 15.8 ± 15.2 | 0.88 | 15.2 ± 6.6 | 15.3 ± 8.8 | 0.89 | 13.7 ± 5.5 | 14.9 ± 6.7 | 0.07 |
| PLT | 151.5 ± 64.9 | 145.4 ± 63.3 | 0.09 | 159.0 ± 58.3 | 158.7 ± 81.5 | 0.98 | 152.2 ± 61.4 | 142.7 ± 58.4 | 0.14 |
| PT | 12.4 ± 1.8 | 12.6 ± 1.7 | 0.02 | 12.5 ± 1.6 | 12.8 ± 1.7 | 0.07 | 12.1 ± 1.1 | 12.9 ± 1.9 | < 0.001 |
| INR | 1.1 ± 0.1 | 1.1 ± 0.1 | 0.26 | 1.1 ± 1.1 | 1.1 ± 1.1 | 0.79 | 1.0 ± 0.1 | 1.1 ± 0.1 | 0.01 |
| SCr | 77.9 ± 21.0 | 75.9 ± 32.6 | 0.20 | 79.5 ± 18.2 | 80.9 ± 59.5 | 0.71 | 78.2 ± 27.6 | 80.0 ± 21.1 | 0.49 |
| Child-Pugh class | |||||||||
| A | 585 (97.0%) | 641 (95.5%) | 0.16 | 254 (98.1%) | 304 (96.2%) | 0.19 | 155 (100.0%) | 181 (97.3%) | 0.04 |
| B | 18 (3.0%) | 30 (0.5%) | 5 (1.9%) | 12 (3.8%) | 0 (0%) | 5 (2.7%) | |||
| C | 0 (0%) | 0 (0%) | 0 (0%) | 0 (0%) | 0 (0%) | 0 (0%) | |||
| Liver cirrhosis | 0.10 | 0.11 | 0.001 | ||||||
| Yes | 213 (35.3%) | 267 (39.8%) | 96 (37.2%) | 139 (43.8%) | 37 (23.9%) | 77 (41.4%) | |||
| No | 390 (64.7%) | 404 (60.2%) | 162 (62.8%) | 178 (56.2%) | 118 (76.1%) | 109 (58.6%) | |||
| Hazard ratio | 95% CI | P value | P value for interaction | |
|---|---|---|---|---|
| CI: confidence interval. | ||||
| Overall survival | ||||
| Resection vs. ablation (age 65 - 69 years) | 0.38 | 0.28 - 0.50 | < 0.001 | Reference |
| Resection vs. ablation (age 70 - 74 years) | 0.64 | 0.45 - 0.91 | 0.01 | 0.039 |
| Resection vs. ablation (age ≥ 75 years) | 0.84 | 0.55 - 1.30 | 0.44 | 0.002 |
| Recurrence-free survival | ||||
| Resection vs. ablation (age 65 - 69 years) | 0.59 | 0.51 - 0.70 | < 0.001 | Reference |
| Resection vs. ablation (age 70 - 74 years) | 0.49 | 0.37 - 0.64 | < 0.001 | 0.054 |
| Resection vs. ablation (age ≥ 75 years) | 0.72 | 0.52 - 0.99 | 0.04 | 0.197 |
| Resection group | Ablation group | P | |
|---|---|---|---|
| aTotal cost was calculated by adding cost of each hospitalization. bTotal in-hospital days was calculated by adding days of each hospitalization. HCC: hepatocellular carcinoma; IPTW: inverse probability of treatment weighting. | |||
| Total costa for HCC treatment ($) | 11,411.62 ± 7,453.18 | 11,422.80 ± 10,752.22 | 0.99 |
| Total in-hospital daysb for HCC treatment | 19.10 ± 11.68 | 17.84 ± 18.48 | 0.45 |
| Total times of hospitalization for HCC treatment | 2.15 ± 1.91 | 3.34 ± 3.72 | < 0.001 |
| Surgery time (min) | 150.01 ± 71.52 | 80.64 ± 66.60 | < 0.001 |
| Intensive care unit admission | < 0.001 | ||
| Yes | 27.4% | 3.8% | |
| No | 72.6% | 96.2% | |
| Mortality within 30 days | 2 | 2 | 0.97 |
| Mortality within 90 days | 5 | 4 | 0.69 |