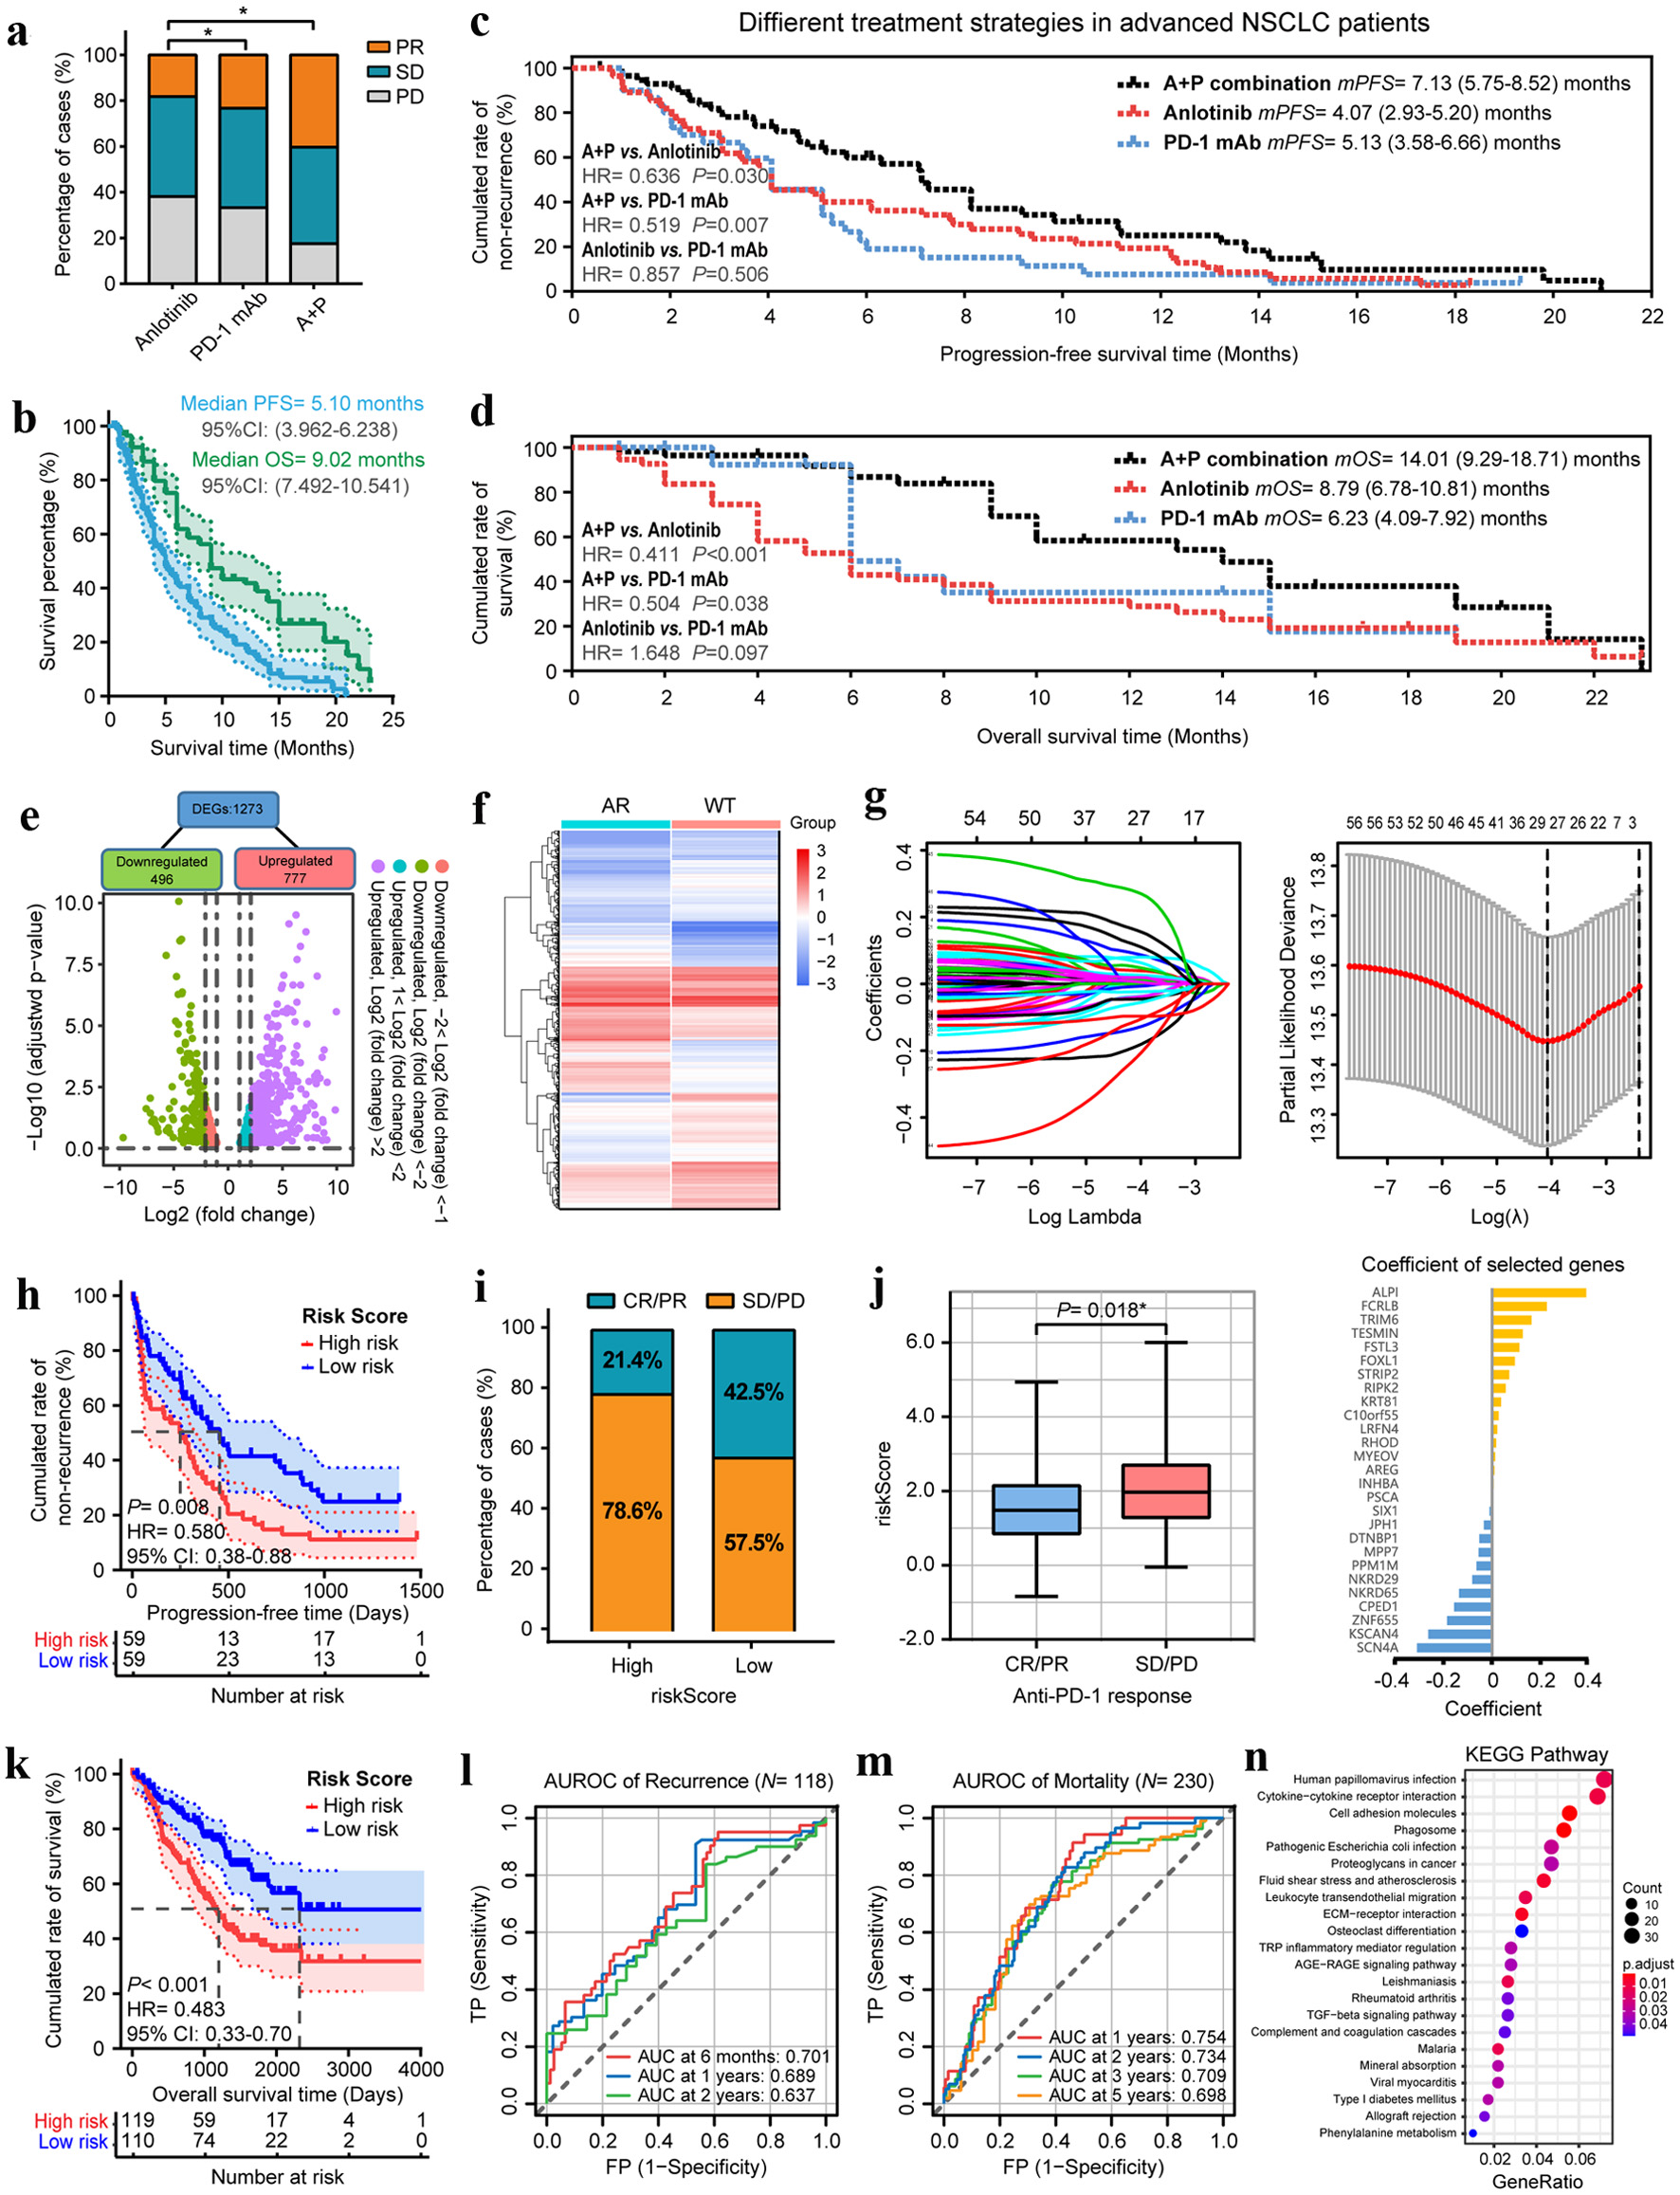
Figure 1. Anlotinib changes the TME and broadens the benefits of anti-PD-1 immunotherapy in patients with advanced NSCLC. (a) The objective tumor response of patients in anlotinib, PD-1 mAb and A+P combination groups. (b) The PFS and OS curves of overall patients. (c) The PFS and OS curves of patients in anlotinib, PD-1 mAb and A+P combination groups. (d) Scatter-plot of anlotinib-responsive gene differential screening. (e) Heatmap of the differential expressions of 1,273 DEGs after anlotinib treatments. (f) Coefficients of LASSO regression analysis. (g) The cross-validation results of LASSO regression and coefficients of selected genes. (h) Kaplan-Meier analysis demonstrated that the PFS of patients who received PD-1 mAb in the high-risk group were significantly shorter than those of the low-risk group. (i) The ORR of patients in high- and low-risk groups. (j) Box-plot of the ARIM-scores for different anti-tumor treatment responses. (k) The OS of patients who received PD-1 mAb in the high- and low-risk groups. (l, m) Time-dependent ROC curves for recurrence and mortality of patients who received PD-1 mAb at different follow-up times. (n) KEGG pathway enrichment analysis of the 1273 DEGs. *P < 0.05, **P < 0.01.