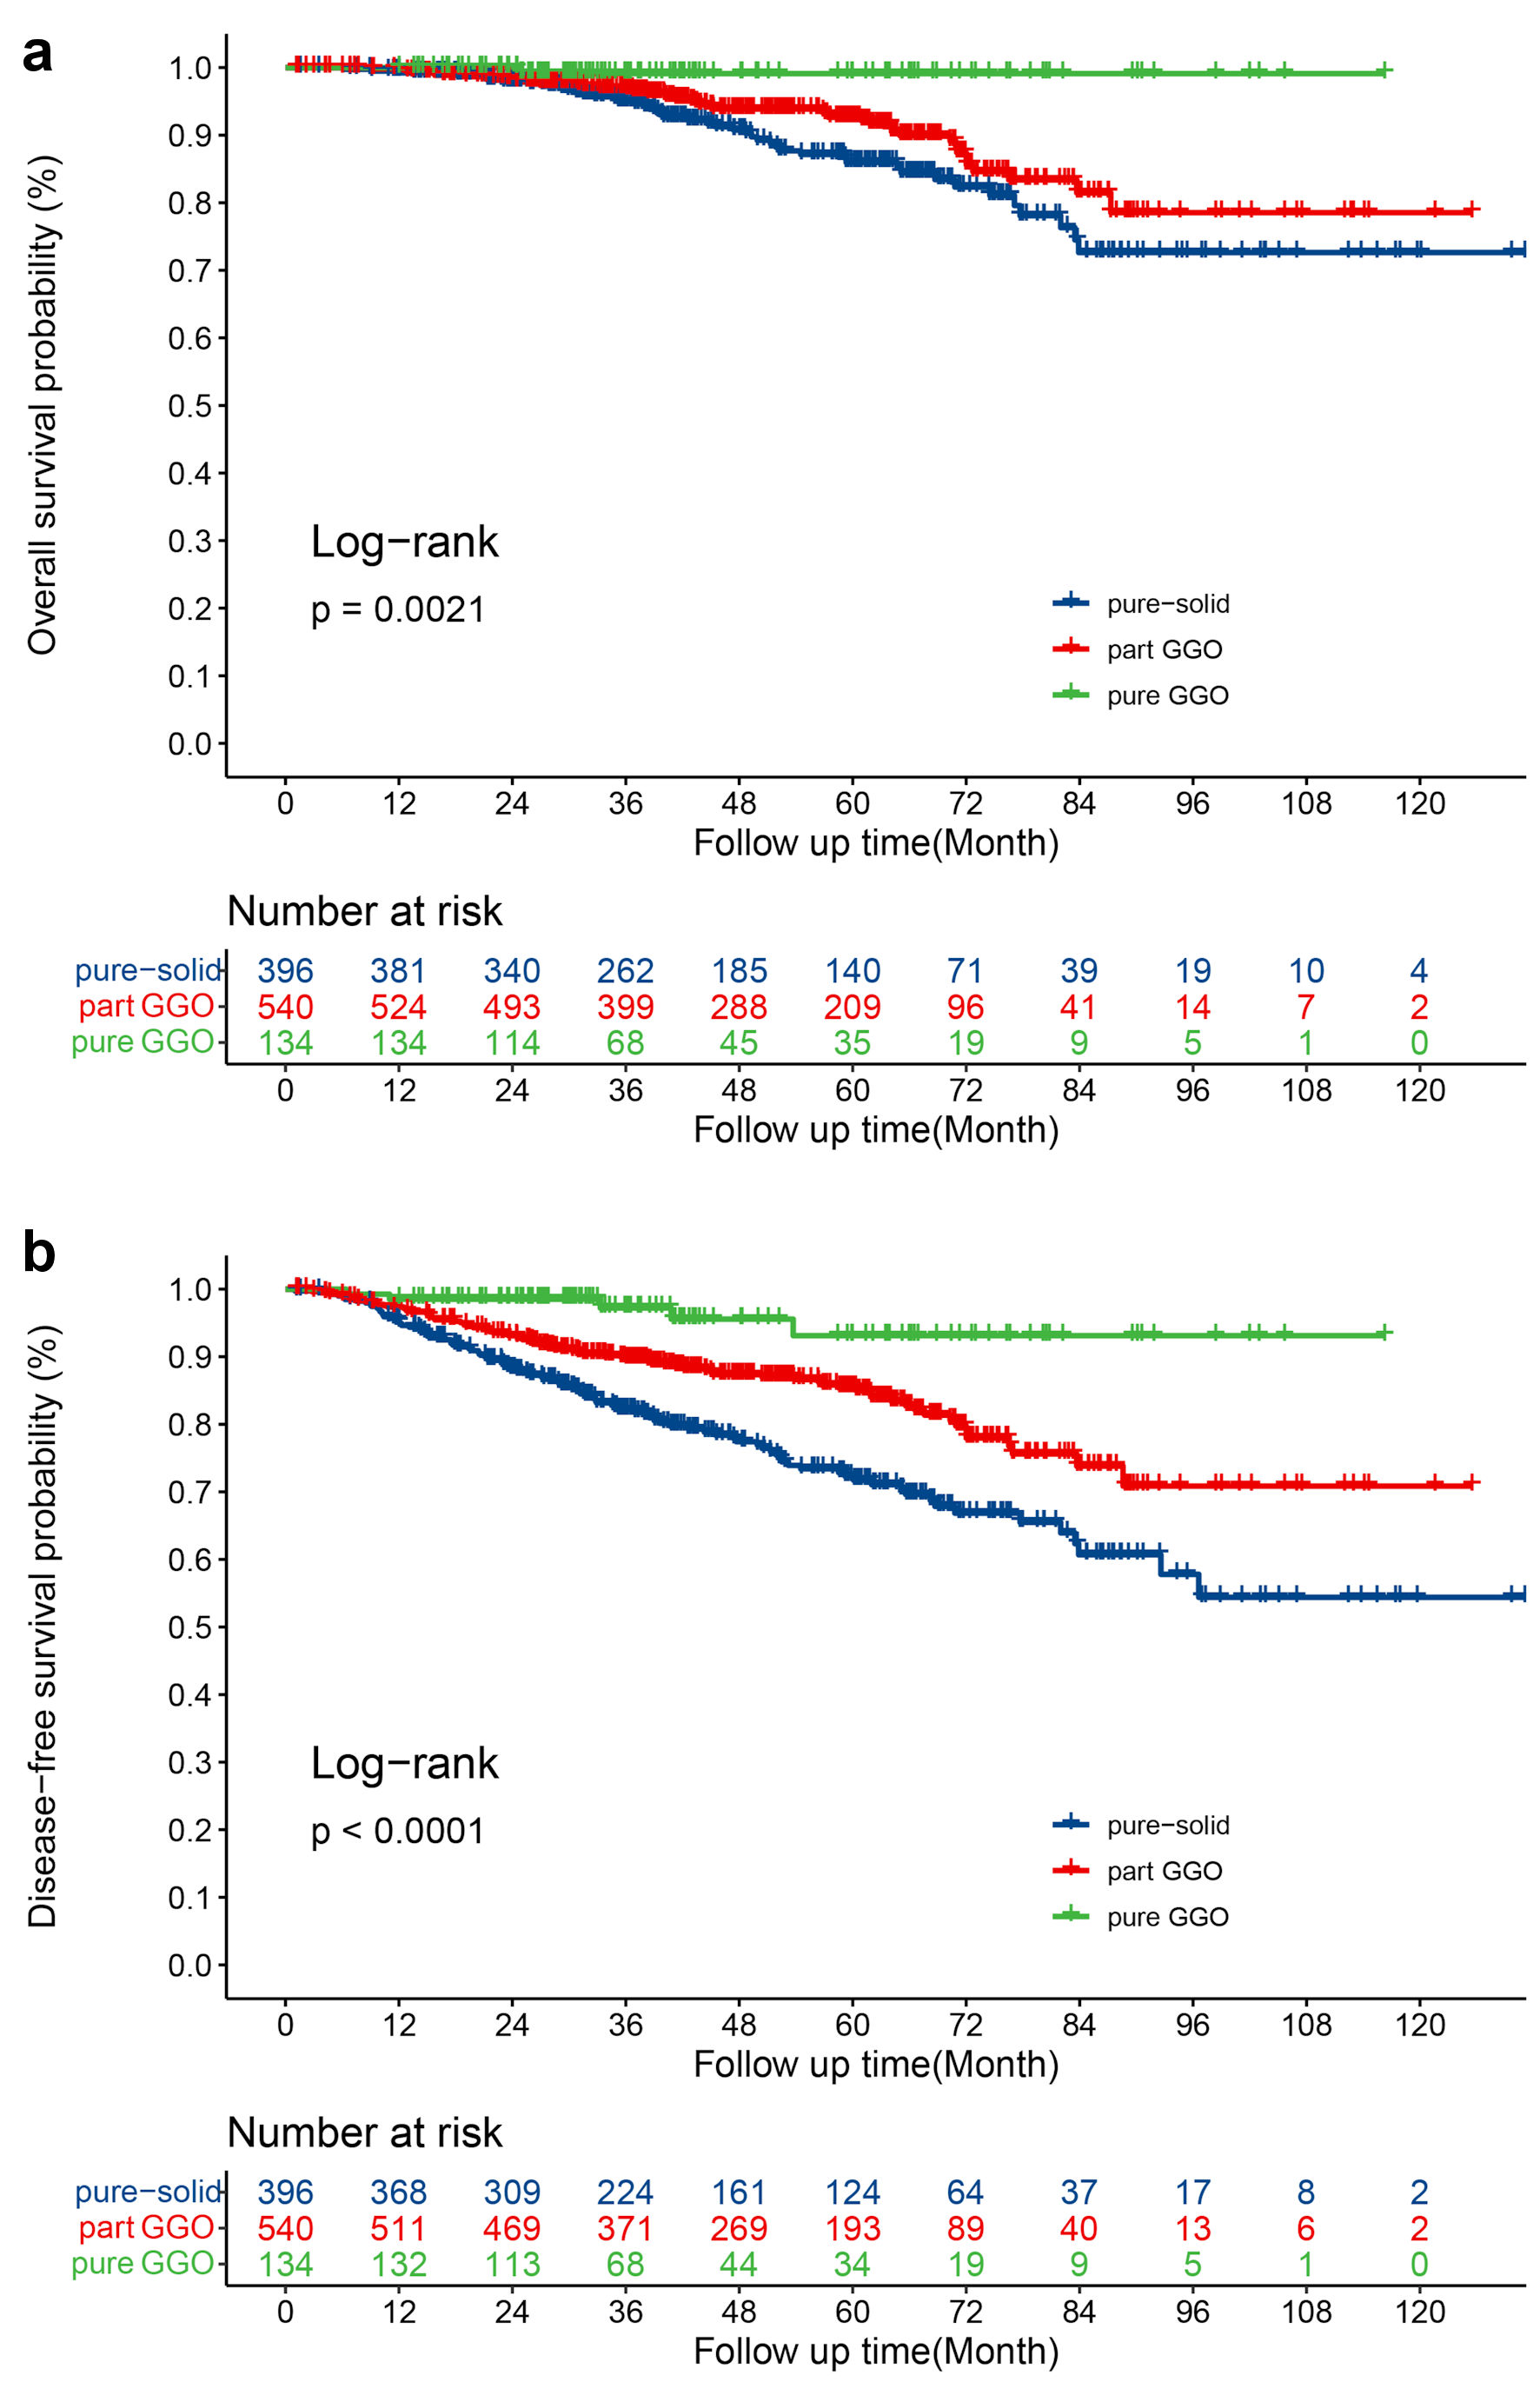
Figure 1. (a) OS for patients with pure-GGOs, part-GGOs and pure-solid nodules. (b) DFS for patients with pure-GGOs, part-GGOs and pure-solid nodules. OS: overall survival; DFS: disease-free survival; GGO: ground-glass opacity.
| World Journal of Oncology, ISSN 1920-4531 print, 1920-454X online, Open Access |
| Article copyright, the authors; Journal compilation copyright, World J Oncol and Elmer Press Inc |
| Journal website https://www.wjon.org |
Original Article
Volume 13, Number 5, October 2022, pages 259-271
Distinct Prognostic Factors of Ground Glass Opacity and Pure-Solid Lesion in Pathological Stage I Invasive Lung Adenocarcinoma
Figures
Tables
| Characteristics | Radiologic characteristic on CT | P value | P value | |||
|---|---|---|---|---|---|---|
| Pure-GGO (n = 134) | Part-GGO (n = 540) | Pure-solid (n = 396) | Overall (n = 1,070) | Part-solid vs. pure-solid | ||
| VATS: video-assisted thoracoscopic surgery; EGFR: epidermal growth factor receptor; ALK: anaplastic lymphoma kinase; CT: computed tomography; GGO: ground-glass opacity. aThe P value was calculated excluded the patients with unknown EGFR or ALK status. | ||||||
| Gender | 0.008 | 0.033 | ||||
| Male | 56 (41.8) | 266 (49.3) | 223 (56.3) | 545 (50.9) | ||
| Female | 78 (58.2) | 274 (50.7) | 173 (43.7) | 525 (49.1) | ||
| Age (year) | 56.5 ± 9.0 | 59.9 ± 9.1 | 61.0 ± 9.4 | 59.8 ± 9.3 | < 0.001 | 0.087 |
| Pathological tumor size (cm) | 1.4 ± 0.6 | 2.3 ± 0.8 | 2.3 ± 0.8 | 2.2 ± 0.8 | < 0.001 | 0.357 |
| Solid tumor size (cm) | 0 | 1.6 ± 1.0 | 2.2 ± 0.9 | 1.6 ± 1.0 | < 0.001 | < 0.001 |
| Smoking history | < 0.001 | 0.028 | ||||
| No | 107 (79.9) | 353 (65.4) | 231 (58.3) | 691 (64.6) | ||
| Yes or ever | 27 (20.1) | 187 (34.6) | 165 (41.7) | 379 (35.4) | ||
| 8th TNM stage | < 0.001 | < 0.001 | ||||
| IA | 115 (85.8) | 318 (58.9) | 187 (47.2) | 620 (57.9) | ||
| IB | 19 (14.2) | 222 (41.1) | 209 (52.8) | 450 (42.1) | ||
| Differentiation degree | < 0.001 | < 0.001 | ||||
| Well | 61 (45.5) | 52 (9.6) | 20 (5.1) | 133 (12.4) | ||
| Moderate | 67 (50.0) | 352 (65.2) | 226 (57.1) | 645 (60.3) | ||
| Poor | 6 (4.5) | 136 (25.2) | 150 (37.9) | 292 (27.3) | ||
| Visceral pleura invasion | < 0.001 | 0.009 | ||||
| Negative | 116 (86.6) | 383 (70.9) | 249 (62.9) | 748 (69.9) | ||
| Positive | 18 (13.4) | 157 (29.1) | 147 (37.1) | 322 (30.1) | ||
| Vascular invasion | 0.028 | 0.579 | ||||
| Negative | 133 (99.3) | 508 (94.1) | 369 (93.2) | 1,010 (94.4) | ||
| Positive | 1 (0.7) | 32 (5.9) | 27 (6.8) | 60 (5.6) | ||
| Number of N2 station examined | 2.7 ± 1.5 | 3.2 ± 1.4 | 3.2 ± 1.4 | 3.2 ± 1.4 | < 0.001 | 0.938 |
| Number of N1 station examined | 2.8 ± 1.2 | 2.7 ± 1.2 | 2.7 ± 1.2 | 2.7 ± 1.2 | 0.442 | 0.568 |
| Surgical approach | < 0.001 | 0.022 | ||||
| Sublobectomy | 23 (17.2) | 36 (6.7) | 13 (3.3) | 72 (6.7) | ||
| Lobectomy and others | 111 (82.8) | 504 (93.3) | 383 (96.7) | 998 (93.3) | ||
| Thoracotomy or VATS | < 0.001 | 0.608 | ||||
| Thoracotomy | 31 (23.1) | 216 (40.0) | 165 (41.7) | 412 (38.5) | ||
| VATS | 103 (76.9) | 324 (60.0) | 231 (58.3) | 658 (61.5) | ||
| EGFR gene mutation | 0.222a | 0.084a | ||||
| Negative | 34 (25.4) | 158 (29.3) | 131 (33.1) | 323 (30.2) | ||
| Positive | 47 (35.1) | 236 (43.7) | 149 (37.6) | 432 (40.4) | ||
| Unknown | 53 (39.6) | 146 (27.0) | 116 (29.3) | 315 (29.4) | ||
| ALK rearrangement | 0.755a | 0.955a | ||||
| Negative | 73 (54.5) | 317 (58.7) | 229 (57.8) | 619 (57.9) | ||
| Positive | 1 (0.7) | 10 (1.9) | 7 (1.8) | 18 (1.7) | ||
| Unknown | 60 (44.8) | 213 (39.4) | 160 (40.4) | 433 (40.5) | ||
| Factors | Univariate analysis | LASSO analysis | Multivariate analysis | |
|---|---|---|---|---|
| P value | Coefficient | HR (95% CI) | P value | |
| LASSO: the least absolute shrinkage and selection operator; HR: hazard ratio; CI: confidence interval; OS: overall survival; DFS: disease-free survival; VATS: video-assisted thoracoscopic surgery; GGO: ground-glass opacity. | ||||
| Analysis of OS | ||||
| Gender | < 0.001 | -0.463 | 0.509 (0.327 - 0.793) | 0.003 |
| Age (year) | < 0.001 | 0.038 | 1.042 (1.017 - 1.067) | 0.001 |
| Pathological tumor size (cm) | 0.008 | 0.17 | 1.207 (0.923 - 1.580) | 0.179 |
| Smoking history | 0.001 | 0.144 | 1.165 (0.670 - 2.028) | 0.588 |
| 8th TNM stage (IA versus IB) | 0.017 | |||
| Differentiation degree | 0.289 | |||
| Well | Reference | Reference | ||
| Moderate | 0.594 | 0.950 (0.436 - 2.069) | 0.897 | |
| Poor | 0.021 | 1.538 (0.697 - 3.395) | 0.287 | |
| Visceral pleura invasion | 0.011 | 0.465 | 1.748 (1.153 - 2.652) | 0.009 |
| Vascular invasion | 0.301 | |||
| Operative approach | 0.256 | |||
| Number of N2 stations examined | 0.045 | -0.083 | 0.905 (0.776 - 1.057) | 0.207 |
| Number of N1 stations examined | < 0.001 | -0.145 | 0.851 (0.709 - 1.021) | 0.083 |
| Presence of GGO component | -0.334 | |||
| Pure - solid | Reference | Reference | ||
| Part GGO | 0.053 | 0.753 (0.495 - 1.146) | 0.185 | |
| Pure GGO | 0.023 | 0.114 (0.016 - 0.834) | 0.032 | |
| Thoracotomy or VATS | 0.785 | |||
| Analysis of DFS | ||||
| Gender | 0.001 | -0.321 | 0.664 (0.493 - 0.894) | 0.007 |
| Age (year) | 0.185 | |||
| Pathological tumor size (cm) | < 0.001 | 0.332 | 1.451 (1.205 - 1.747) | < 0.001 |
| Smoking history | 0.003 | 0.026 | 1.035 (0.694 - 1.543) | 0.866 |
| 8th TNM stage (IA versus IB) | < 0.001 | 0.782 (0.437 - 1.398) | 0.406 | |
| Differentiation degree | 0.132 | |||
| Well | Reference | Reference | ||
| Moderate | 0.078 | 1.177 (0.645 - 2.145) | 0.595 | |
| Poor | 0.002 | 1.359 (0.724 - 2.551) | 0.339 | |
| Visceral pleura invasion | < 0.001 | 0.495 | 1.698 (1.265 - 2.279) | < 0.001 |
| Vascular invasion | 0.043 | 0.339 | 1.543 (0.890 - 2.677) | 0.122 |
| Operative approach | 0.371 | |||
| Number of N2 stations examined | 0.209 | |||
| Number of N1 stations examined | 0.008 | -0.147 | 0.844 (0.742 - 0.960) | 0.010 |
| Presence of GGO component | -0.481 | |||
| Pure - solid | Reference | Reference | ||
| Part GGO | < 0.001 | 0.605 (0.449 - 0.815) | 0.001 | |
| Pure GGO | < 0.001 | 0.252 (0.101 - 0.629) | 0.003 | |
| Thoracotomy or VATS | 0.381 | |||
| Factors | Univariate analysis | LASSO analysis | Multivariate analysis | |
|---|---|---|---|---|
| P value | Coefficient | HR (95% CI) | P value | |
| LASSO: the least absolute shrinkage and selection operator; HR: hazard ratio; CI: confidence interval; CTR: consolidation-tumor-ratio; OS: overall survival; DFS: disease-free survival; VATS: video-assisted thoracoscopic surgery; GGO: ground-glass opacity. | ||||
| Analysis of OS | ||||
| Gender | 0.001 | -1.021 | 0.329 (0.170 - 0.635) | 0.001 |
| Age (year) | 0.391 | |||
| Solid tumor size (cm) | < 0.001 | 0.042 | 1.138 (0.711 - 1.820) | 0.590 |
| Smoking history | 0.008 | 0.013 | 1.052 (0.497 - 2.226) | 0.894 |
| 8th TNM stage (IA versus IB) | 0.011 | 0.073 | 1.131 (0.383 - 3.341) | 0.823 |
| Differentiation degree | ||||
| Well | Reference | |||
| Moderate | 0.537 | |||
| Poor | 0.320 | |||
| Visceral pleura invasion | 0.013 | 0.495 | 1.894 (1.029 - 3.485) | 0.040 |
| Vascular invasion | 0.272 | |||
| Operative approach | 0.988 | |||
| Number of N2 stations examined | 0.169 | |||
| Number of N1 stations examined | 0.054 | |||
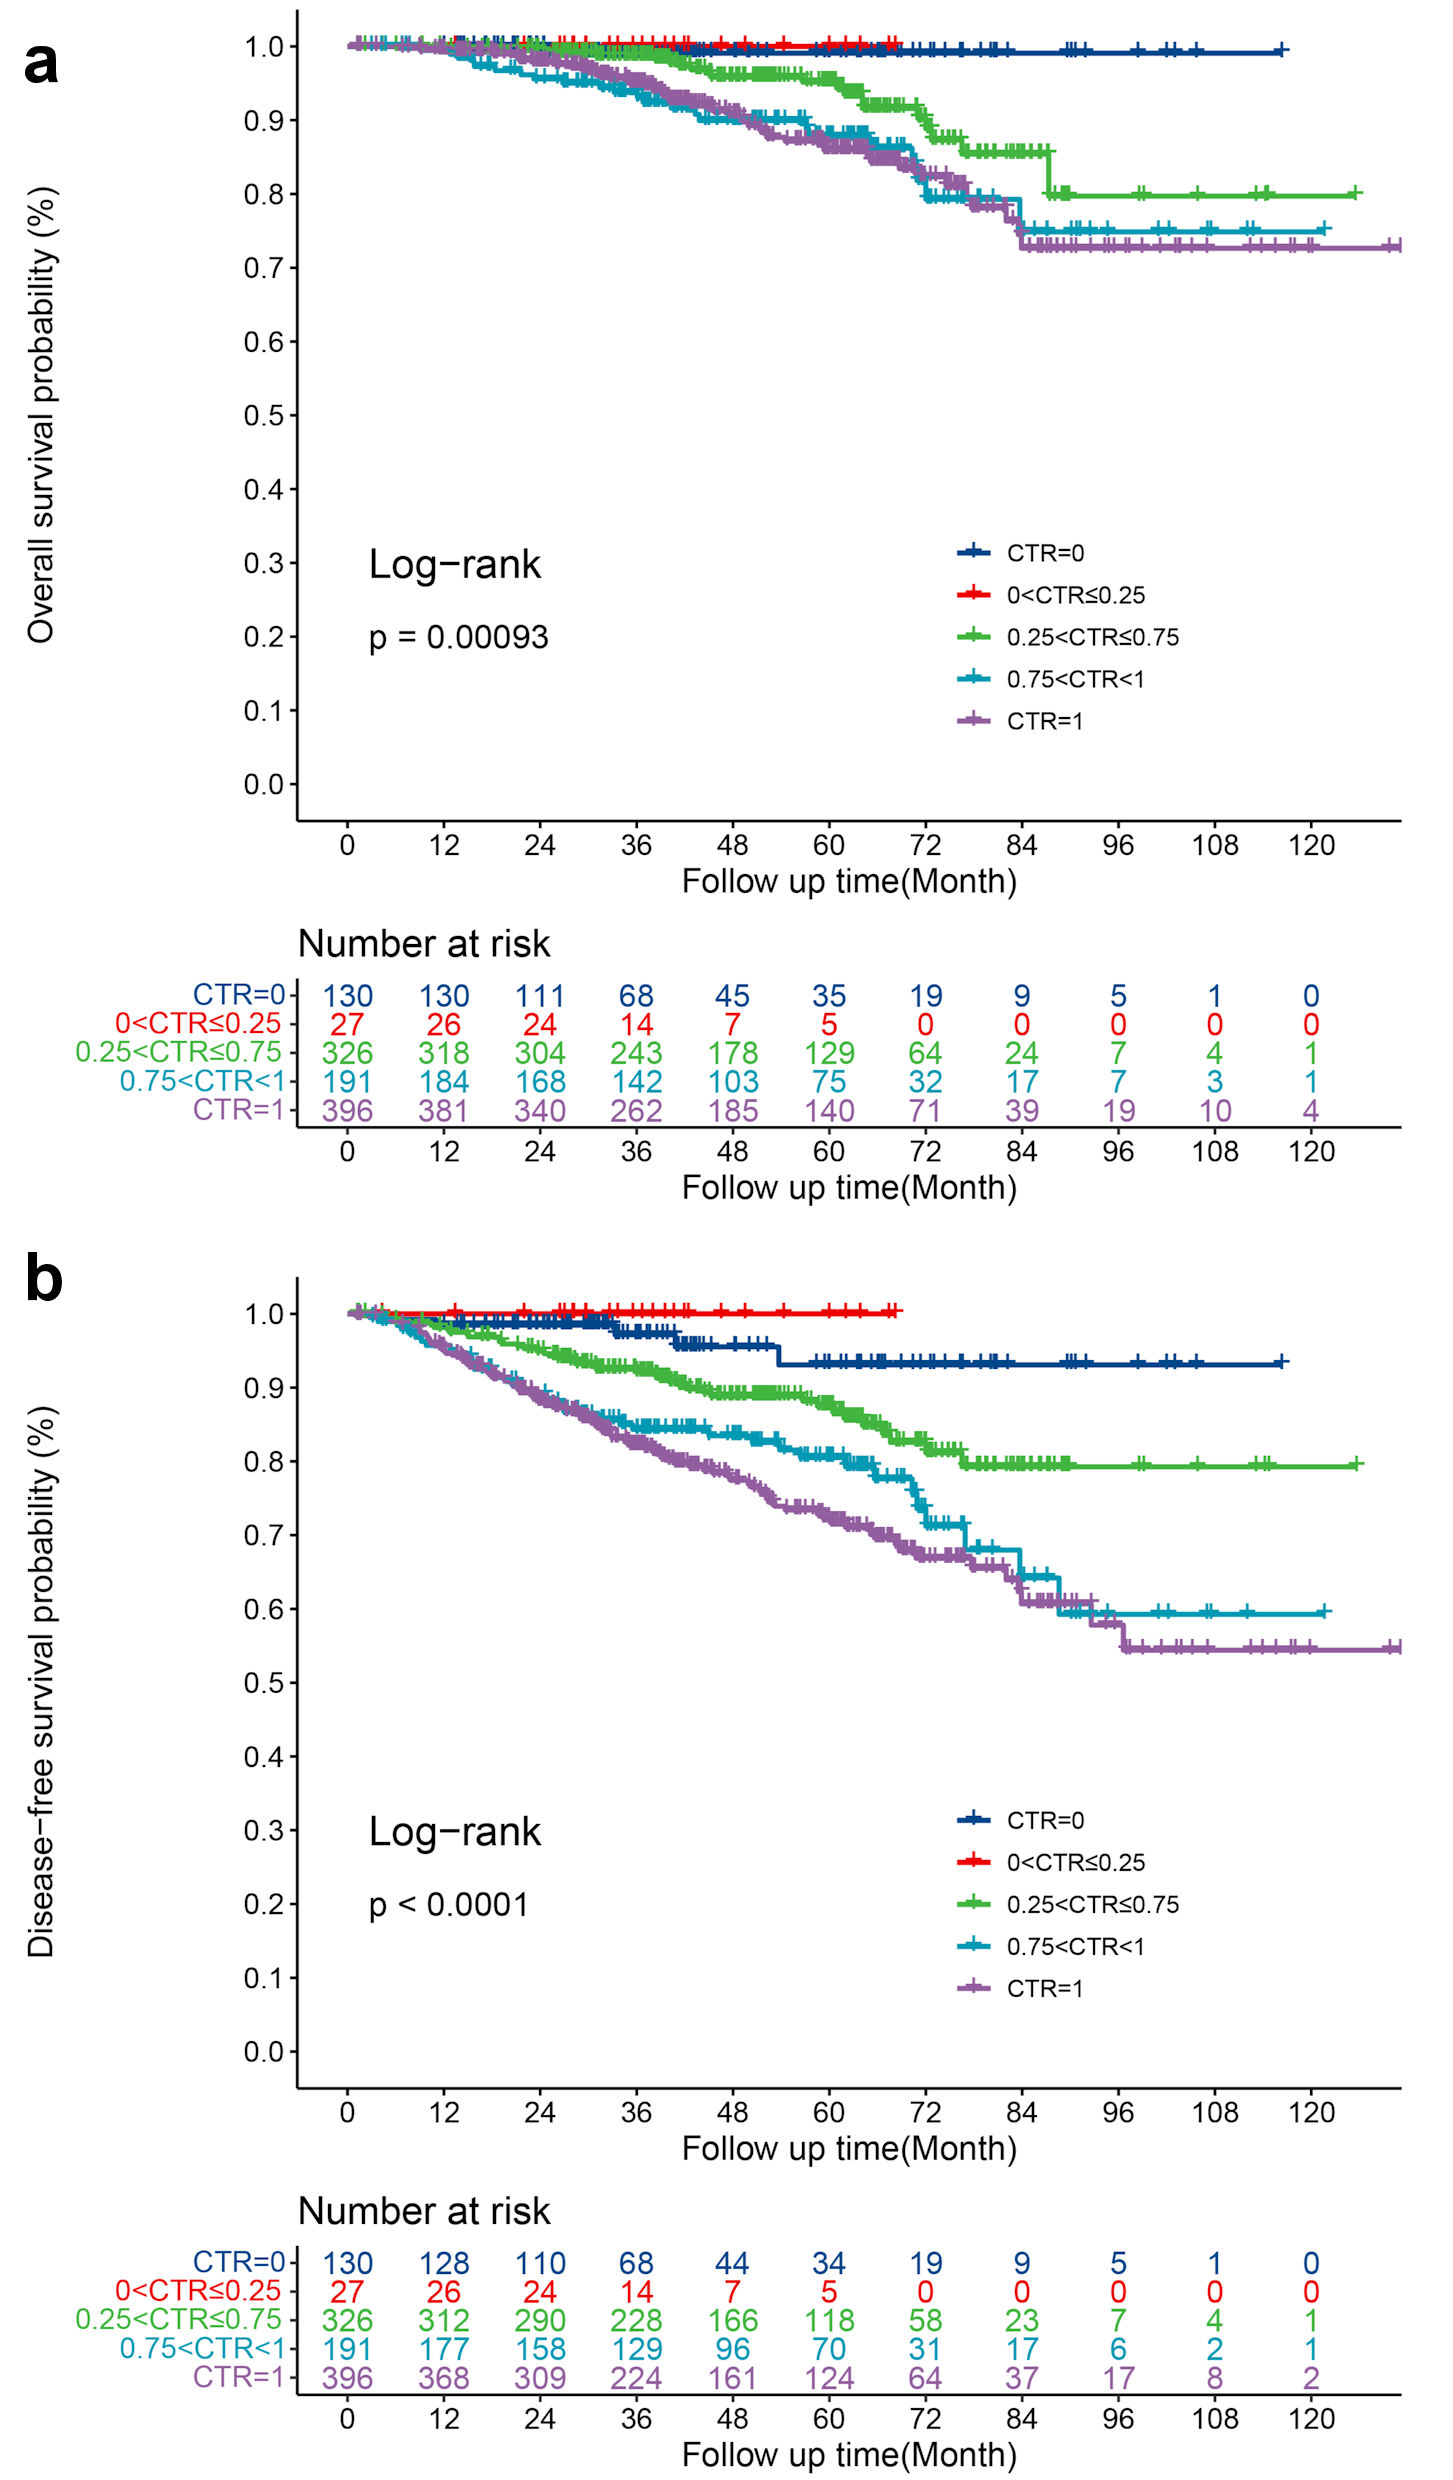
| CTR | 0.001 | 3.081 | 1.401 (1.096 – 1.792) | 0.007 |
| Thoracotomy or VATS | 0.387 | |||
| Analysis of DFS | ||||
| Gender | < 0.001 | -0.896 | 0.381 (0.236 – 0.613) | < 0.001 |
| Age (year) | 0.477 | |||
| Solid tumor size (cm) | < 0.001 | 0.357 | 1.773 (1.372 - 2.290) | < 0.001 |
| Smoking history | 0.005 | |||
| 8th TNM stage (IA versus IB) | < 0.001 | |||
| Differentiation degree | ||||
| Well | Reference | |||
| Moderate | 0.964 | |||
| Poor | 0.135 | |||
| Visceral pleura invasion | < 0.001 | 0.645 | 2.022 (1.296 - 3.154) | 0.002 |
| Vascular invasion | 0.049 | 0.573 | 1.935 (0.930 - 4.028) | 0.078 |
| Operative approach | 0.515 | |||
| Number of N2 stations examined | 0.428 | |||
| Number of N1 stations examined | 0.495 | |||
| CTR | < 0.001 | 1.051 | 2.530 (0.261 - 24.481) | 0.493 |
| Thoracotomy or VATS | 0.760 | |||
| Factors | Univariate analysis | LASSO analysis | Multivariate analysis | |
|---|---|---|---|---|
| P value | Coefficient | HR (95% CI) | P value | |
| LASSO: the least absolute shrinkage and selection operator; HR: hazard ratio; CI: confidence interval; CTR: consolidation-tumor-ratio; OS: overall survival; DFS: disease-free survival; VATS: video-assisted thoracoscopic surgery. | ||||
| Analysis of OS | ||||
| Gender | 0.675 | |||
| Age (year) | < 0.001 | 0.068 | 1.073 (1.035 - 1.112) | < 0.001 |
| Pathological tumor size (cm) | 0.800 | |||
| Smoking history | 0.117 | |||
| 8th TNM stage (IA versus IB) | 0.906 | |||
| Differentiation degree | ||||
| Well | Reference | |||
| Moderate | 0.822 | |||
| Poor | 0.640 | |||
| Visceral pleura invasion | 0.518 | |||
| Vascular invasion | 0.929 | |||
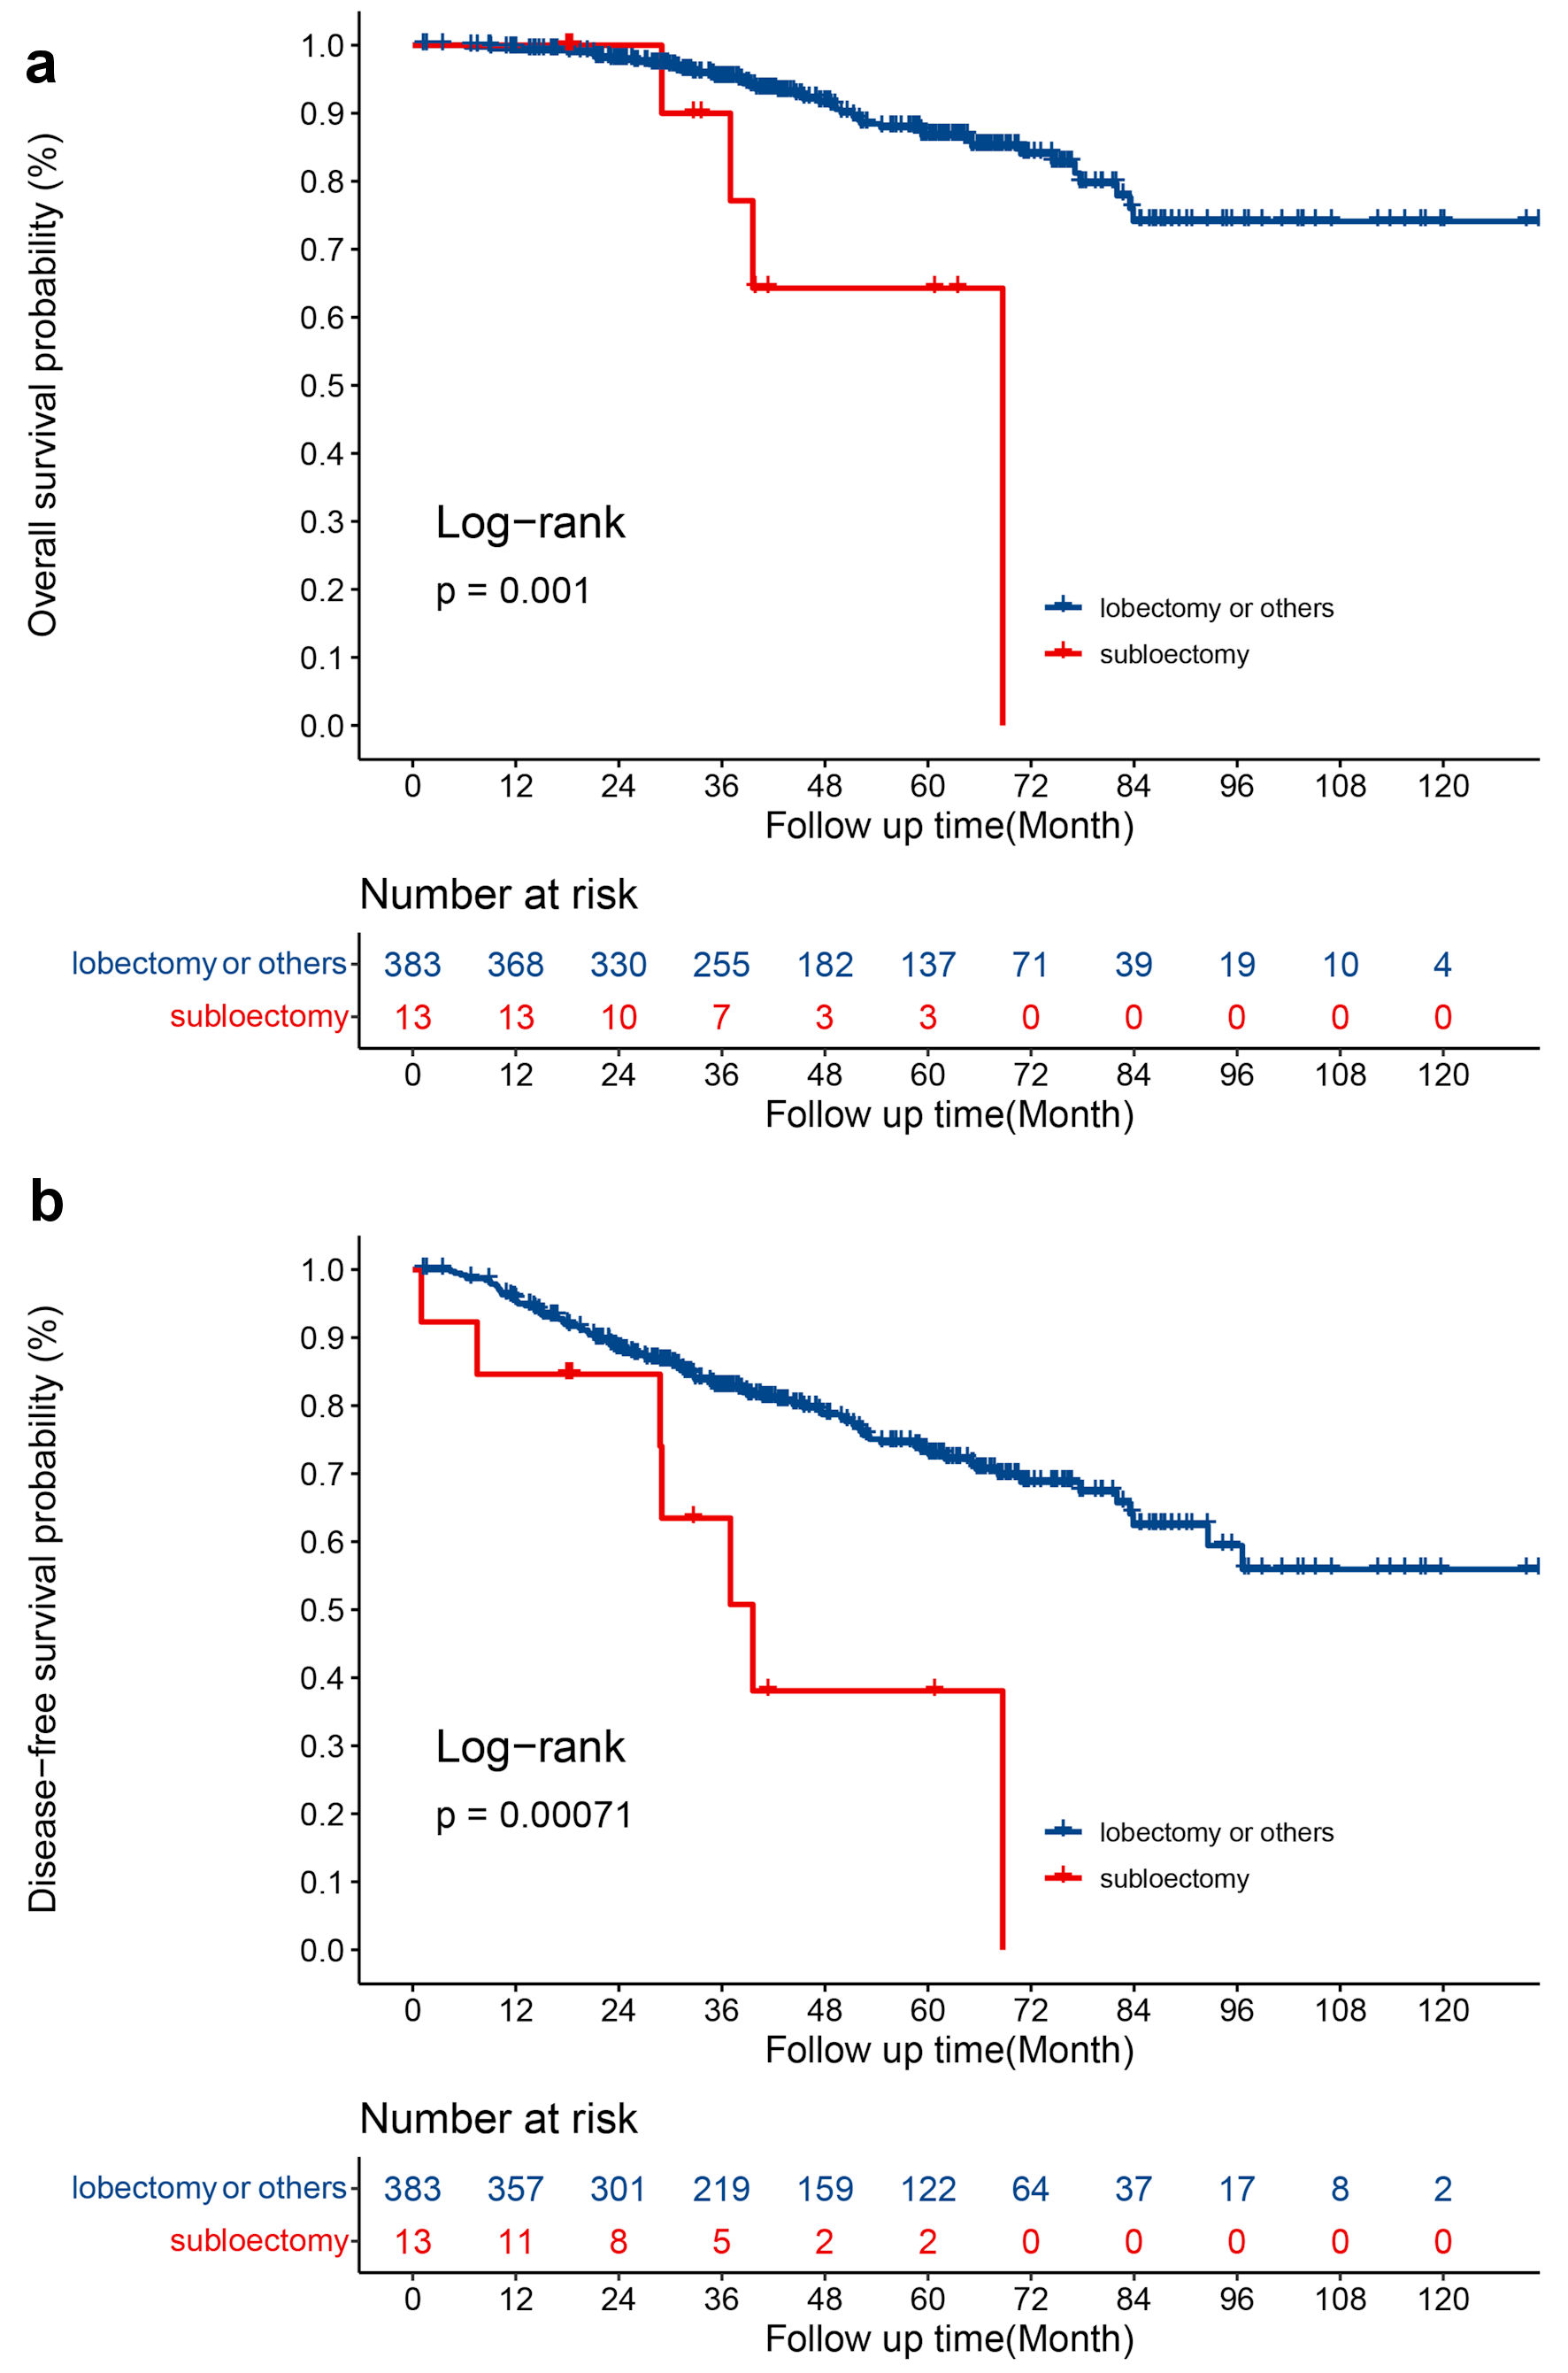
| Operative approach | 0.003 | 1.382 | 4.118 (1.455 - 11.657) | 0.008 |
| Number of N2 stations examined | 0.108 | |||
| Number of N1 stations examined | 0.184 | |||
| Thoracotomy or VATS | 0.385 | |||
| Analysis of DFS | ||||
| Gender | 0.535 | |||
| Age (year) | 0.164 | |||
| Pathological tumor size (cm) | 0.024 | 0.312 | 1.377 (1.074 - 1.766) | 0.012 |
| Smoking history | 0.949 | |||
| 8th TNM stage (IA versus IB) | 0.121 | |||
| Differentiation degree | ||||
| Well | Reference | |||
| Moderate | 0.909 | |||
| Poor | 0.735 | |||
| Visceral pleura invasion | 0.065 | |||
| Vascular invasion | 0.649 | |||
| Operative approach | 0.002 | 1.104 | 3.150 (1.401 - 7.081) | 0.005 |
| Number of N2 stations examined | 0.258 | |||
| Number of N1 stations examined | 0.004 | -0.175 | 0.517 (0.317 - 0.842) | 0.008 |
| Thoracotomy or VATS | 0.744 | |||