Figures
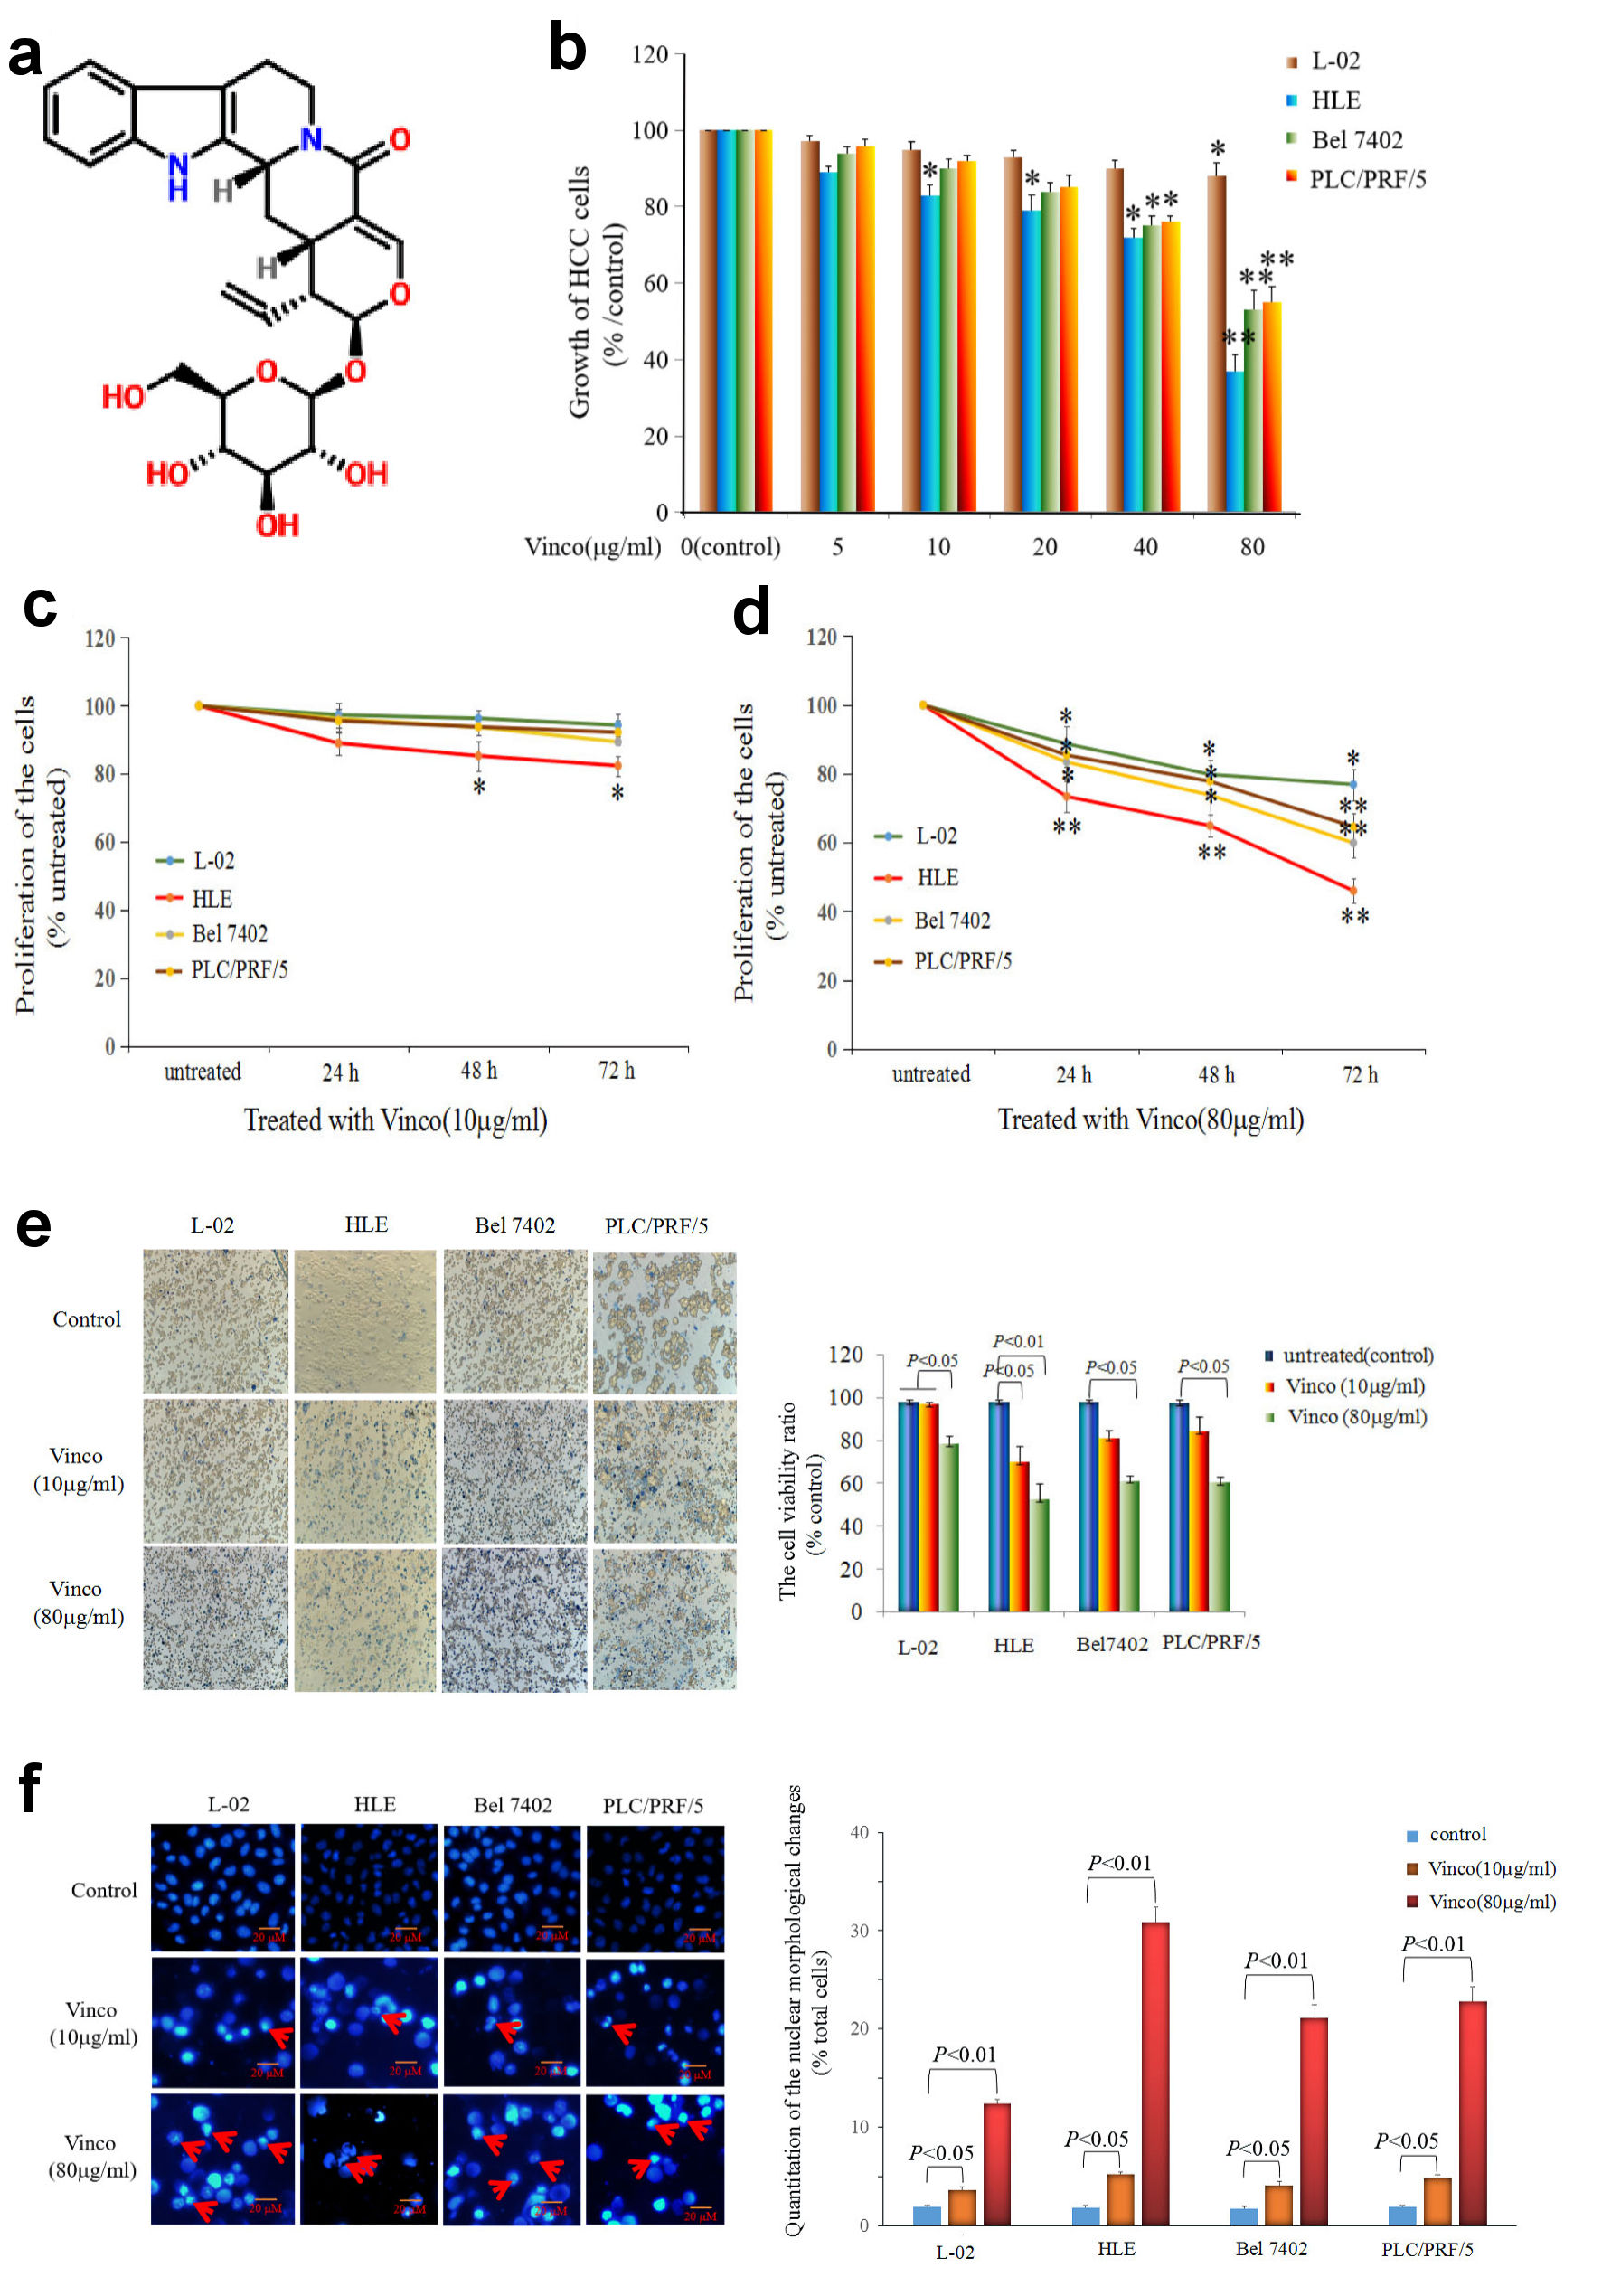
Figure 1. Influence of Vinco on the growth and viability of the normal liver cell line L-02 and the HCC cell lines HLE, Bel 7402, and PLC/PRF/5. (a) Molecular structure of Vinco (element components: C26H30N2O8; molecular weight: 498.532 Da). (b) L-02 cells and the HCC cell lines HLE, Bel 7402, and PLC/PRF/5 were treated with different concentrations (5 µg/mL, 10 µg/mL, 20 µg/mL, 40 µg/mL or 80 µg/mL) of Vinco for 48 h. The MTT assay was applied to detect the growth of the cells. *P < 0.05, and **P < 0.01 vs. the control groups (0 µg/mL) (n = 6). (c, d) L-02, HLE, Bel 7402, and PLC/PRF/5 cells were treated with different concentrations (10 µg/mL or 80 µg/mL) of Vinco for 24 h, 48 h, 72 h, respectively, and CCK-8 assay was applied to detect the proliferation of the cells, *P < 0.05 and **P < 0.01 (n = 6). (e) L-02, HLE, Bel 7402, and PLC/PRF/5 cells were treated with different concentrations (10 µg/mL or 80 µg/mL) of Vinco for 48 h, the trypan blue exclusion dye assay was used to analyze the viability of these cells, the bar graphs on the right show a quantitative of viability cells, P < 0.05 indicating statistical significance. (f) The nuclei of these cells were stained with DAPI and observed by fluorescence microscopy, the bar graphs on the right show a quantitative assessment of the frequency of nuclear morphological changes, P < 0.05 indicating statistical significance. The red arrows indicate cellular nucleus condensation and pyknosis. The images are representative of at least three independent experiments. Vinco: vincosamide; HCC: hepatocellular carcinoma; MTT: 3-(4, 5-dimethylthiazol-2-yl)-2, 5-diphenyl-tetrazolium bromide; CCK: Cell Counting Kit; DAPI: 4’,6-diamidino-2-phenylindole dihydrochloride.
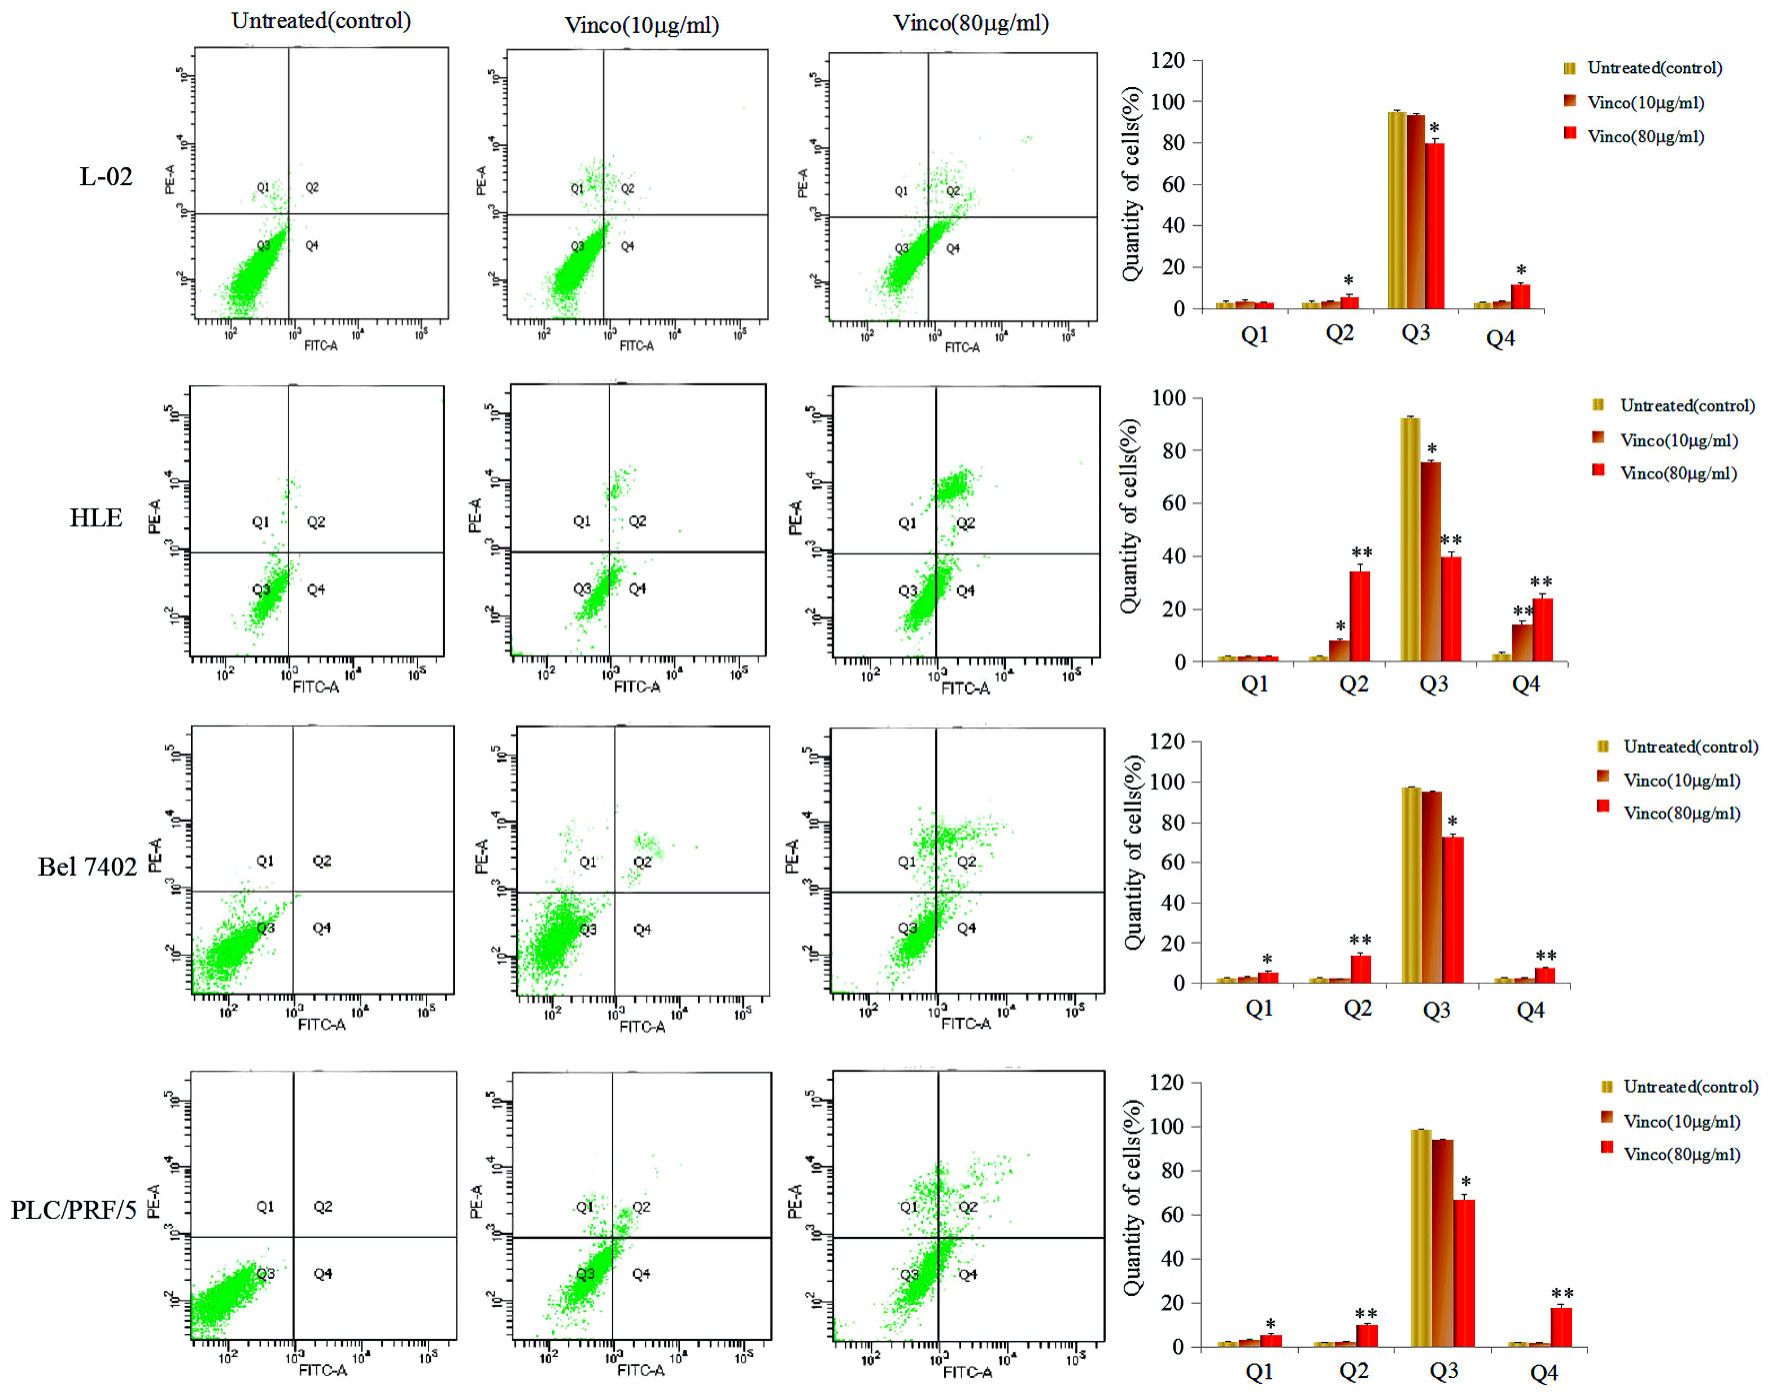
Figure 2. Effects of Vinco in the apoptosis of human normal liver cell line and HCC cells lines. L-02, HLE, Bel 7402, and PLC/PRF/5 were treated with 10 µg/mL or 80 µg/mL Vinco for 48 h. Apoptosis of these HCC cells were analyzed by flow cytometry. The right column picture depicts the statistical analysis of the apoptosis ratio. *P < 0.05 and **P < 0.01 vs. untreated (control). The images were representative of at least three independent experiments. Vinco: vincosamide; HCC: hepatocellular carcinoma
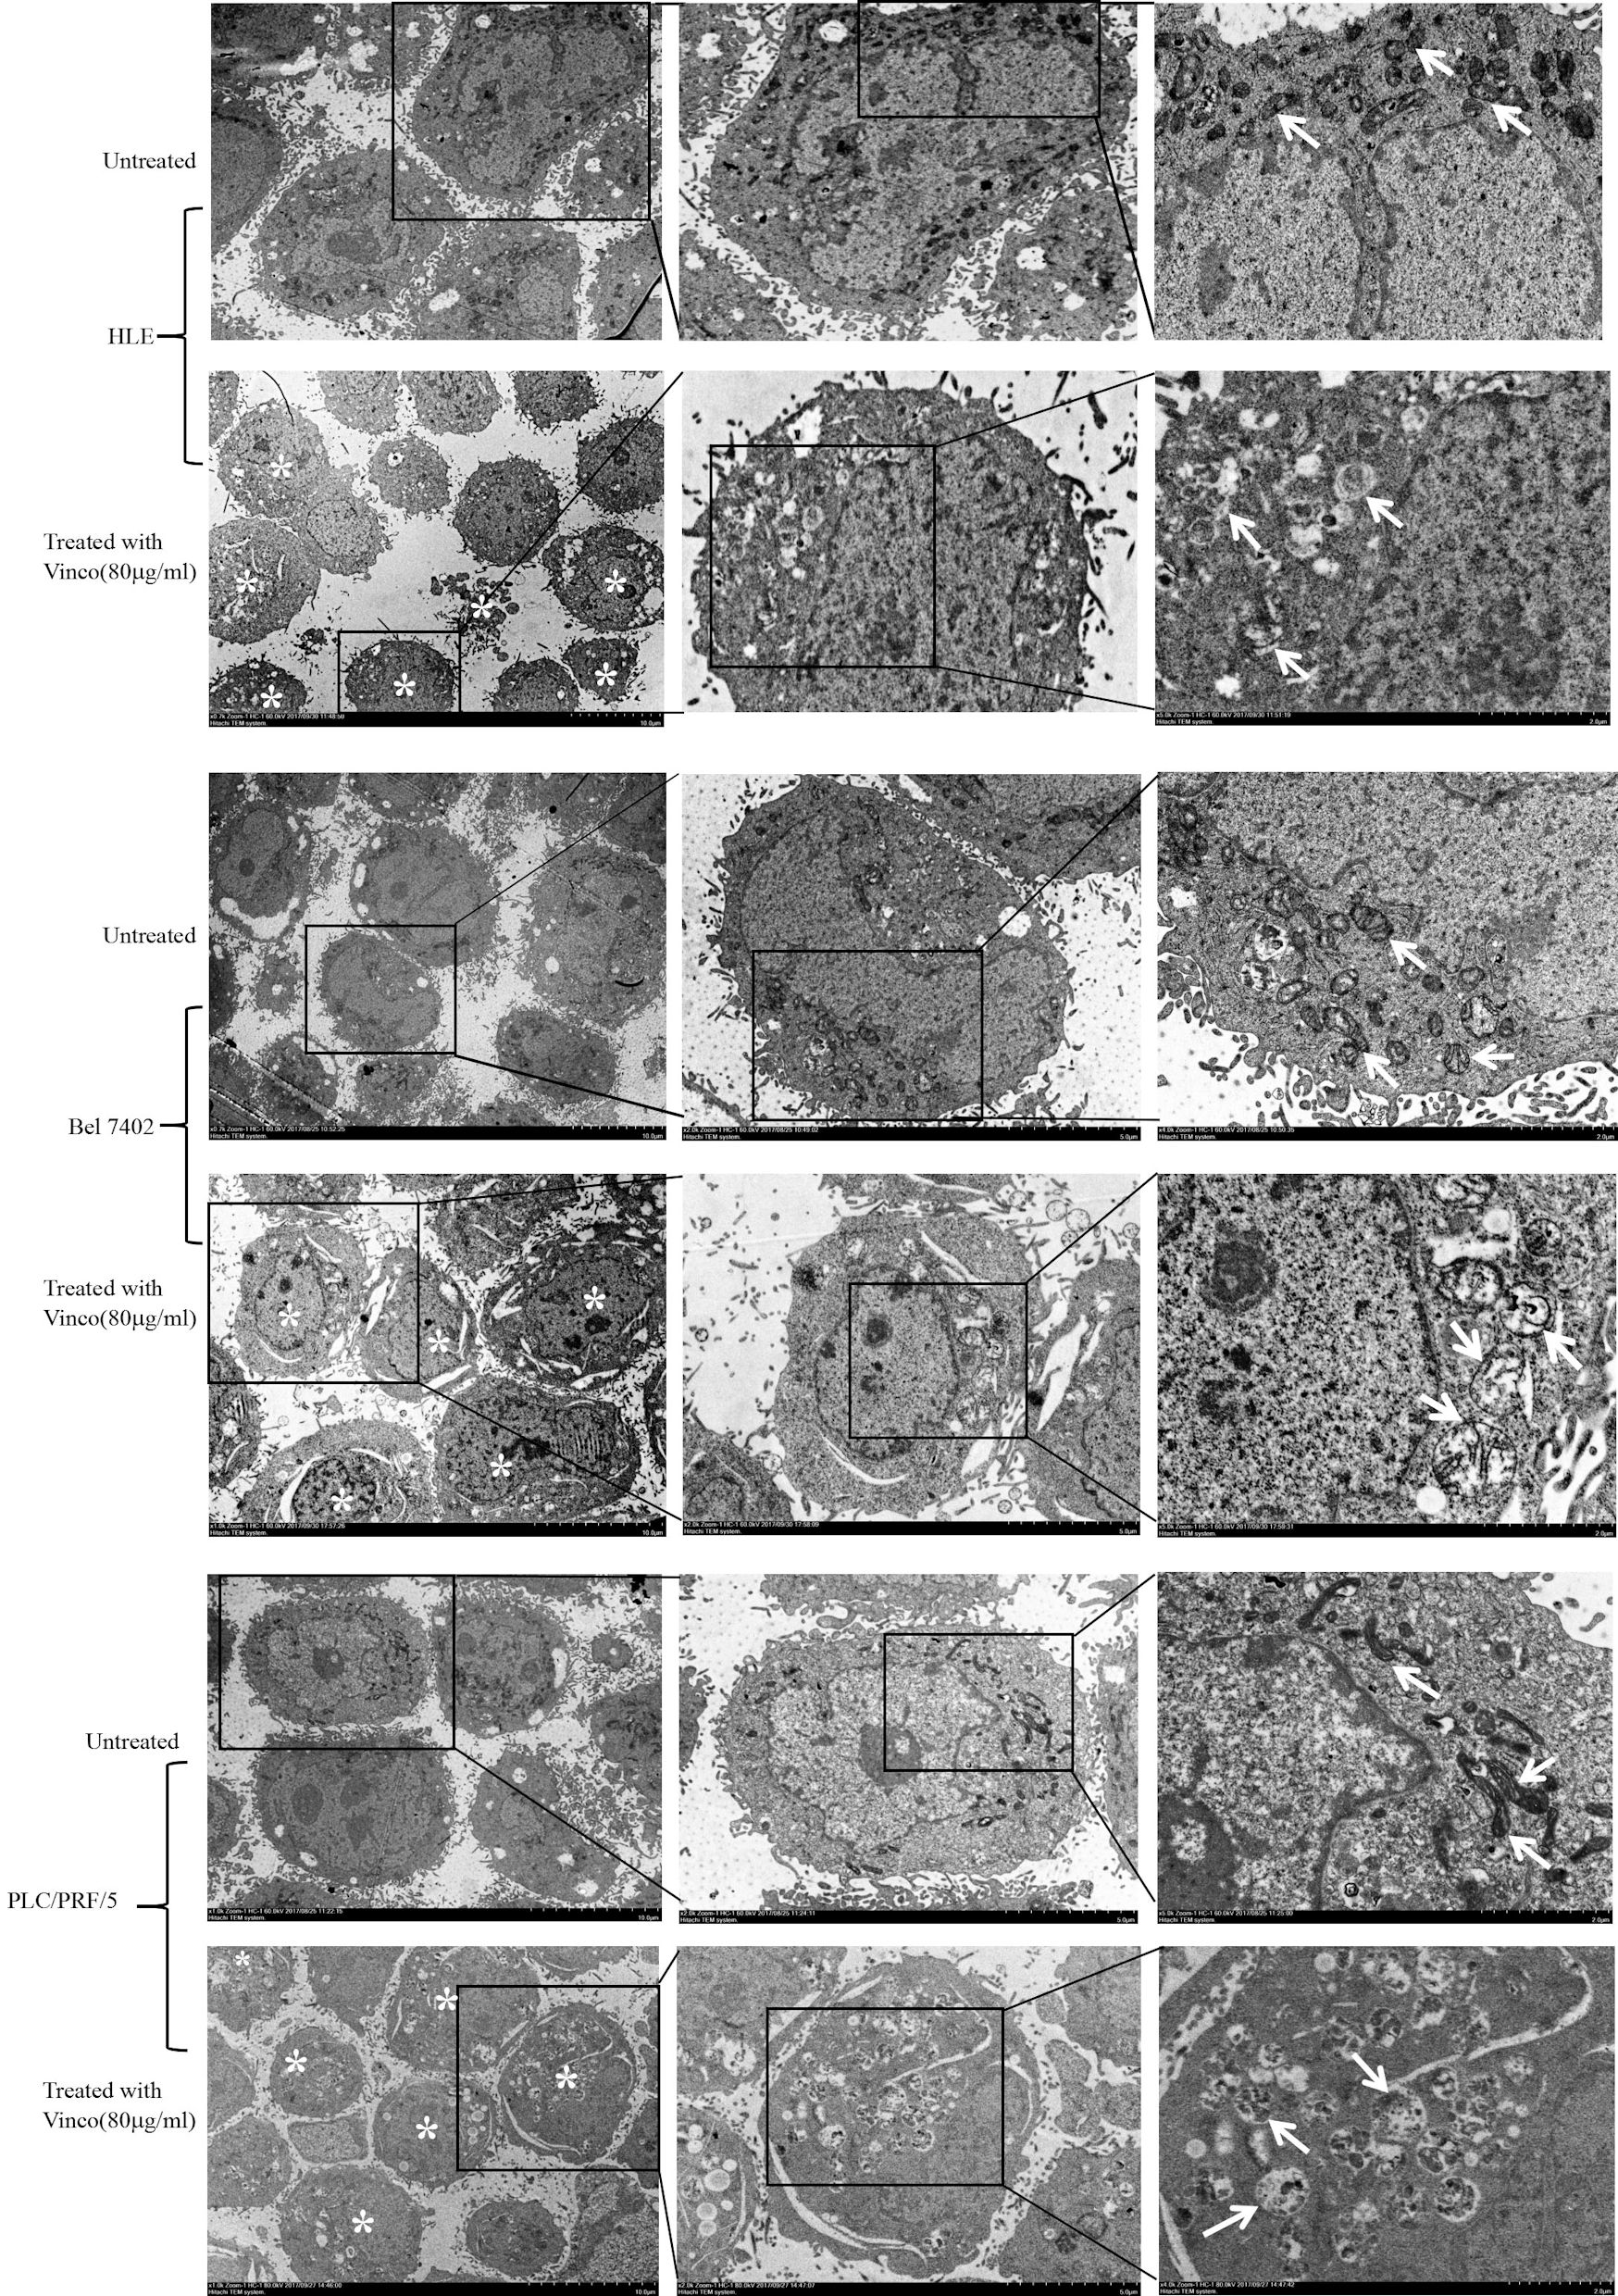
Figure 3. Effects of Vinco on mitochondrial morphology in HLE, Bel 7402, and PLC/PRF/5 cells. HCC cells were treated with Vinco (80 µg/m>) for 12 h, and changes in the morphology of mitochondria in the cells were observed by electron microscopy. *Indicates death cells, and the white arrows indicate mitochondria. The images are representative of three independent experiments. Vinco: vincosamide; HCC: hepatocellular carcinoma.
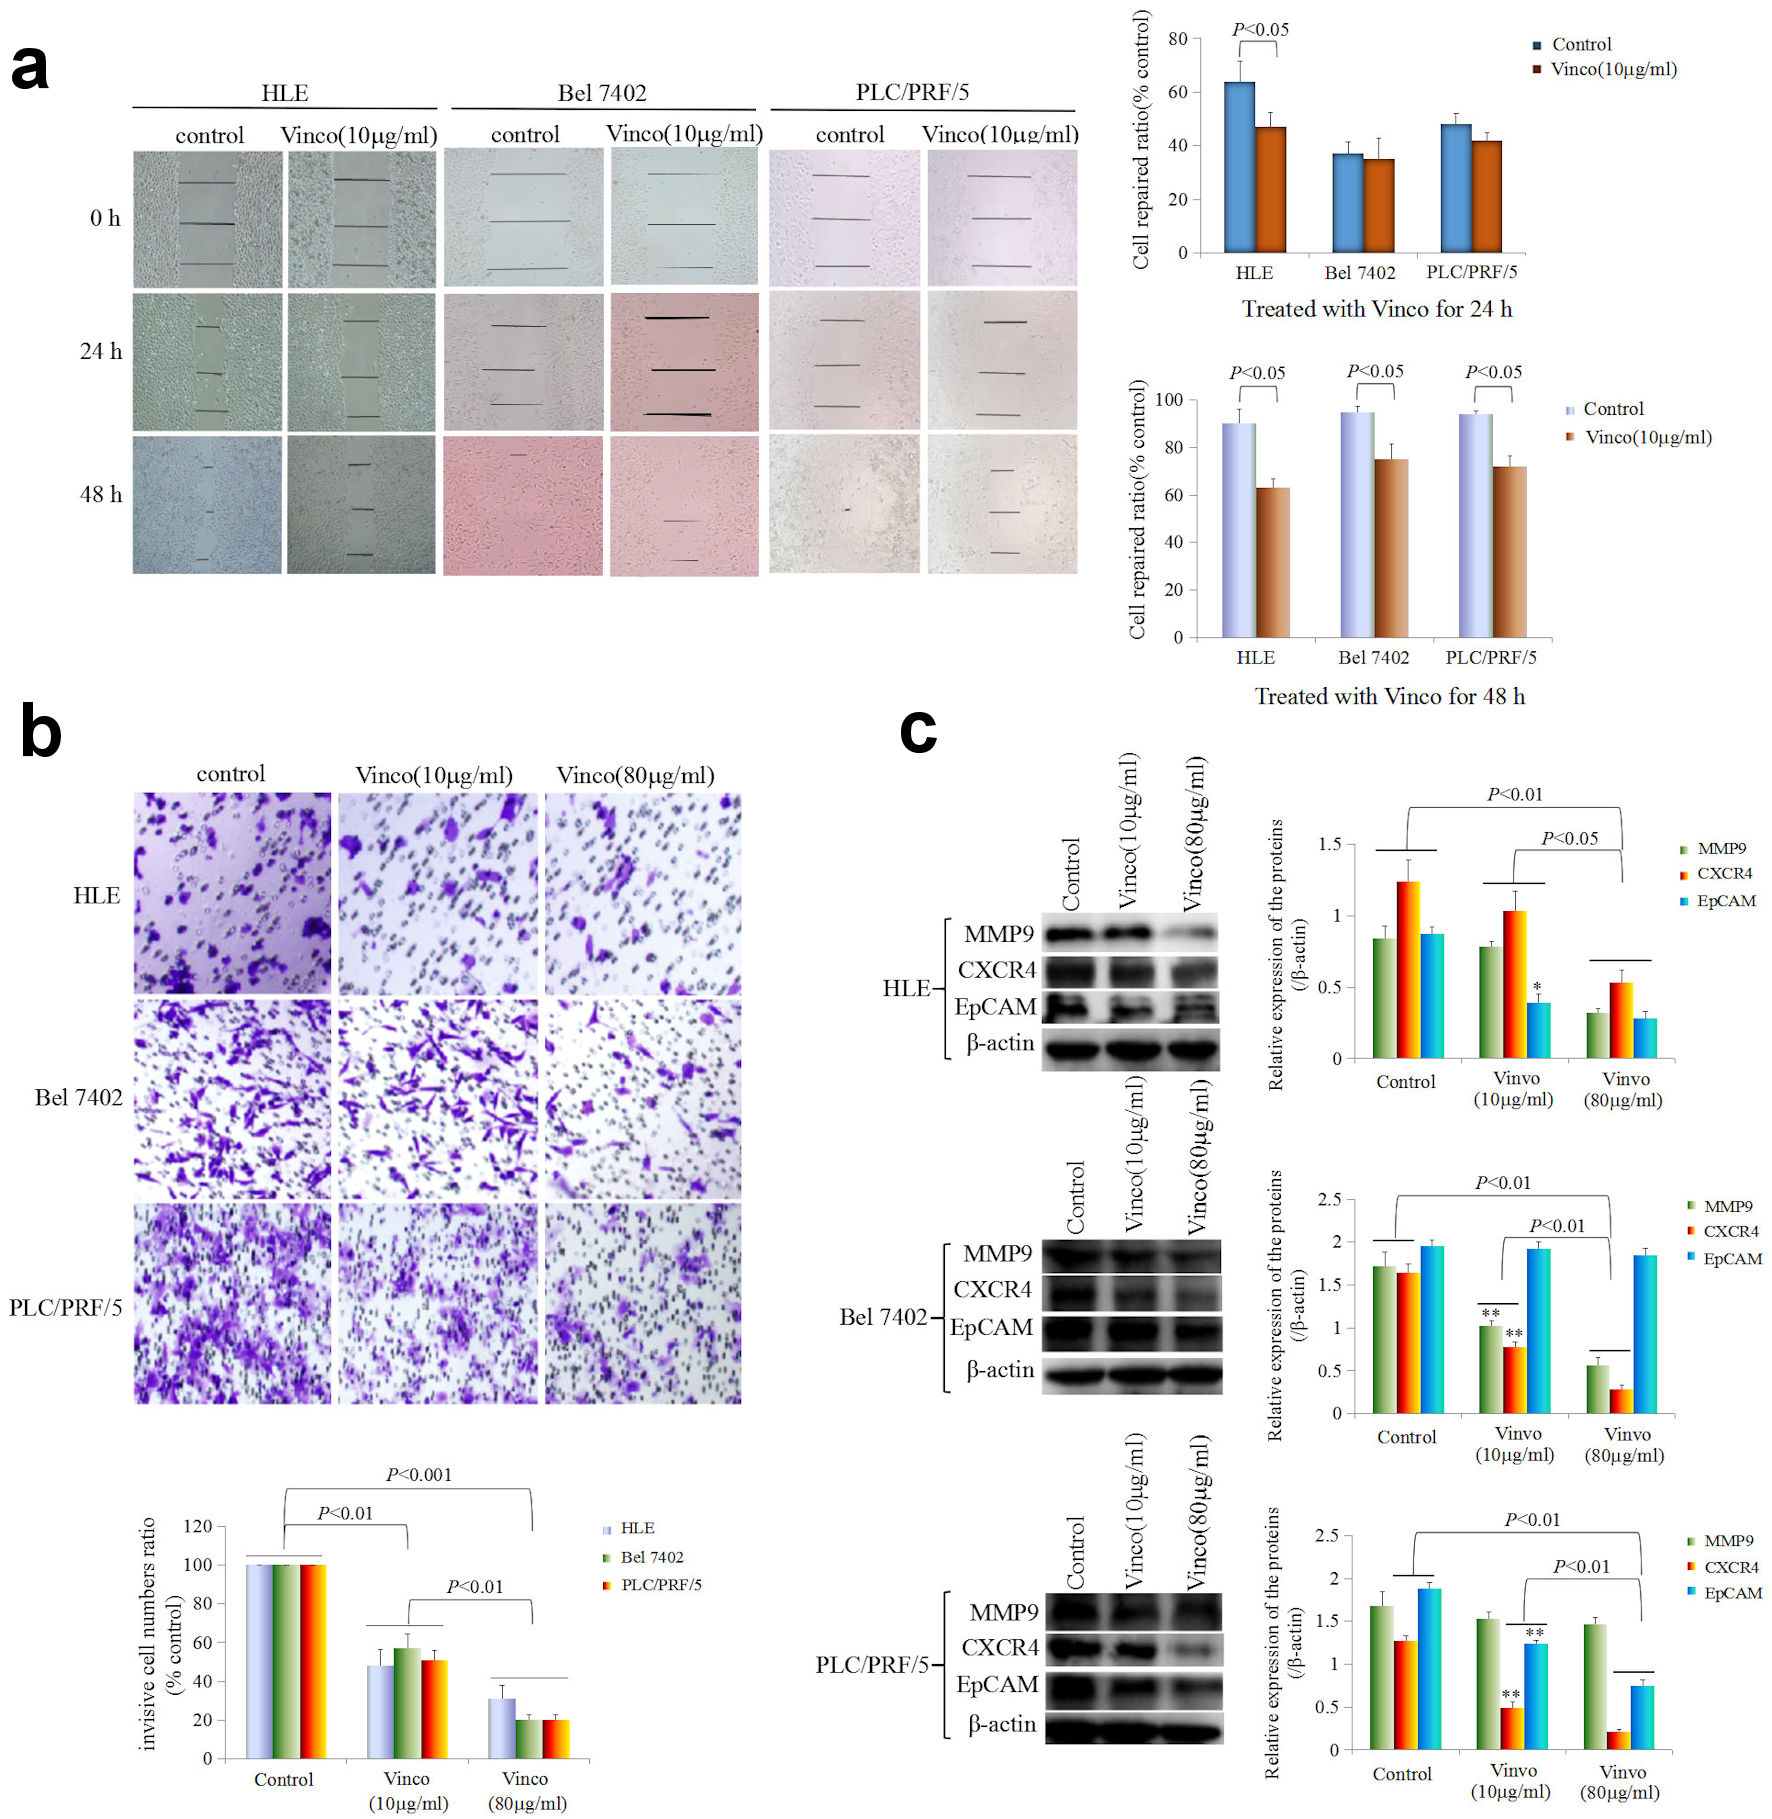
Figure 4. Influence of Vinco on scratch repair and migration, and the expression of metastasis-related proteins in HCC cells. (a) HLE, Bel 7402, and PLC/PRF/5 cells were treated with Vinco (10 µg/mL) for 24 h or 48 h. Scratch repair was observed by microscopy. The bar graph on the right shows the repair ratio of the cells, with P < 0.05 indicating statistical significance. (b) HLE, Bel 7402, and PLC/PRF/5 cells were treated with Vinco (10 µg/mL or 80 µg/mL) for 48 h. Migratory cells were stained with 0.1% crystal violet and observed by microscopy. The lower bar graph shows the number of migratory cells; with P < 0.01 indicates statistical significance. (c) HLE, Bel 7402, and PLC/PRF/5 cells were treated with Vinco (10 µg/mL or 80 µg/mL) for 48 h, and the expression of the metastasis-related proteins MMP9, CXCR4 and EpCAM were detected by Western blotting. The bar graphs on the right show the relative expressed quantity of these proteins, with P < 0.05 indicating statistical significance. The images are representative of three independent experiments. Vinco: vincosamide; HCC: hepatocellular carcinoma.
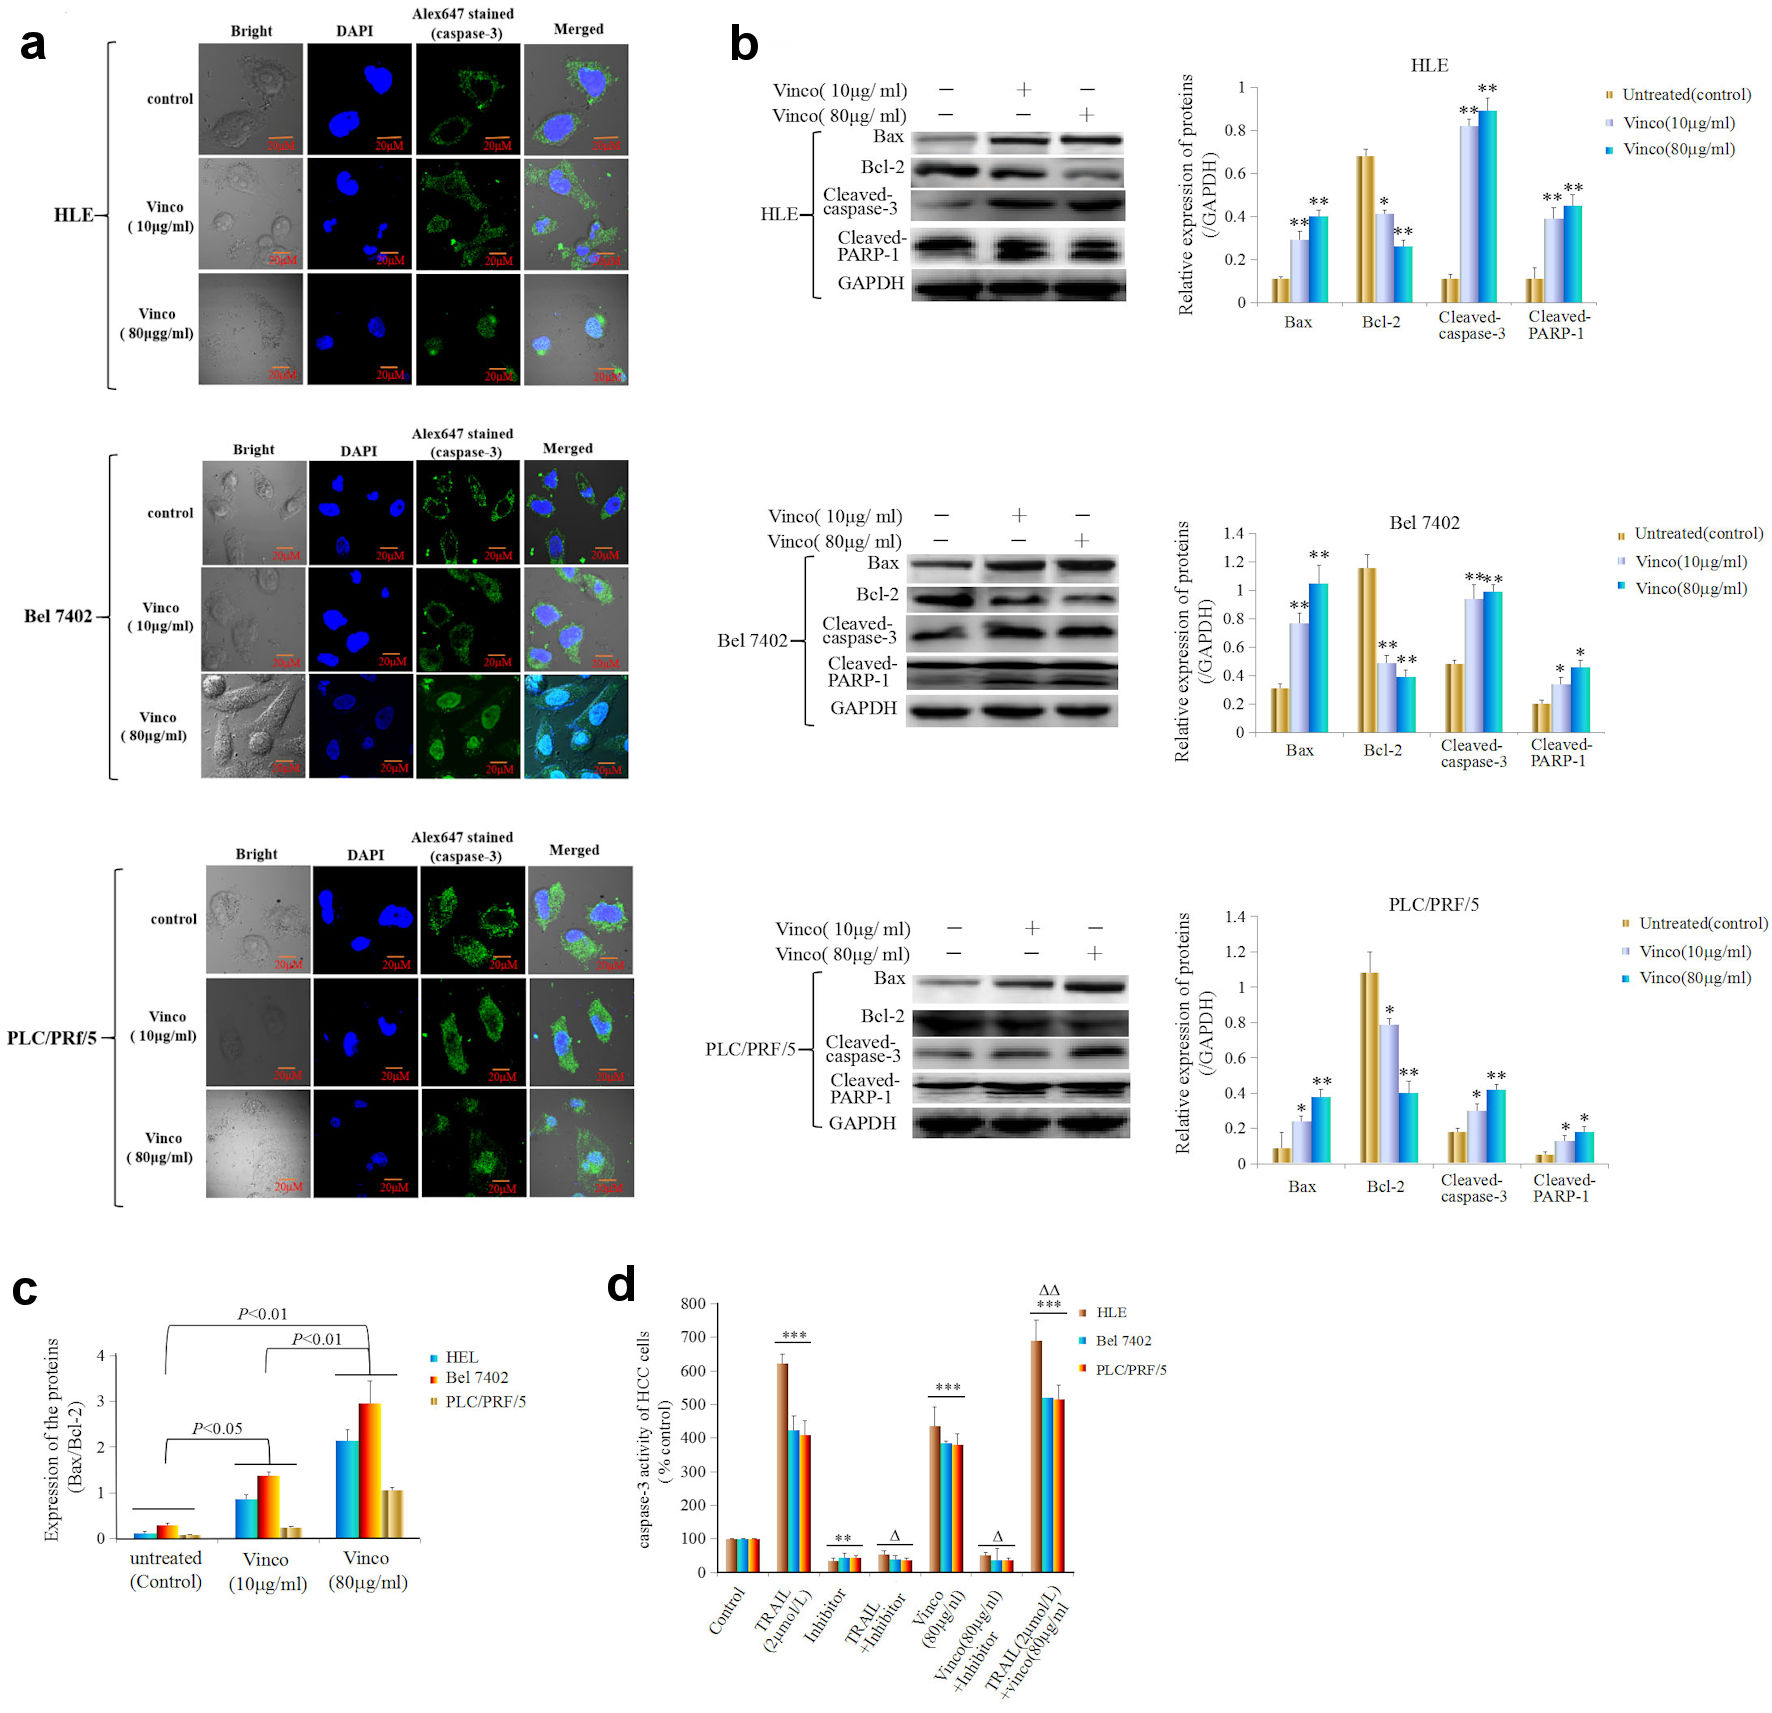
Figure 5. Effects of Vinco on nuclear migration and activity of caspase-3, and the expression of apoptosis-related proteins in HCC cells. HLE, Bel 7402, and PLC/PRF/5 cells were treated with Vinco (10 µg/mL or 80 µg/mL) for 48 h, and the nuclear migration of caspase-3 molecules in these cells was observed by laser confocal microscopy (a). The expression of the apoptosis-related proteins Bax, Bcl-2, cleaved caspase-3 and PARP-1 was detected by Western blotting. The bar graphs on the right show the relative expression of these proteins. *P < 0.05, **P < 0.01 vs. the untreated group (control) (b). The quantitative expression ratio of Bax/Bcl-2 (c), with P < 0.05 indicating statistical significance. The images are representative of at least three independent experiments. (d) HLE, Bel 7402, and PLC/PRF/5 cells were treated with TRAIL (2 µmol/L) or Vinco (80 µg/mL) and a caspase-3 inhibitor (Z-DEVD-FMK) for 48 h. The activity of caspase-3 in these cells was measured using an enzymatic reaction kit. **P < 0.01, ***P < 0.001 vs. control group, ΔP < 0.01 vs. the control group, TRAIL (2 µmol/L)-treated group or Vinco (80 µg/mL)-treated group; ΔΔP < 0.05 vs. the TRAIL (2 µmol/L)- and Vinco (80 µg/mL)-treated group (n = 6). The images are representative of at least three independent experiments. Vinco: vincosamide; HCC: hepatocellular carcinoma; TRAIL: tumor necrosis factor-related apoptosis-induced ligand.
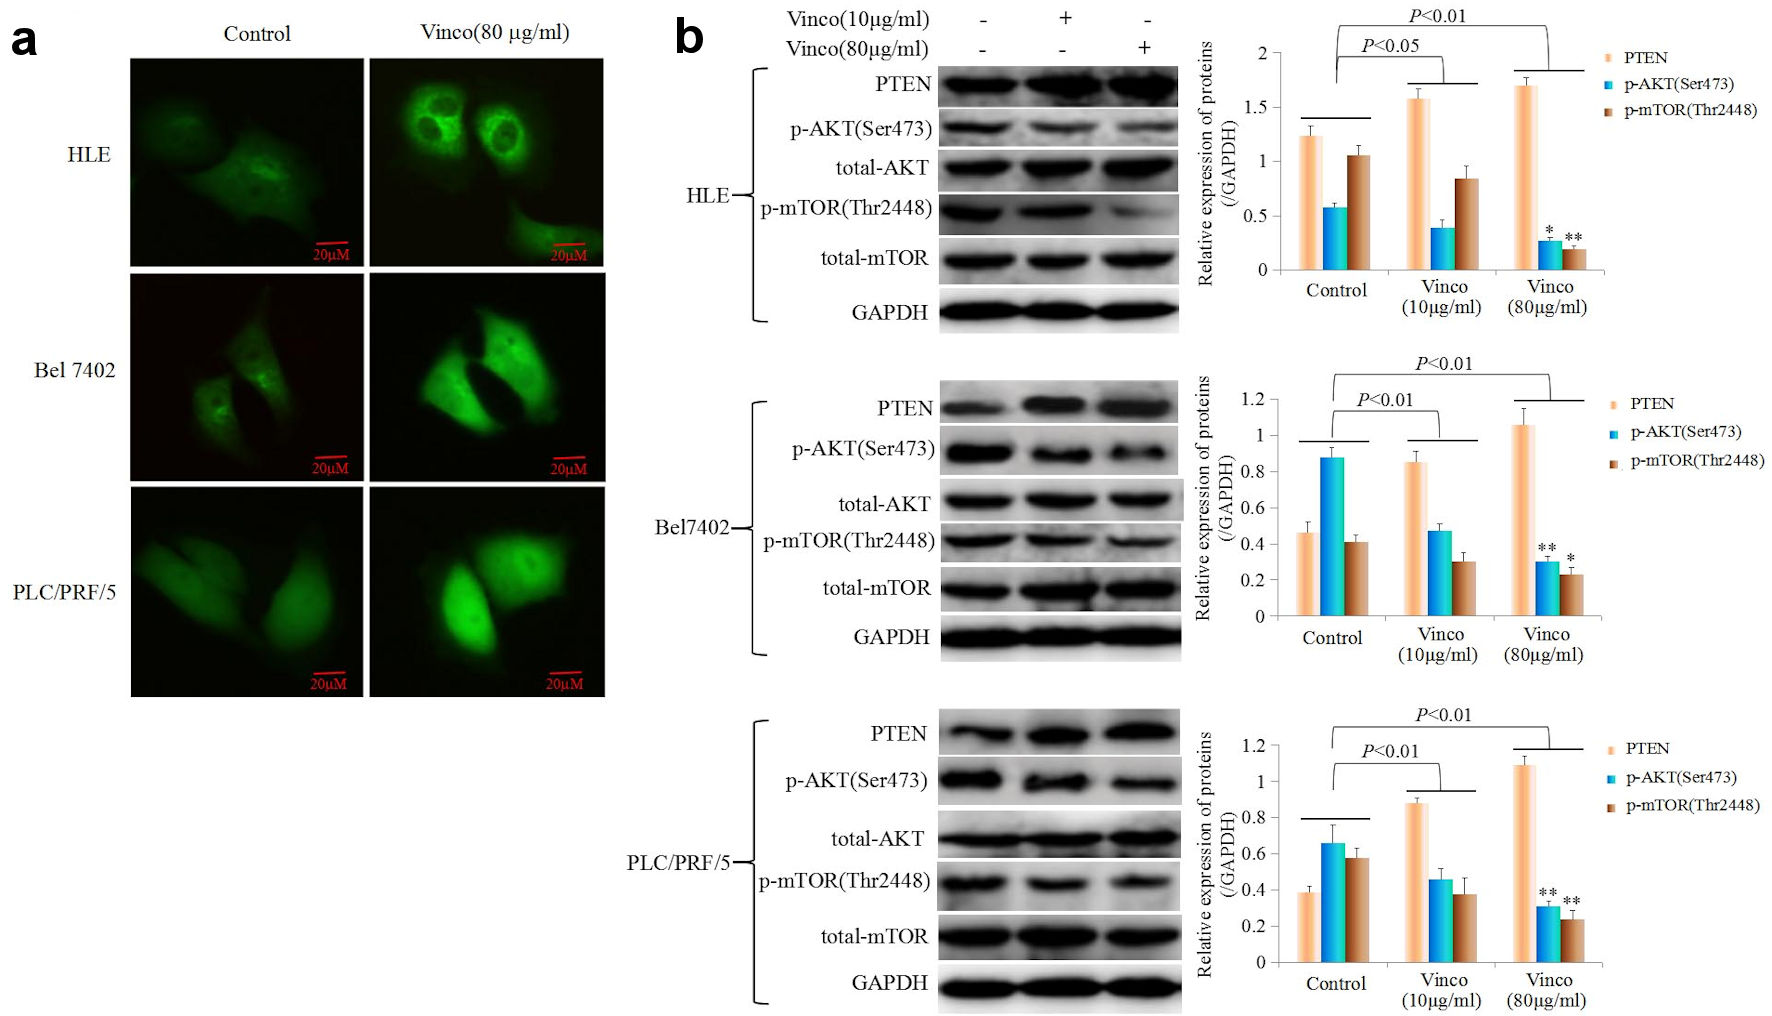
Figure 6. The influence of Vinco on the expression of PTEN, and the PI3K/AKT signaling pathway is regulated by PTEN express in HCC cells. (a) HLE, Bel 7402 and PLC/PRF/5 cells were treated with Vinco (80 µg/mL) for 48 h, and the expression and localization of PTEN in these cells were observed by laser confocal microscopy. (b) HLE, Bel 7402 and PLC/PRF/5 cells were treated with Vinco (10 µg/mL or 80 µg/mL) for 48 h, and the expression of PTEN, pAKT (Ser473), pmTOR (Thr2448) was detected by Western blotting. The bar graphs on the right show relative expressed quantity of these proteins, with P < 0.05 indicating statistical significance; *P < 0.05 and **P < 0.01 vs. control and Vinco (10 µg/mL)-treated groups. The images are representative of at least three independent experiments. Vinco: vincosamide; HCC: hepatocellular carcinoma; PTEN: phosphate and tension homology deleted on chromosome 10.
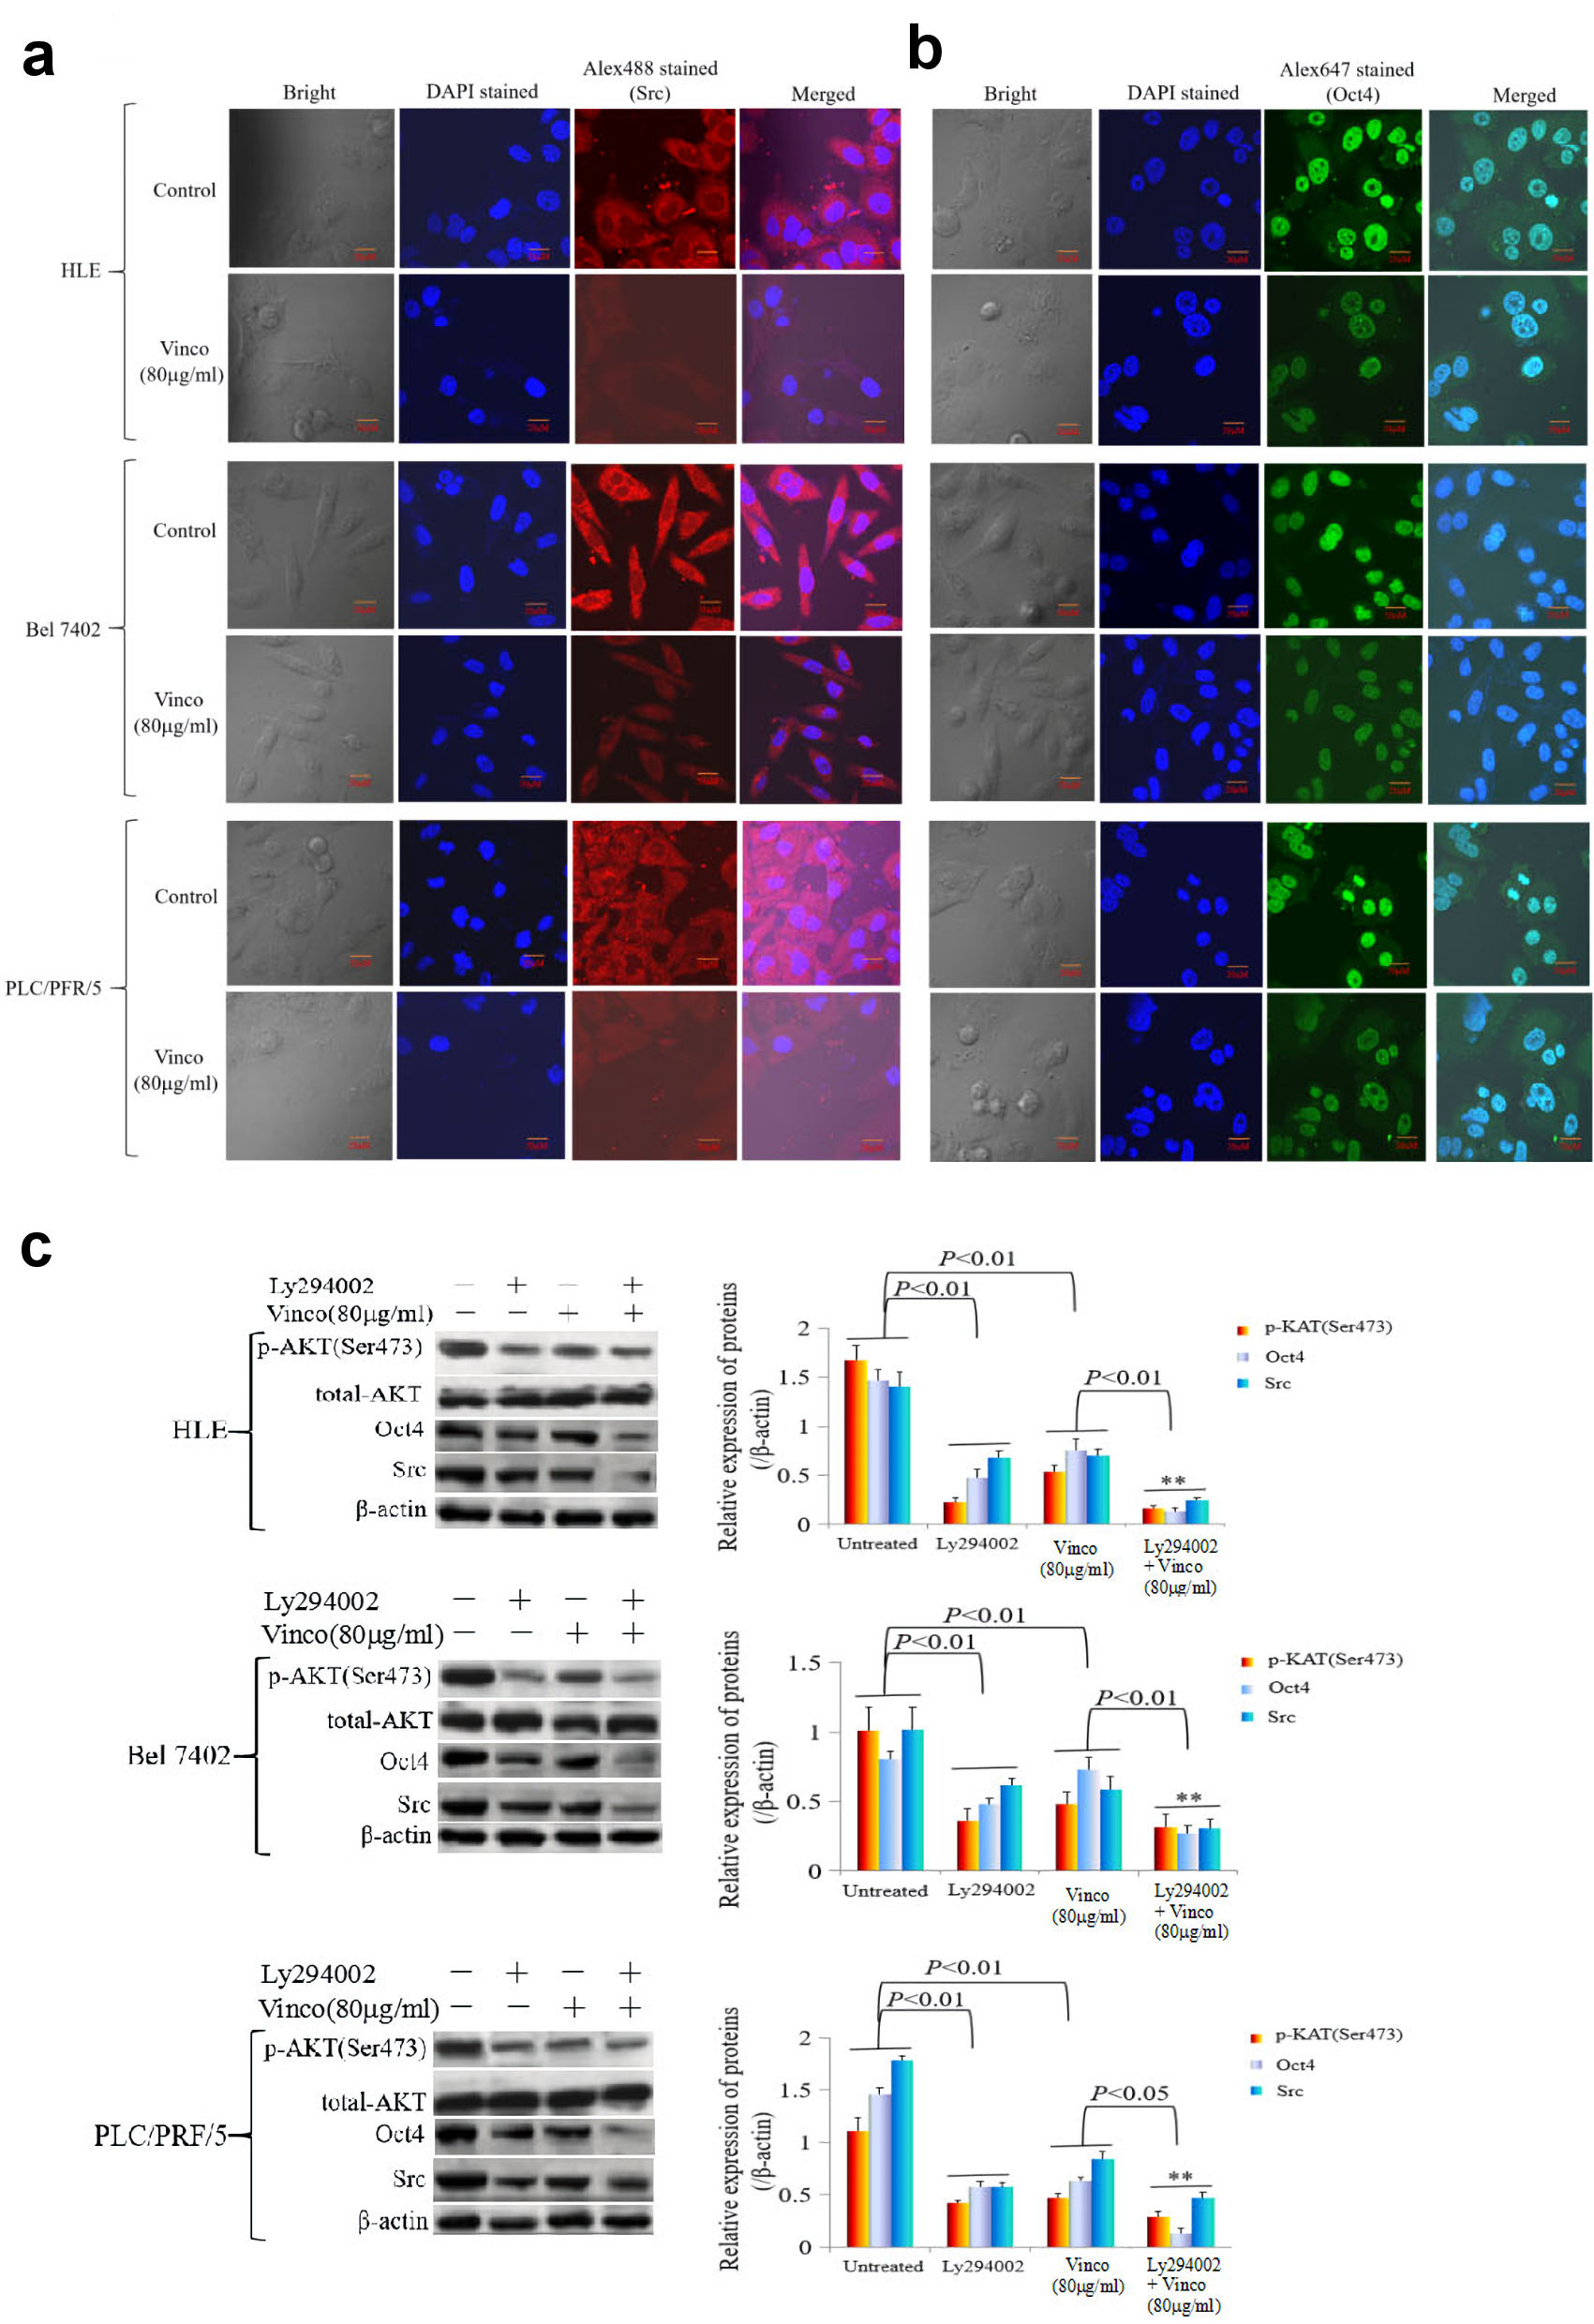
Figure 7. The influence of Vinco on the expression of the oncogene Src, the reprogramming gene Oct4, and the proteins related to the regulation by PI3K/AKT signaling pathway in HCC cells. HLE, Bel 7402 and PLC/PRF/5 cells were treated with Vinco (80 µg/mL) for 48 h, and the expression and localization of Src (a) and Oct4 (b) in these cells were observed by laser confocal microscopy. (c, d) HLE, Bel 7402 and PLC/PRF/5 cells were treated with Vinco (80 µg/mL) or the PI3K inhibitor Ly294002 (2 µmol/L) or co-treated with Vinco (80 µg/mL) and Ly294002 (2 µmol/L) for 48 h, and the expression of pAKT (Ser473), Src and Oct4 were detected by Western blotting. The bar graphs on the right showed relative expressed quantity of these proteins, with P < 0.05 indicating statistical significance; **P < 0.01 vs. Ly294002- treated groups. The images are representative of at least three independent experiments. Vinco: vincosamide; HCC: hepatocellular carcinoma; DAPI: 4’,6-diamidino-2-phenylindole dihydrochloride.
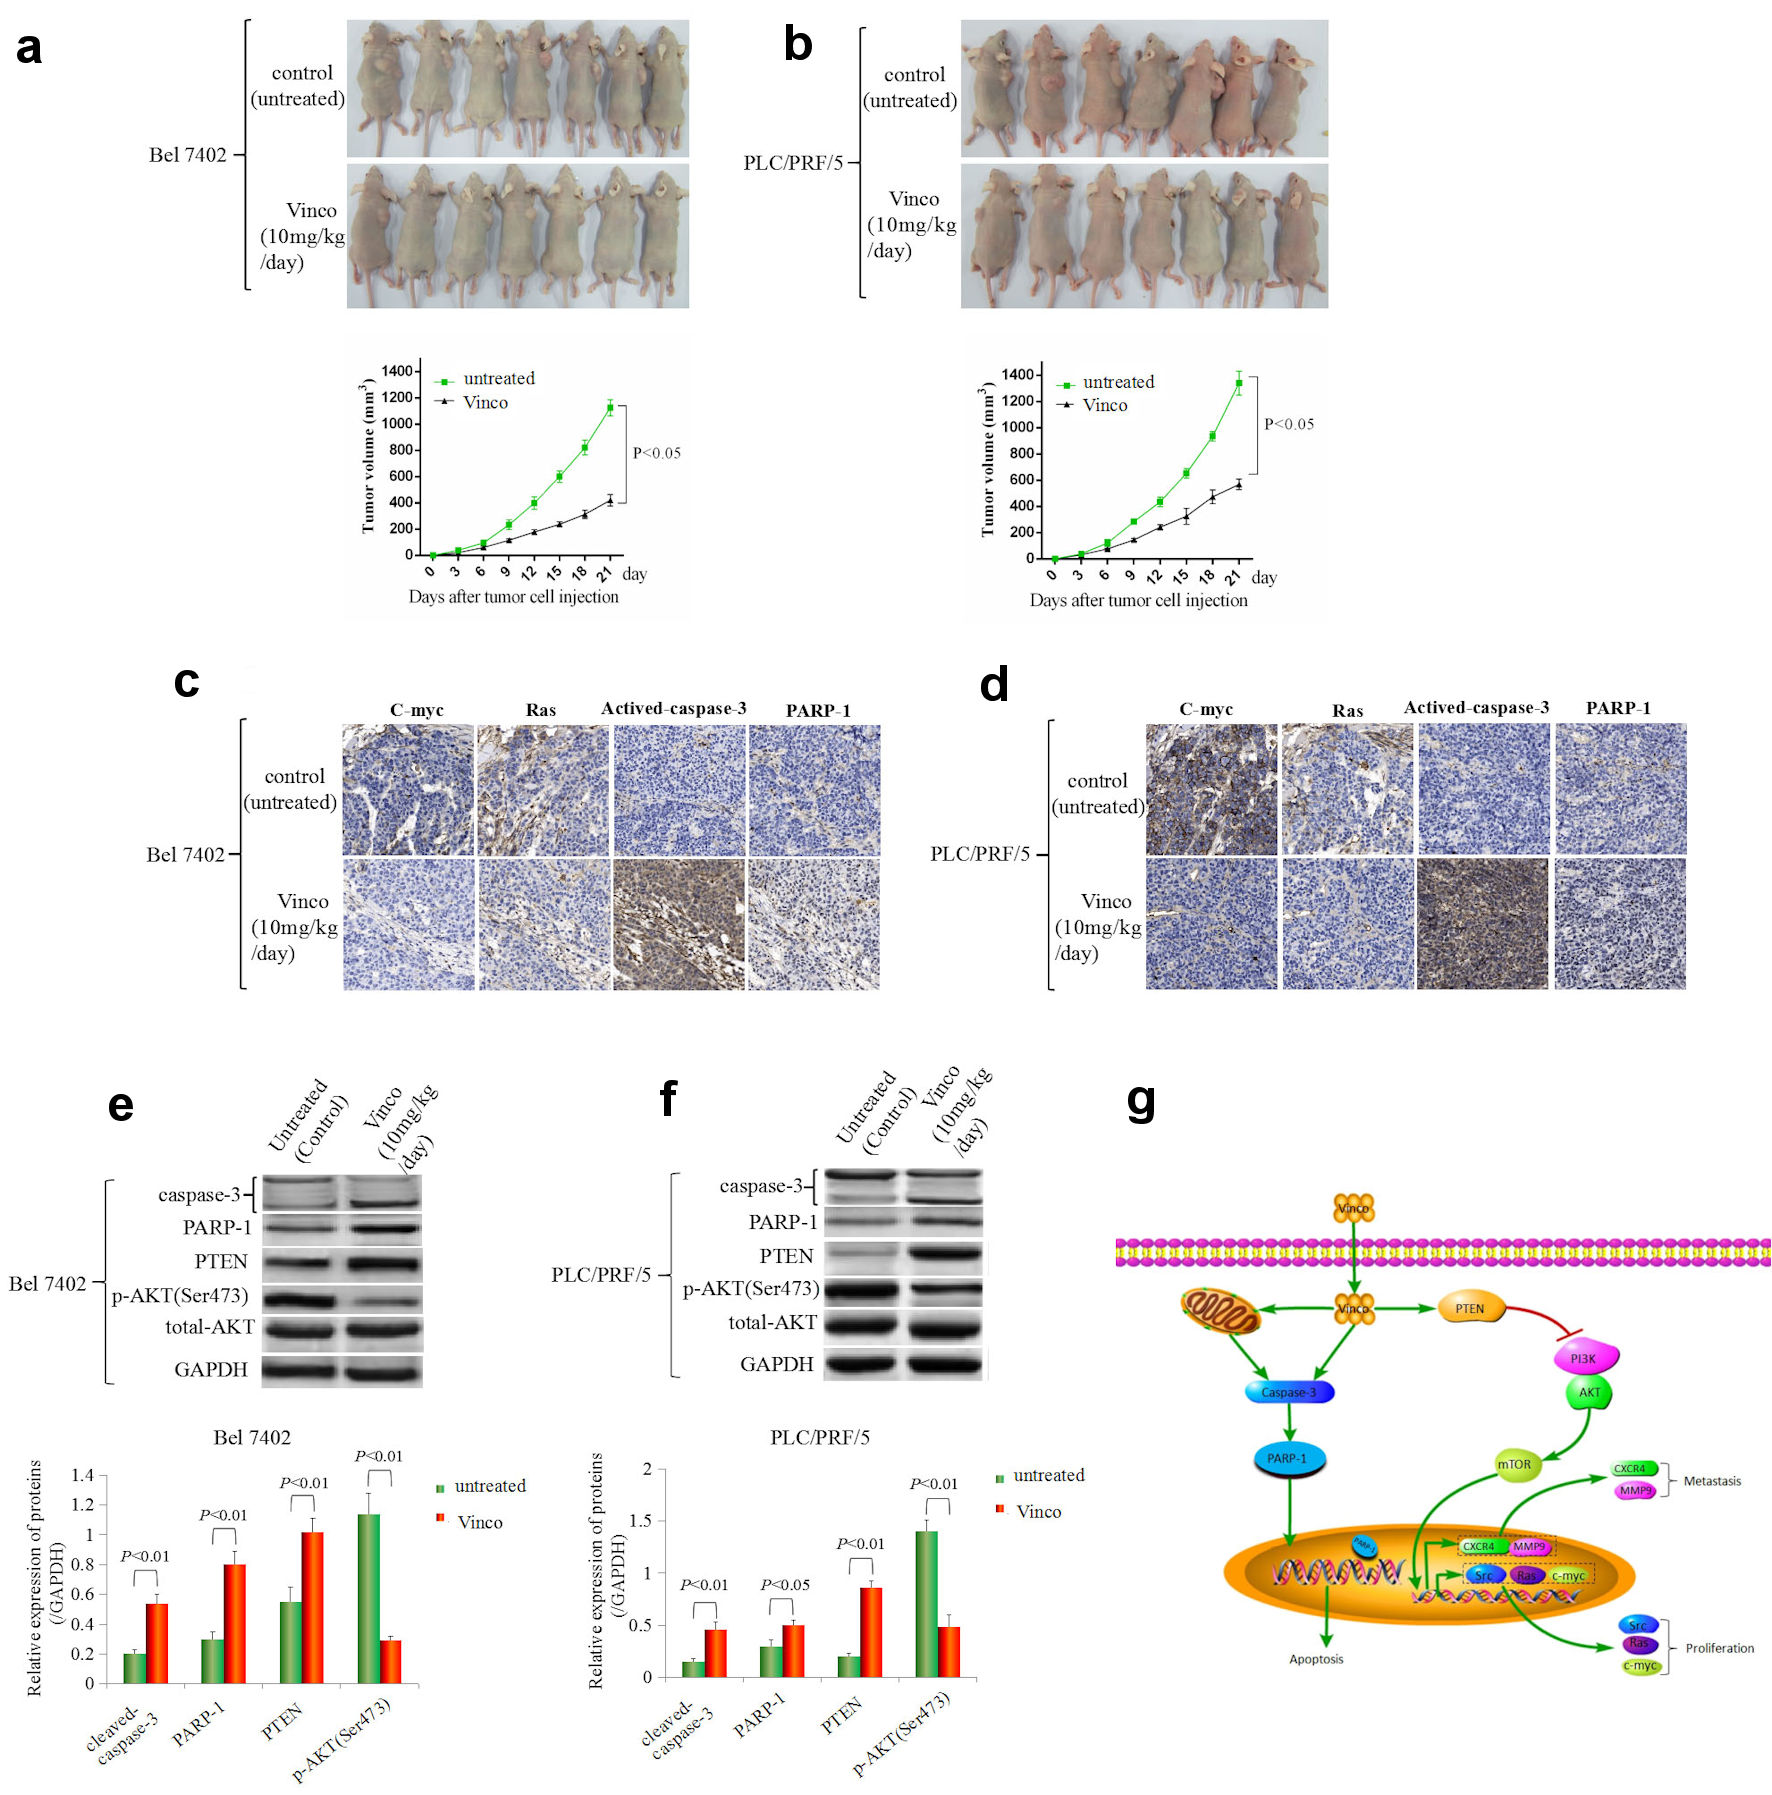
Figure 8. The effect of Vinco on HCC cells growth, the expression of the growth-related factors C-myc, Ras, PTEN, pAKT (Ser473) and the activity of caspase-3 in vivo. Bel 7402 (a) and PLC/PRF/5 (b) cells (1 × 10⁶) in 0.1 mL of Hank balanced salt solution were subcutaneously injected into the right scapular region of male nude mice (n = 7). The mice were intraperitoneally injected with Vinco (10 mg/kg/day) every day. Tumor-bearing mice were killed every 3 days after inoculation, the tumors were removed, and the measured length (L), weight (W) of the tumors were measured, and the volume (V) was calculated by the following formula: V = π/6 × L × W2 (π = 3.14). The lower bar graphs show tumorous volume. (c, d) The expression of c-myc, Ras, cleaved caspase-3 and PARP-1 in tumorous tissues (extracted from tumor-bearing mice on day 21) were detected by immunohistochemistry. (e, f) The expression of cleaved caspase-3, PARP-1, PTEN, pAKT (Ser473) in tumorous tissues were detected by Western blotting. The bar graphs on the right show relative expressed quantity of these proteins. with P < 0.05 indicating statistical significance. The images are representative of at least three independent experiments. (g) Schematic of the mechanism underlying the role of Vinco in inhibiting the malignant behaviors of HCC cells. Vinco: vincosamide; HCC: hepatocellular carcinoma; PTEN: phosphate and tension homology deleted on chromosome 10.