Figures
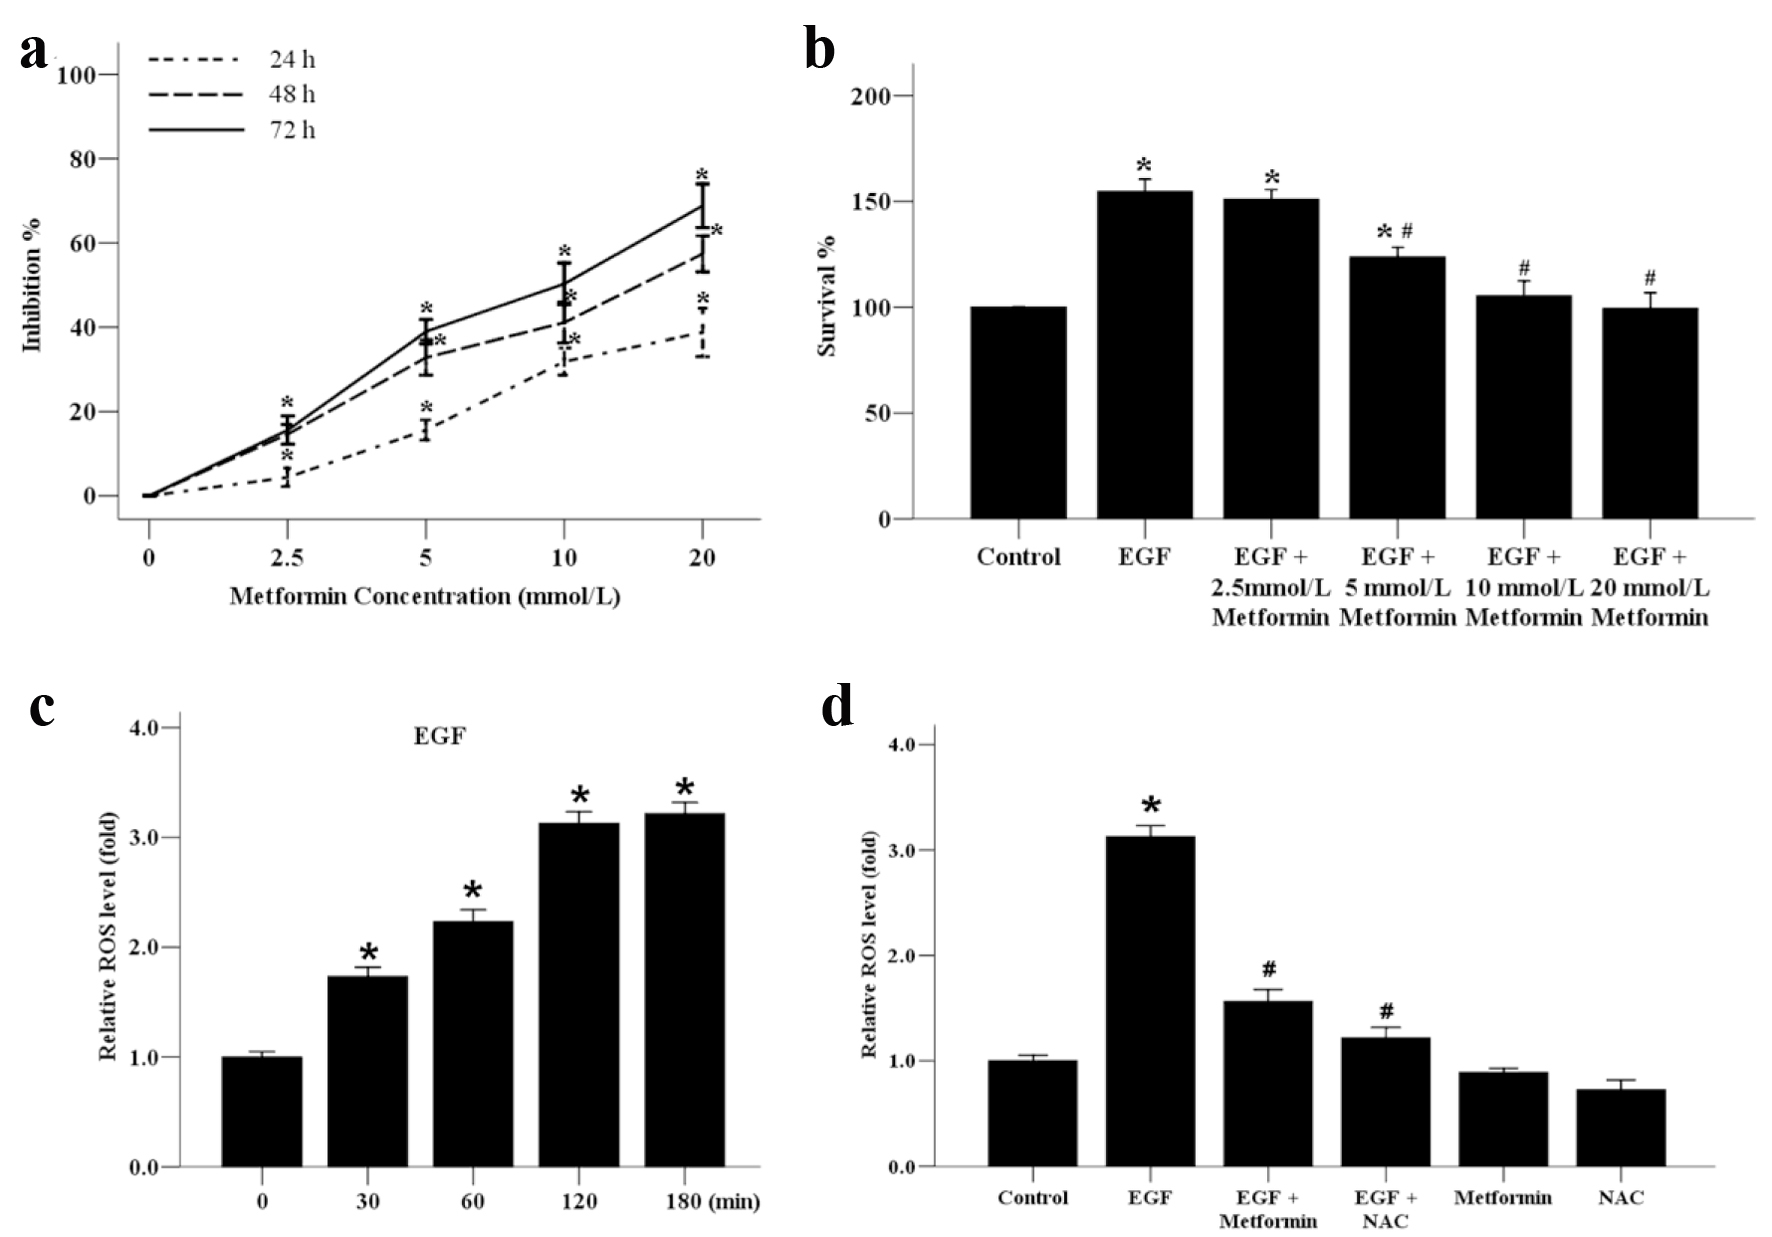
Figure 1. The effect of metformin on the growth and ROS generation of the human MCF-7 breast cancer cells. (a) MCF-7 cells were incubated with various concentrations of metformin from 0 to 20 mmol/L for 24, 48 or 72 h to analyze the inhibition ratio for cancer cell proliferation. *P < 0.05 versus the 0 mmol/L group. (b) MCF-7 cells were plated onto 96-well dishes and treated with EGF (50 ng/mL) and metformin (0 - 20 mmol/L) for 48 h. The survival ratio of cells was assayed by an MTT test. *P < 0.05 versus the control group. (c) Effect of EGF (50 ng/mL) on the generation of ROS in MCF-7 cells from 0 to 180 min. *P < 0.05 versus the 0 min group. (d) Effect of metformin and ROS inhibitor NAC on EGF-induced ROS generation. Cells were treated with 10 mmol/L NAC or metformin, stimulated with EGF (50 ng/mL) for 120 min, and subjected to analysis of ROS production. *P < 0.05 versus the control group; #P < 0.05 versus the EGF group.
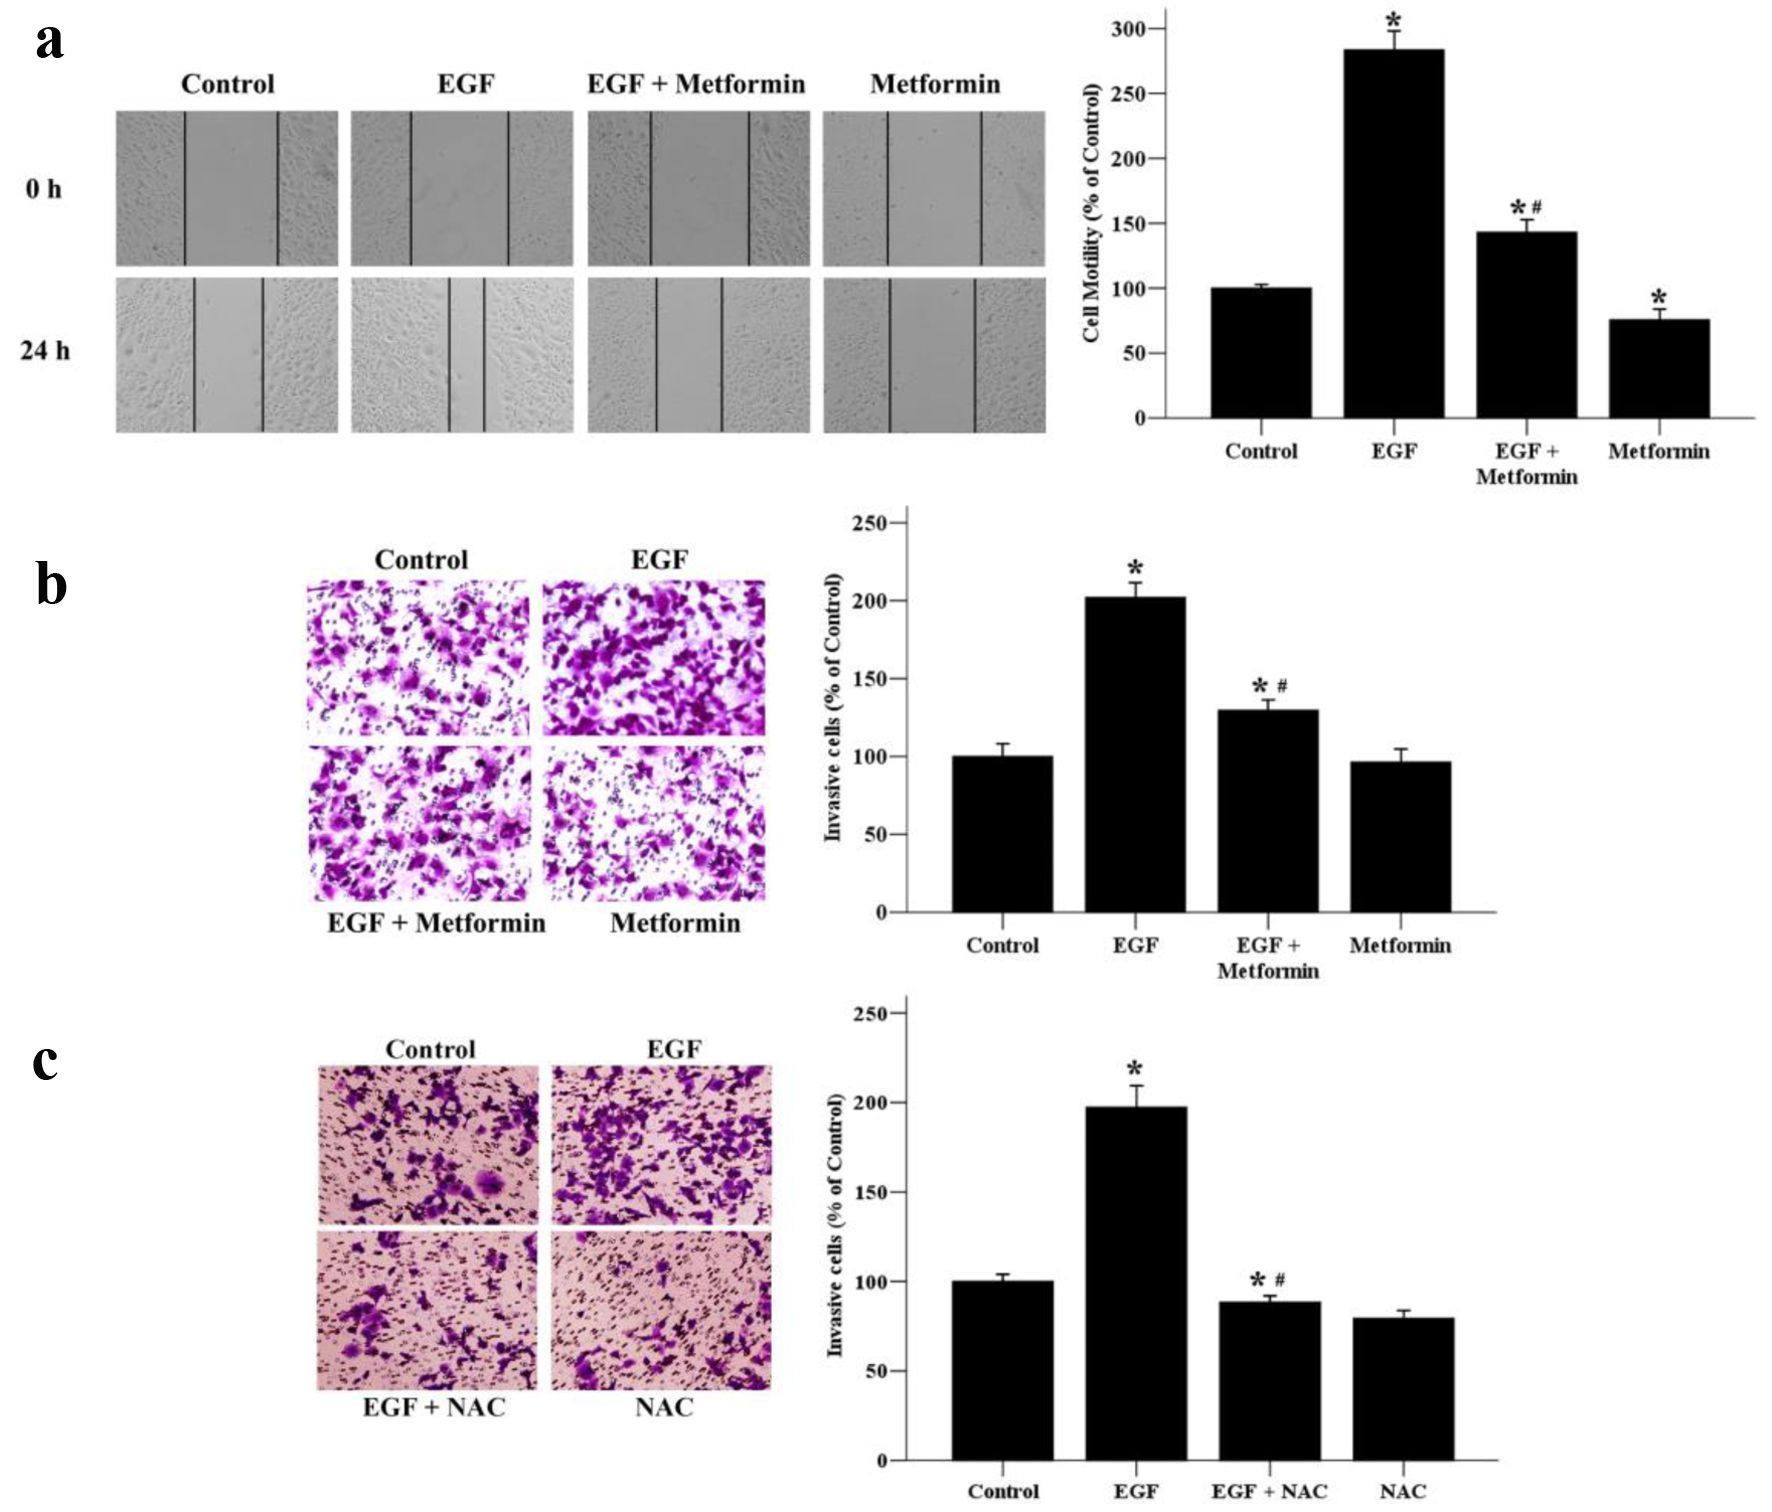
Figure 2. The effects of metformin on EGF-induced migratory and invasive abilities of breast cancer cells. (a) Cell migratory ability was assessed by wound healing assays. A scratch was made across confluent monolayers using a sterile pipette tip. MCF-7 cells were treated with EGF (50 ng/mL) and/or metformin (10 mmol/L) and observed after 24 h. Migrated cells were monitored using an inverted microscope with × 100 magnification. (b) A transwell invasion assay was used to quantify cell invasion. Cells were seeded into upper chambers and incubated for 48 h in the presence of EGF (50 ng/mL) and/or metformin (10 mmol/L). (c) Effect of NAC on EGF-induced cell invasion. Cells were seeded into upper chambers and incubated for 48 h in the presence of EGF (50 ng/mL) and/or NAC (10 mmol/L). The invaded cells were photographed using an inverted microscope with × 200 magnification. *P < 0.05 versus the control group. #P < 0.05 versus the EGF group.
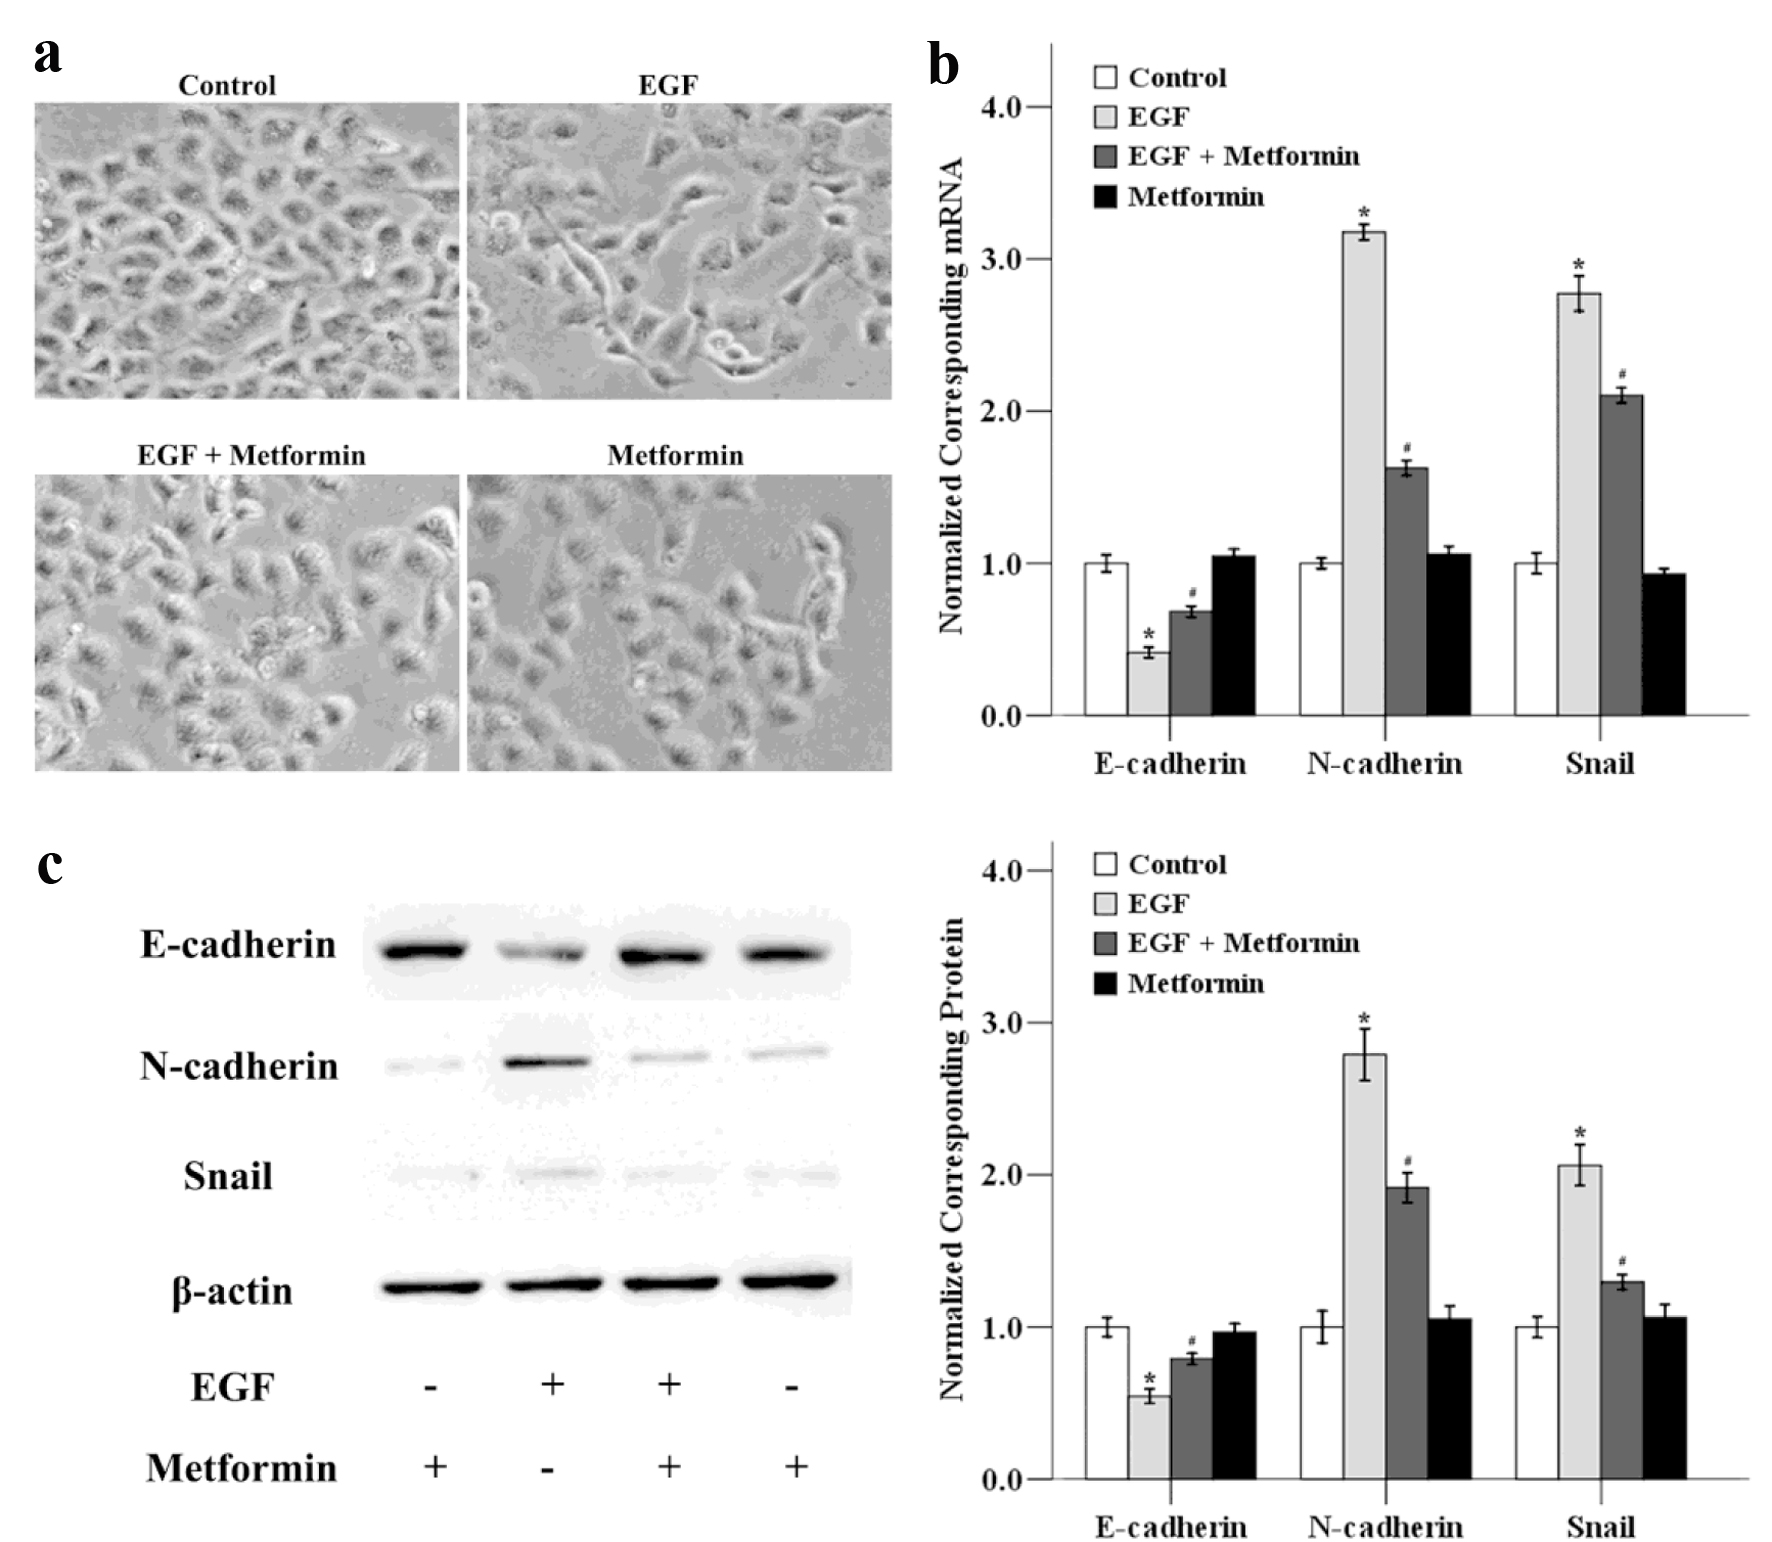
Figure 3. The effects of metformin on EGF-induced EMT in MCF-7 cells. (a) Cancer cells were treated with 50 ng/mL EGF and/or 10 mmol/L metformin for 48 h and the cellular morphological changes was observed. The mRNA (b) and protein (c) expression levels of E-cadherin, N-cadherin and Snail were also determined using qRT-PCR and western blotting. *P < 0.05 versus the control group; #P < 0.05 versus the EGF group.
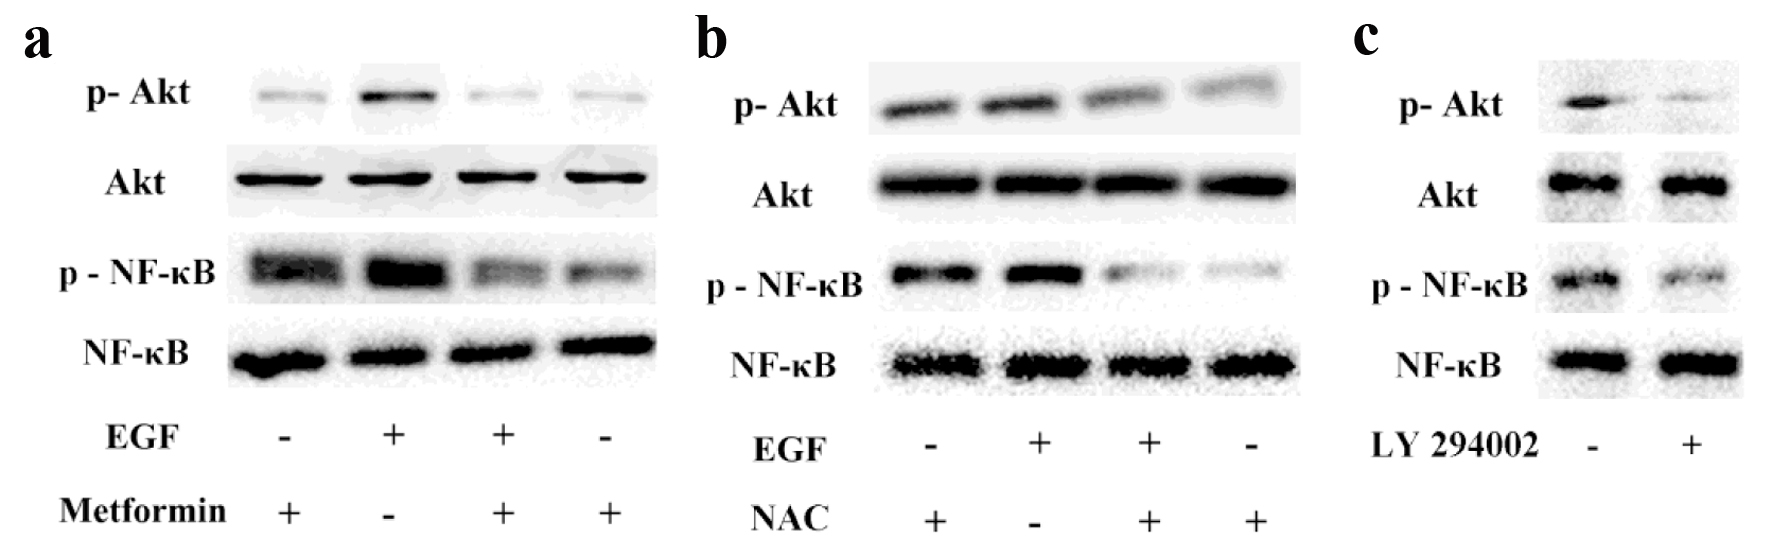
Figure 4. The effects of metformin on EGF-activated PI3K/Akt/NF-κB pathway. Breast cancer cells were pretreated with or without 10 mmol/L metformin (a) or NAC (b) for 24 h and then exposed to 50 ng/mL EGF to evaluate the phosphorylation levels of Akt and NF-κB via Western blotting. (c) Cancer cells were treated with LY294002 (10 µmol/L) and the activation of Akt and NF-κB were assessed via western blotting.
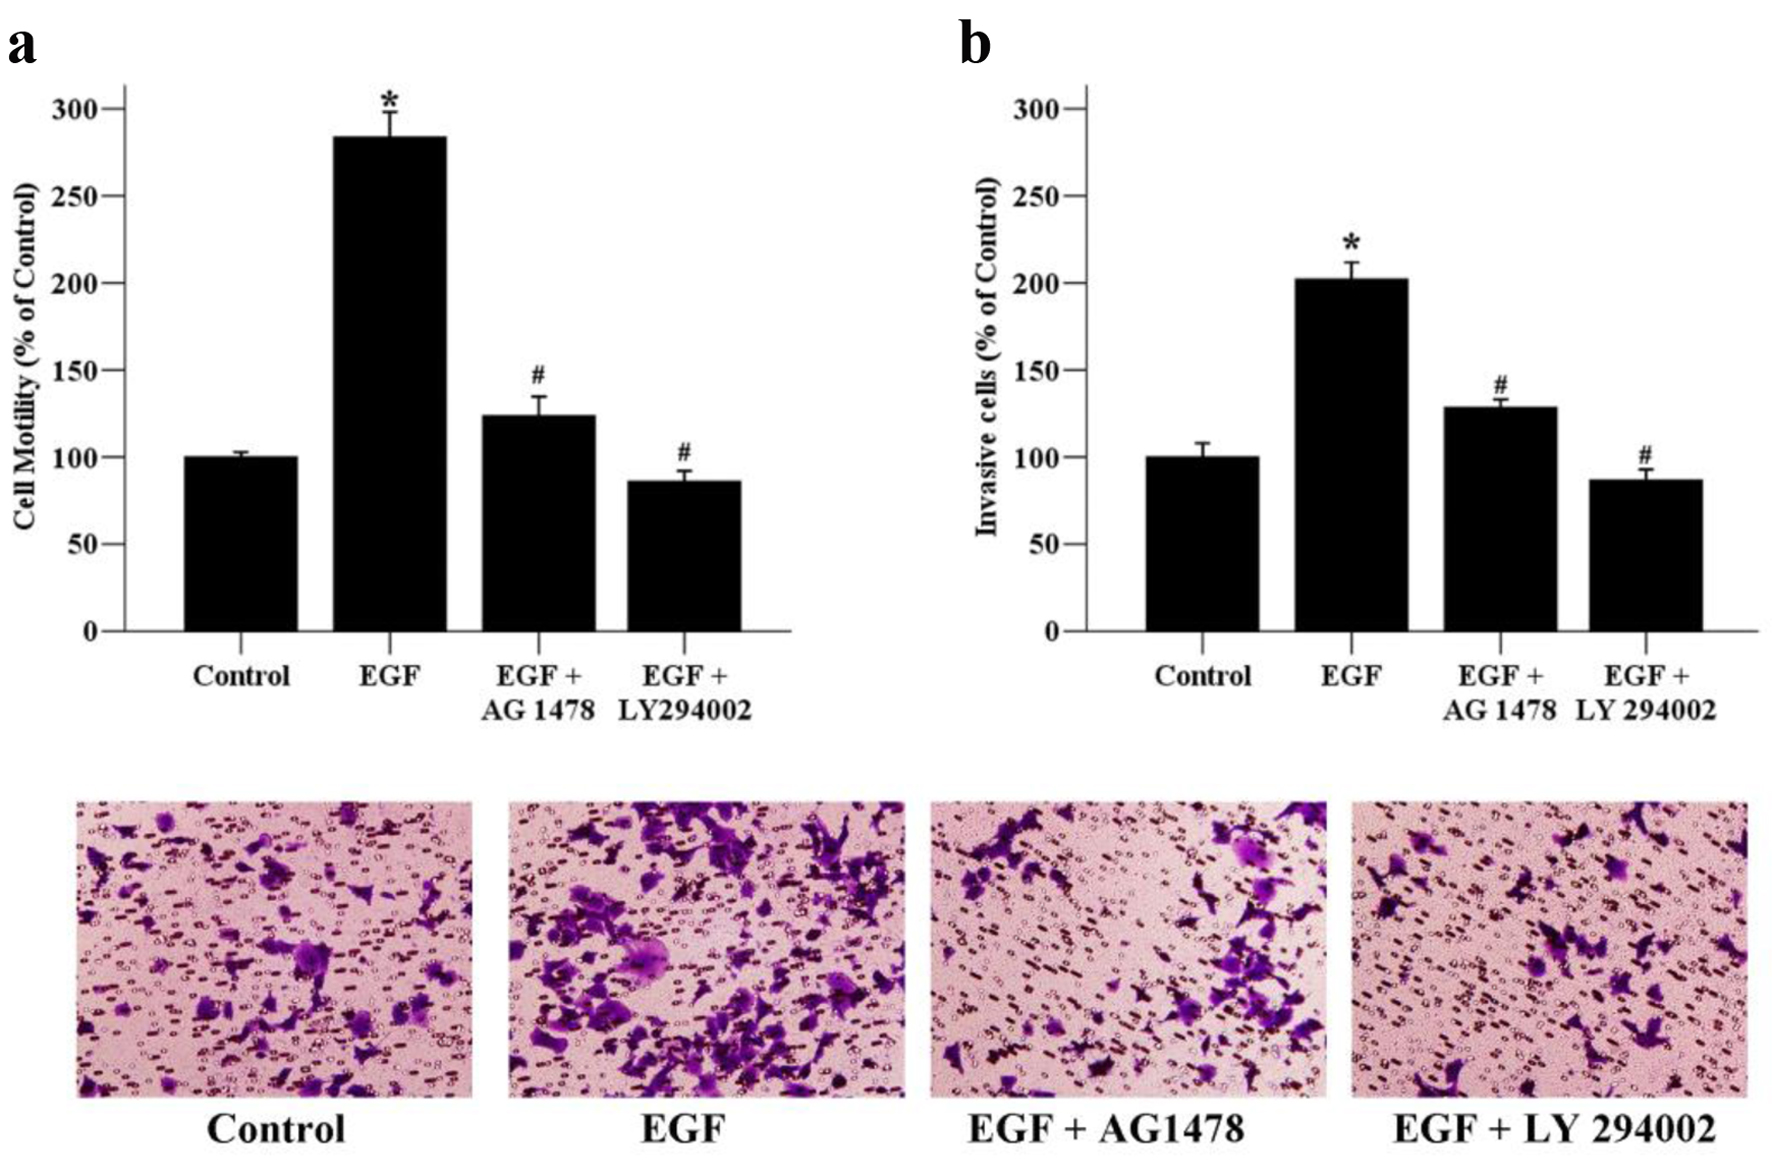
Figure 5. The effects of signaling inhibitors on the motility and invasion of MCF-7 cells. (a) Cancer cells were exposed to EGF (50 ng/mL) as well as AG 1478 (20 µmol/L), or LY294002 (10 µmol/L) for 24 h. The migratory ability of MCF-7 cells was assessed by wound healing assays. Migrated cells were monitored using an inverted microscope with × 100 magnification. (b) Cancer cells were exposed to EGF (50 ng/mL) as well as AG 1478 (20 µmol/L), or LY294002 (10 µmol/L) for 48 h. The invaded cells were photographed using an inverted microscope with × 200 magnification. *P < 0.05 versus the control group; #P < 0.05 versus the EGF group.