Figures
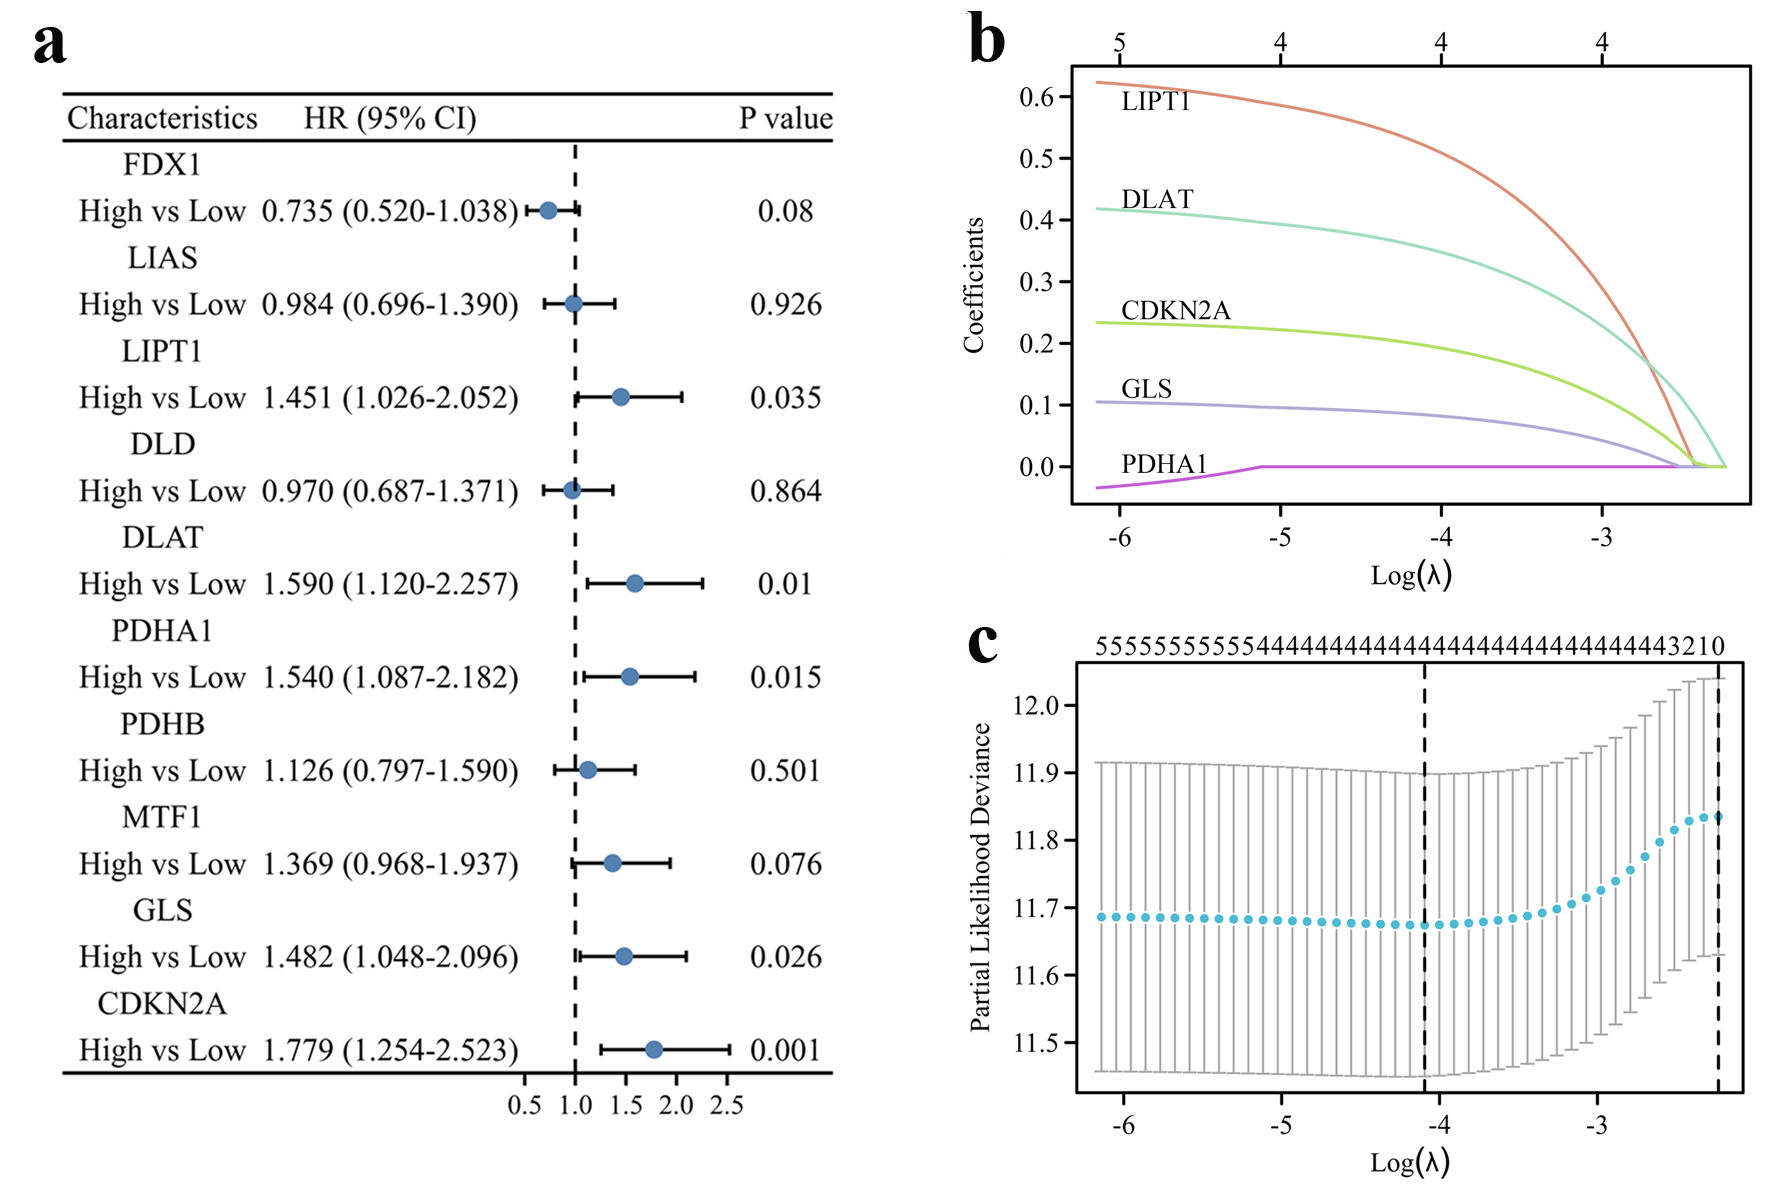
Figure 1. Construction of the cuproptosis-related prognostic signature in the TCGA cohort. (a) The forest plot of univariate Cox regression between OS and 10 CRGs of HCC patients in the TCGA cohort. (b) LASSO coefficient profiles of the CRGs in the TCGA cohort. (c) Cross-validation for λ parameter selection in the LASSO model.
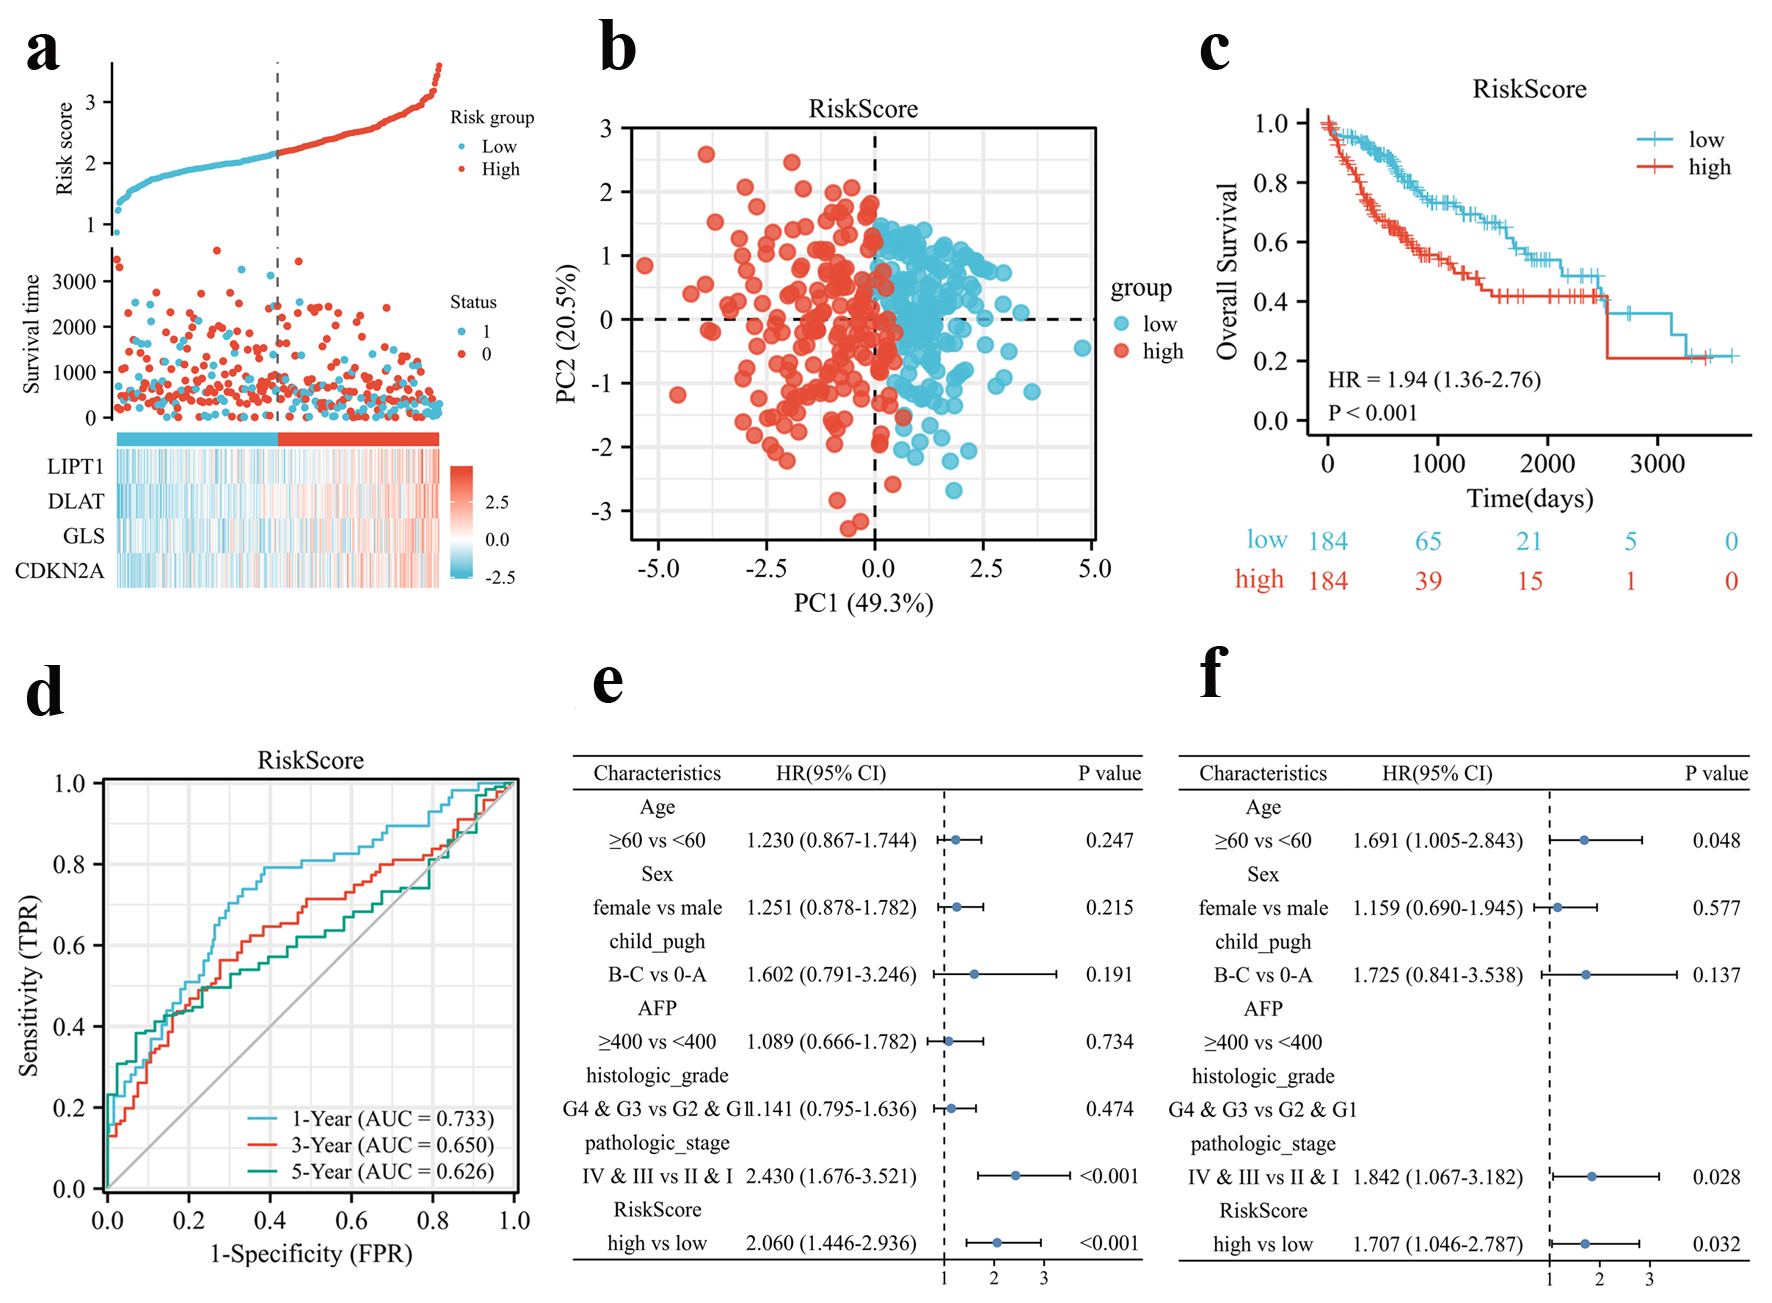
Figure 2. Prognosis analysis of the CRGs signature in the TCGA cohort. (a) Risk scores based on CRGs prognostic signatures (above), survival of HCC patients with high- or low-risk scores (middle), and expression of four CRGs that constitute the prognostic signature in the TCGA cohort (below). (b) PCA analysis of high- and low-risk scores in the TCGA cohort. (c) Kaplan-Meier plot of OS between high- and low-risk score groups in the TCGA cohort. (d) Time-dependent ROC curves for the prognostic performance of the CRGs signature in the TCGA cohort. (e, f) Univariate (e) and multivariate (f) Cox regression analyses regarding OS evaluated the prognostic value of the CRGs signature and other factors in the TCGA cohort. HR: hazard ratio.
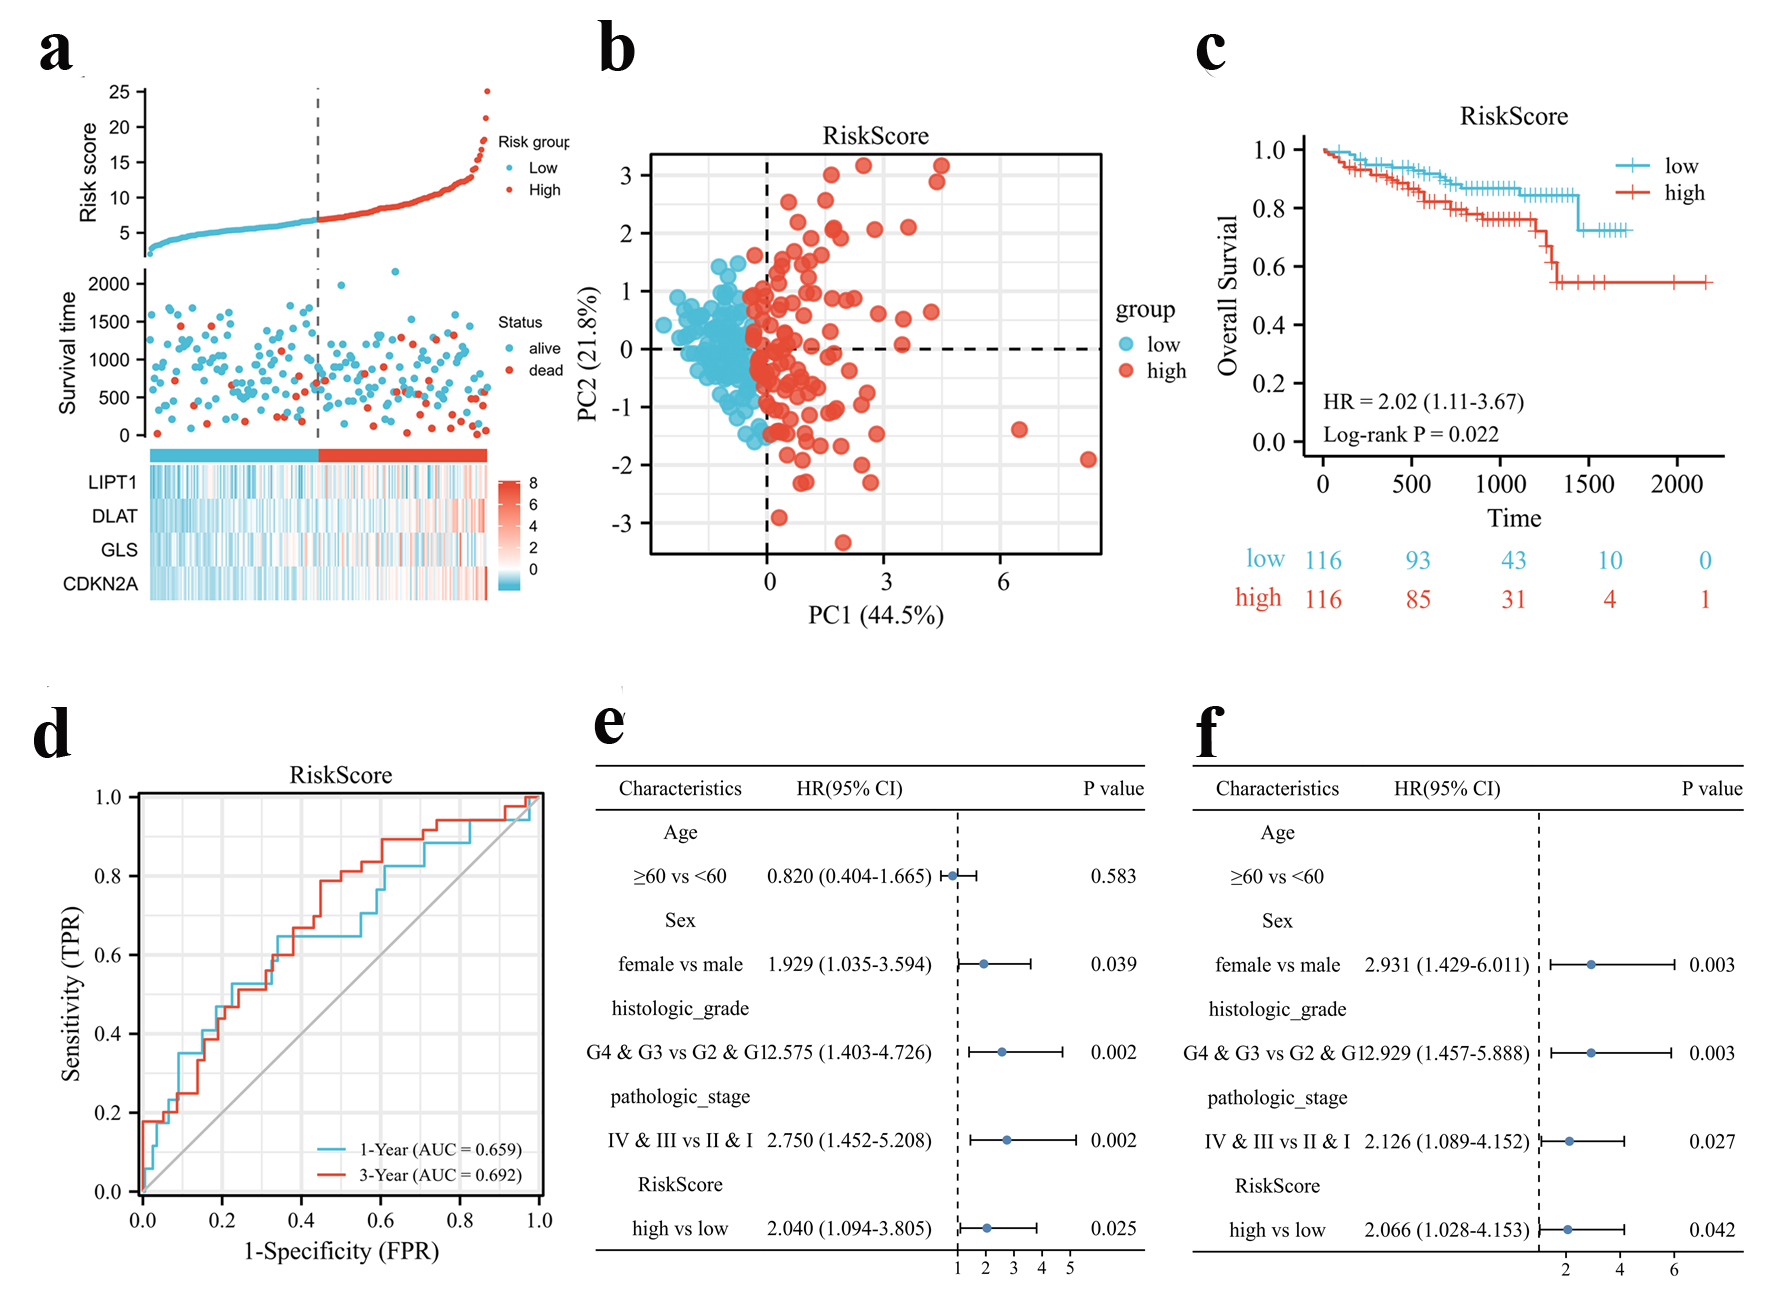
Figure 3. Validation of the CRGs signature in the ICGC cohort. (a) Risk scores based on CRGs prognostic signatures (above), survival of HCC patients with high- or low-risk scores (middle), and expression of four CRGs that constitute the prognostic signature in the ICGC cohort (below). (b) PCA analysis of high- and low-risk scores in the ICGC cohort. (c) Kaplan-Meier plot of OS between high- and low-risk score groups in the ICGC cohort. (d) Time-dependent ROC curves for the prognostic performance of the CRGs signature in the ICGC cohort. (e, f) Univariate (e) and multivariate (f) Cox regression analyses regarding OS evaluated the prognostic value of the CRGs signature and other factors in the ICGC cohort. HR: hazard ratio.
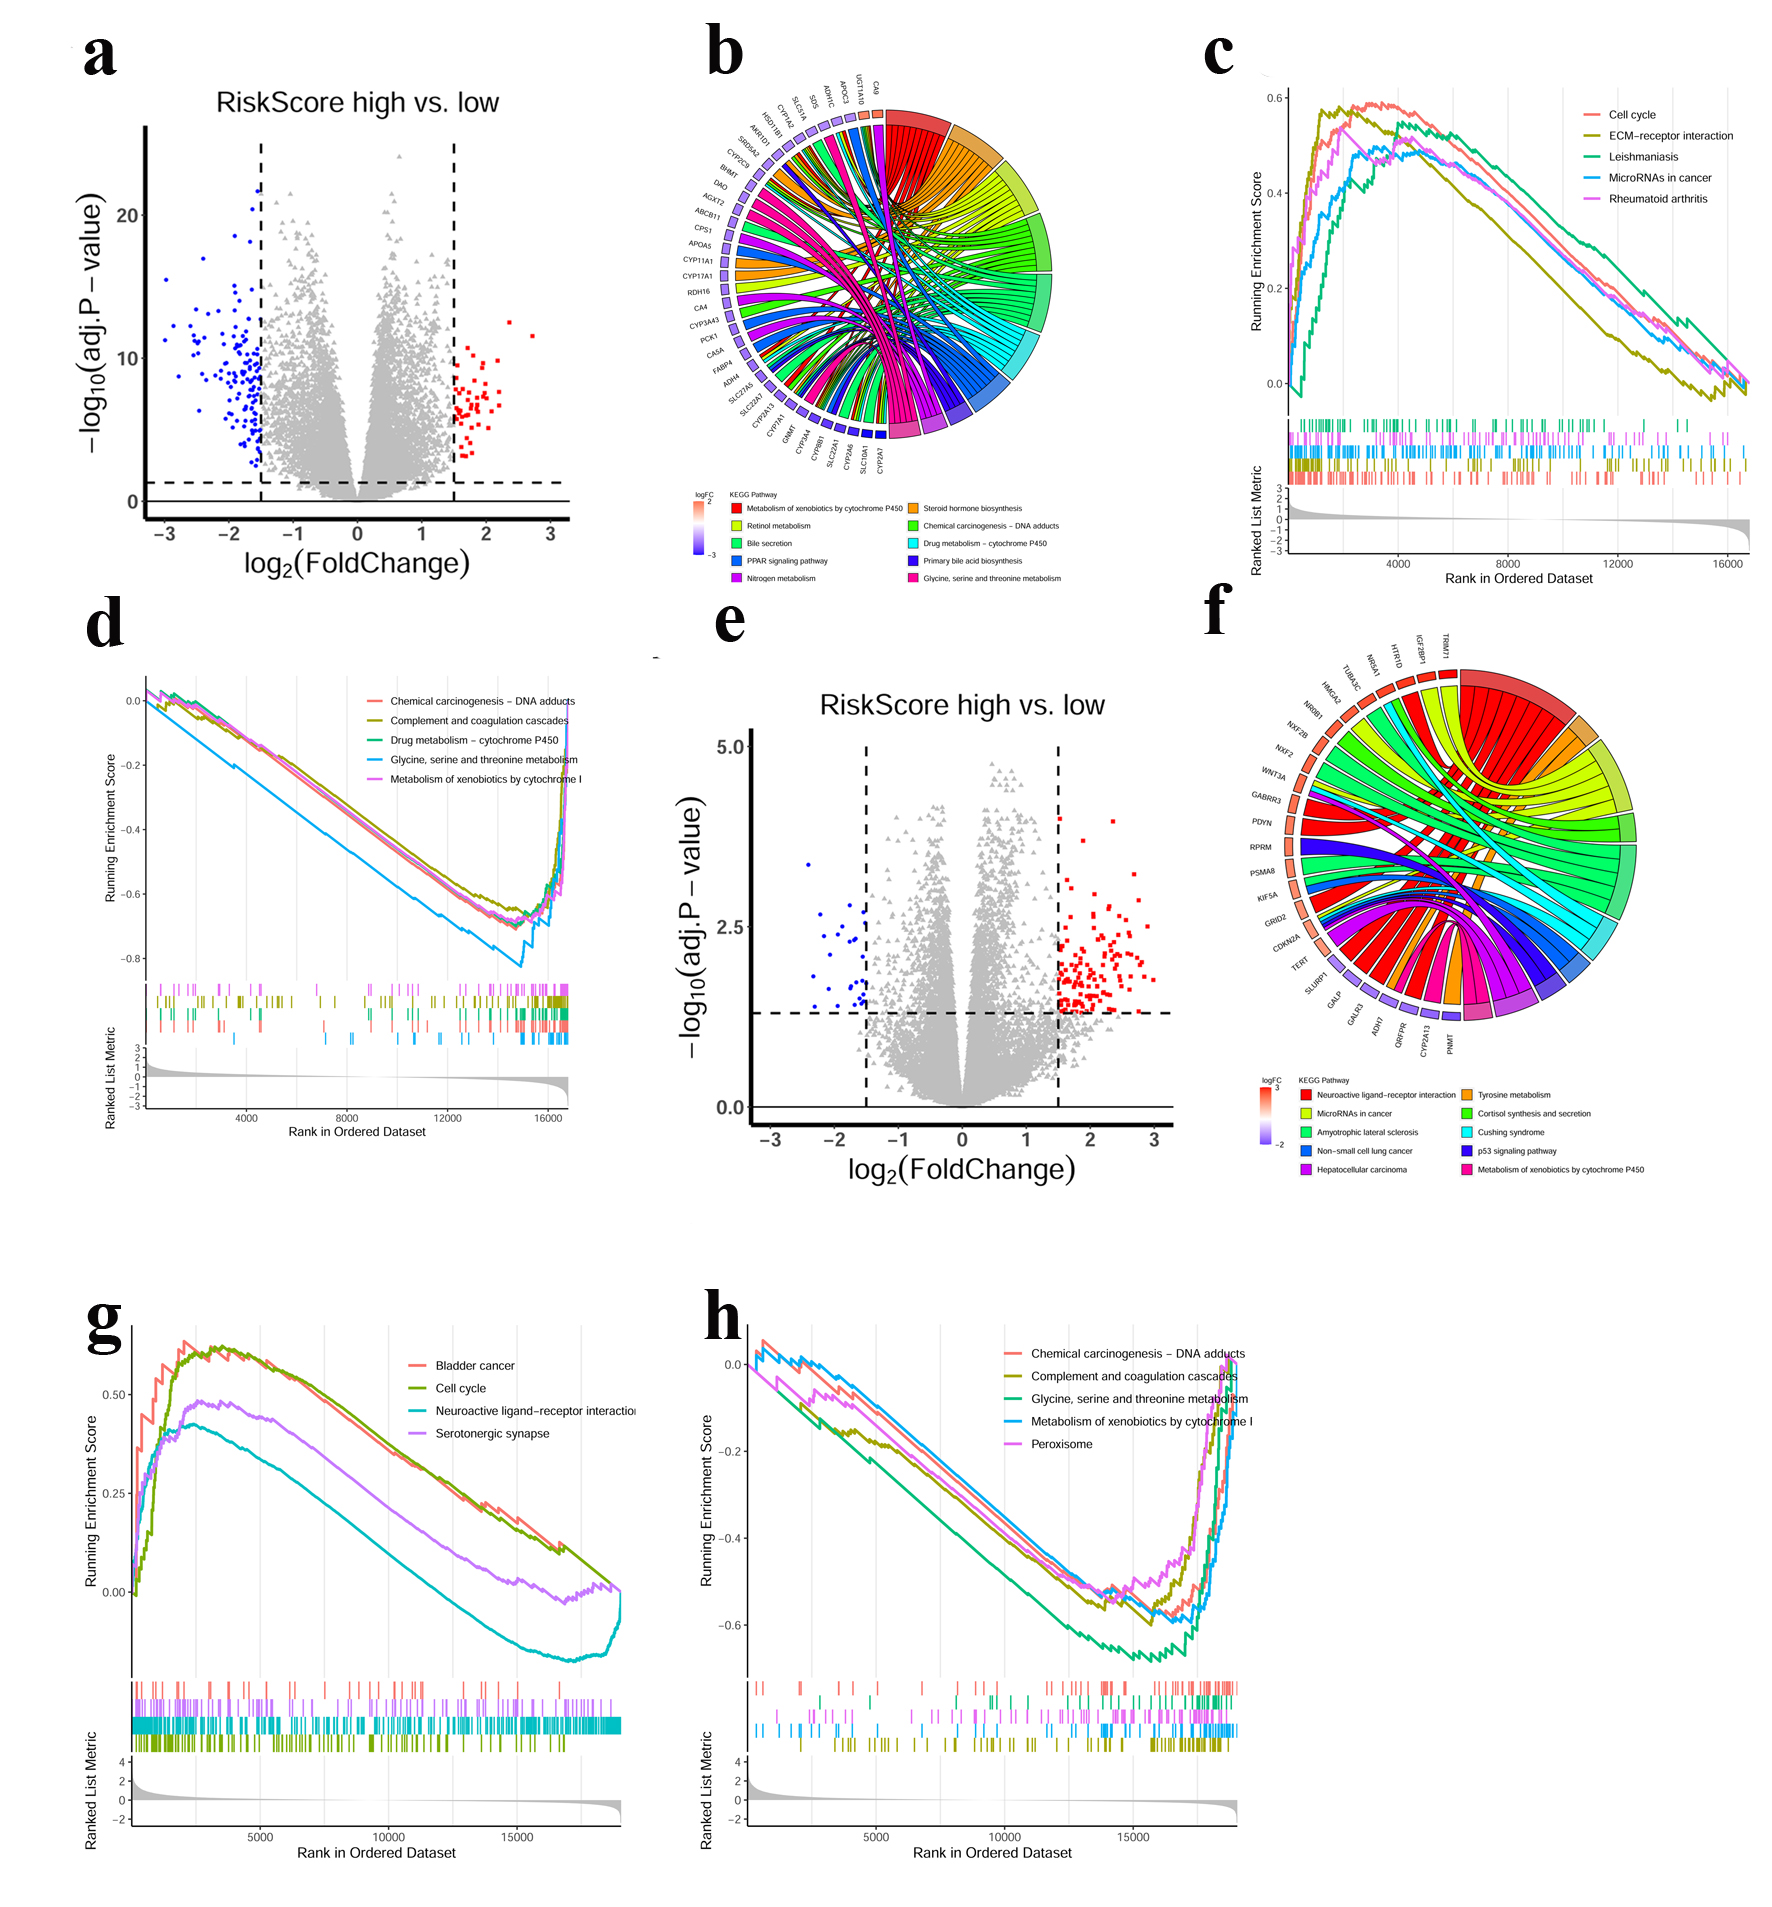
Figure 4. Functional annotations of the CRGs prognostic signature. (a) DEGs volcano plots between high- and low-risk score groups in the TCGA cohort. Each red dot indicates an up-regulated gene, and each blue dot indicates a down-regulated gene (Fold change > 1.5, adj. P < 0.05). (b) Circle plot showed the enriched KEGG pathways of DEGs between high- and low-risk score groups in the TCGA cohort. (c, d) GSEA analysis of DEGs in the TCGA cohort. Hallmarks that significantly enriched in the high (c) and low (d) risk score groups were shown. (e) DEGs volcano plots between high- and low-risk score groups in the ICGC cohort. Each red dot indicates an up-regulated gene, and each blue dot indicates a down-regulated gene (Fold change > 1.5, adj. P < 0.05). (f) Circle plot showed the enriched KEGG pathways for the DEGs between high- and low-risk score groups in the ICGC cohort. (g, h) GSEA analysis of DEGs in the ICGC cohort. Hallmarks that significantly enriched in the high (g) and low (h) risk score groups were shown.
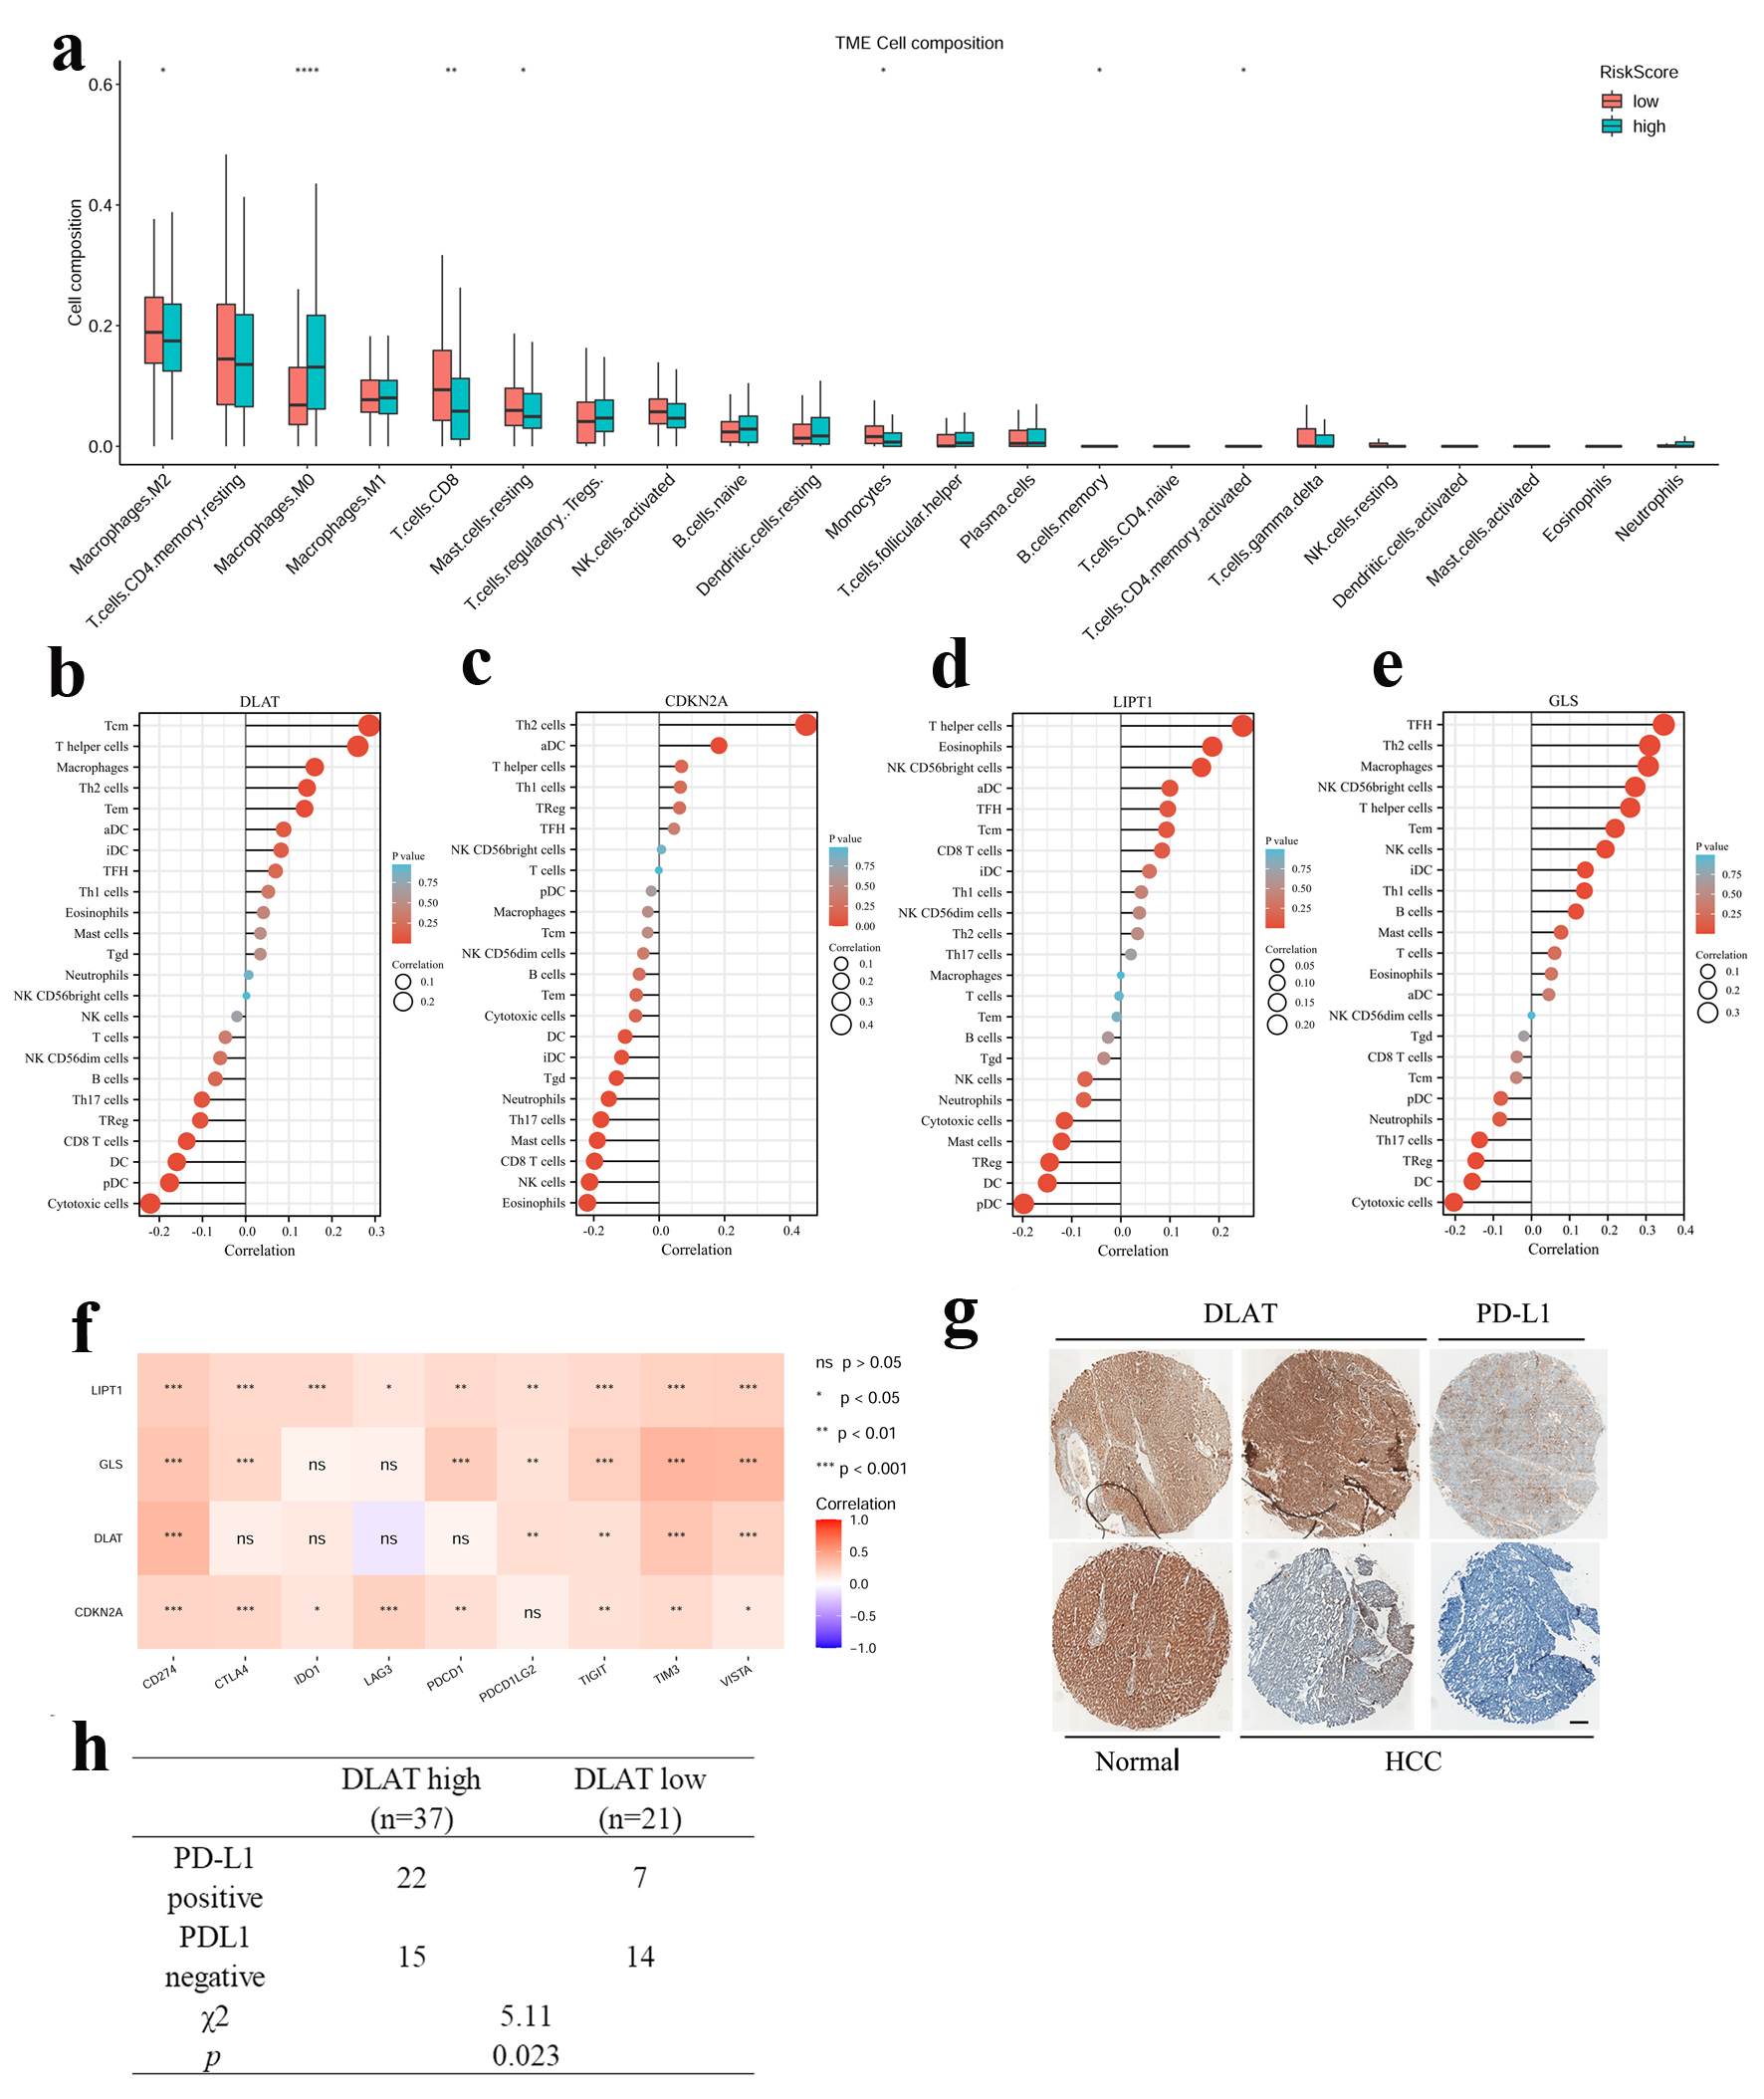
Figure 5. Relevance between four CRGs signature and the immune microenvironment. (a) Compare of 22 immune infiltrates between high -and low-risk score HCC samples. Wilcoxon rank sum test was used for the significance test (*P < 0.05, **P < 0.01, ***P < 0.001). (b-e) Lollipop chart showed the correlation of four CRGs with tumor infiltration cells (TICs) proportion in HCC. (f) The correlation between four CRGs and immune checkpoint related genes. (g) Representative image of IHC staining of DLAT and PD-L1 in HCC and paratumor normal tissues. Up: DLAT high, PD-L1 positive. Down: DLAT low, PD-L1 negative. Scale bar = 100 µm. (h) The correlation between DLAT and PD-L1 expression in 58 HCC patients.
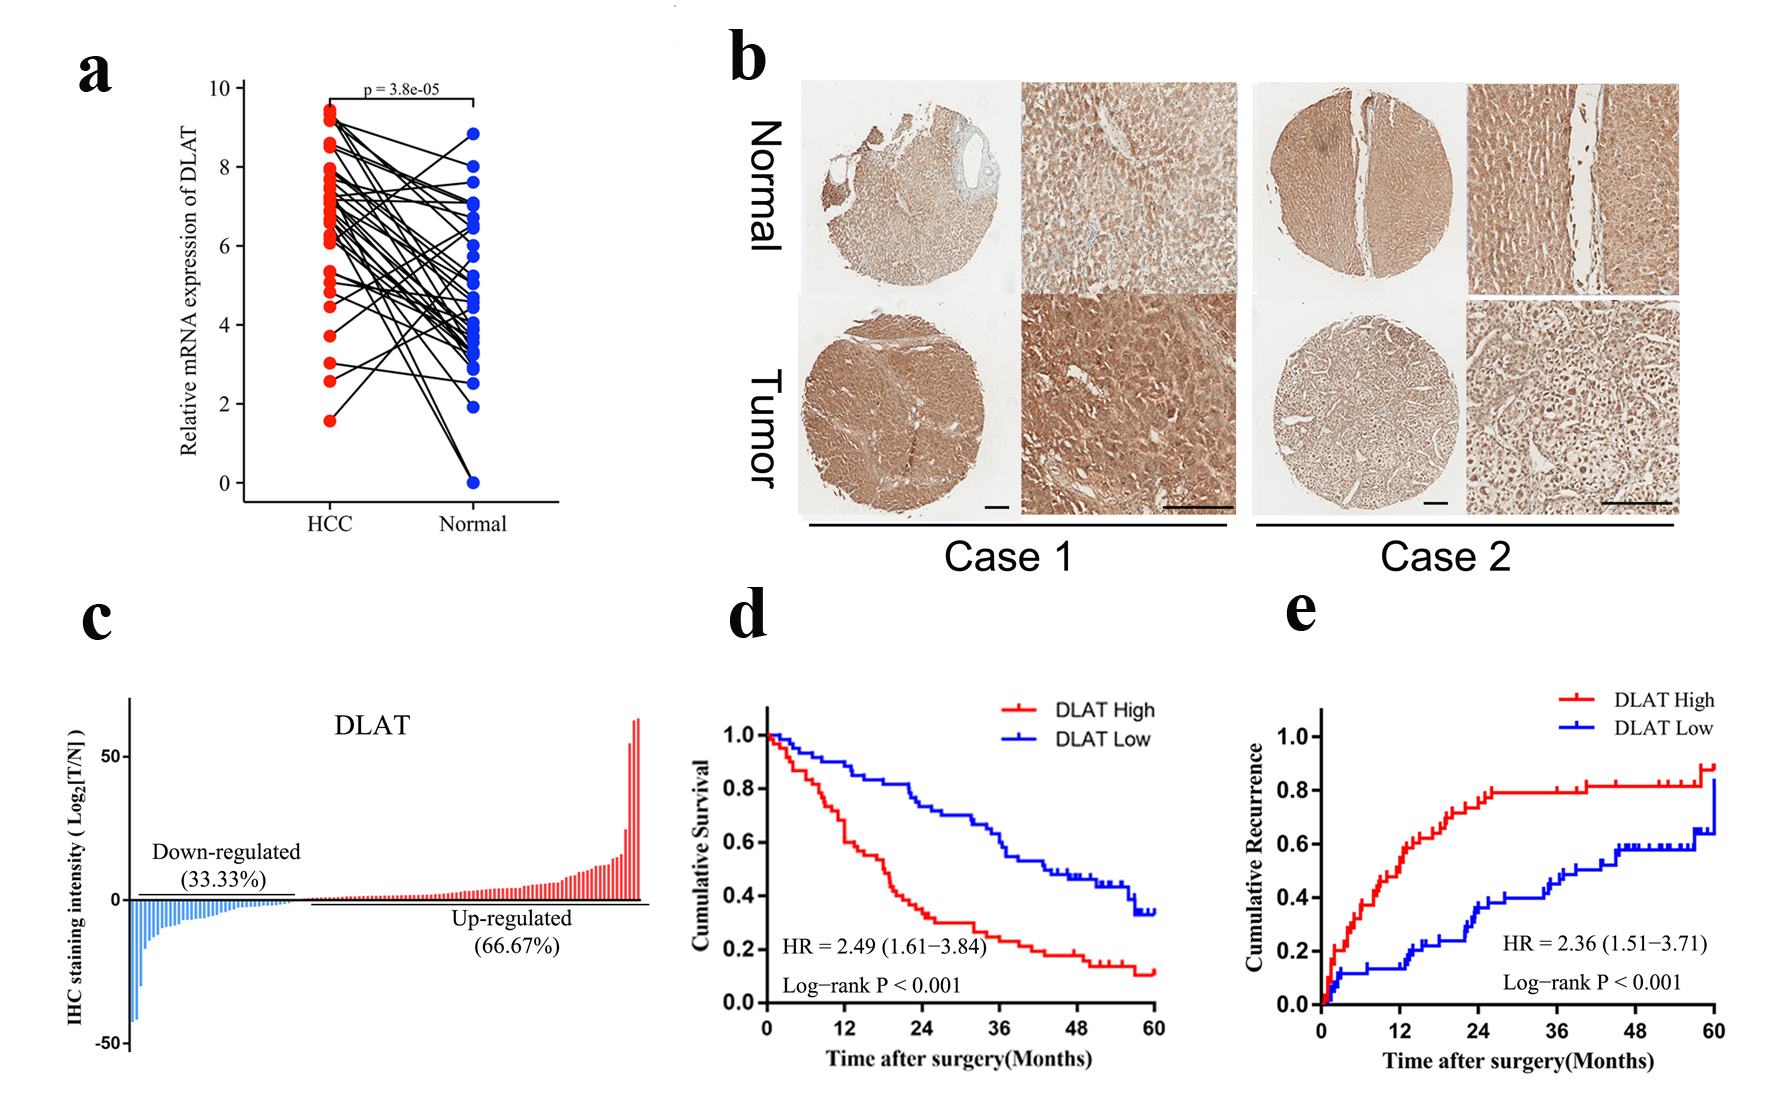
Figure 6. DLAT was highly expressed and associated with poor prognosis in HCC specimens. (a) mRNA expression of DLAT in 36 pairs of HCC and paratumor normal tissues were determined by real-time PCR. (b) Representative IHC staining of DLAT expression in cohort 1. Scale bar = 100 µm. (c) DLAT was up-regulated in the majority of HCC patients (66.67%). (d, e) OS (d) and RFS (e) of HCC patients after surgery were compared between the “high DLAT” and “low DLAT” groups using Kaplan-Meier analysis.