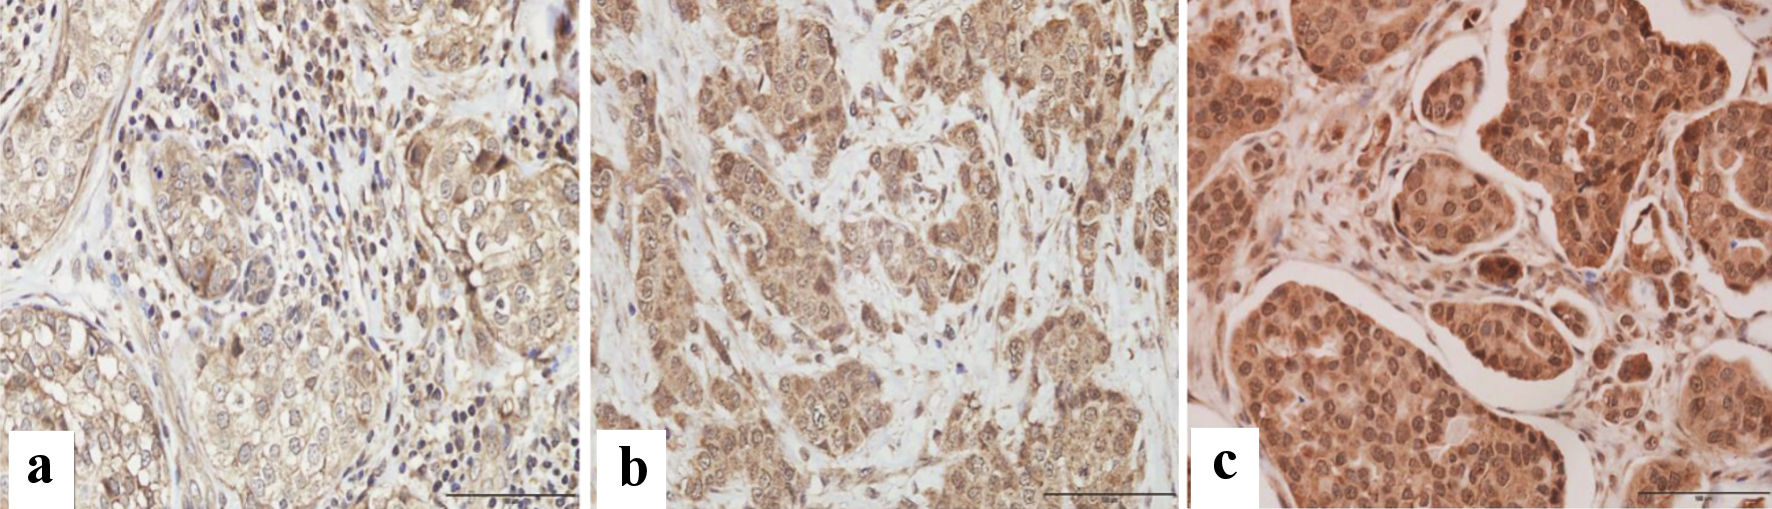
Figure 1. Immunohistochemical assessment of VDR expression in paraffin-embedded breast cancer tissues. Microscopic images showing various degrees of intensity: (a) mild, (b) moderate, and (c) strong VDR expression. Images were captured at × 400 magnification, with a scale bar representing 100 µm.
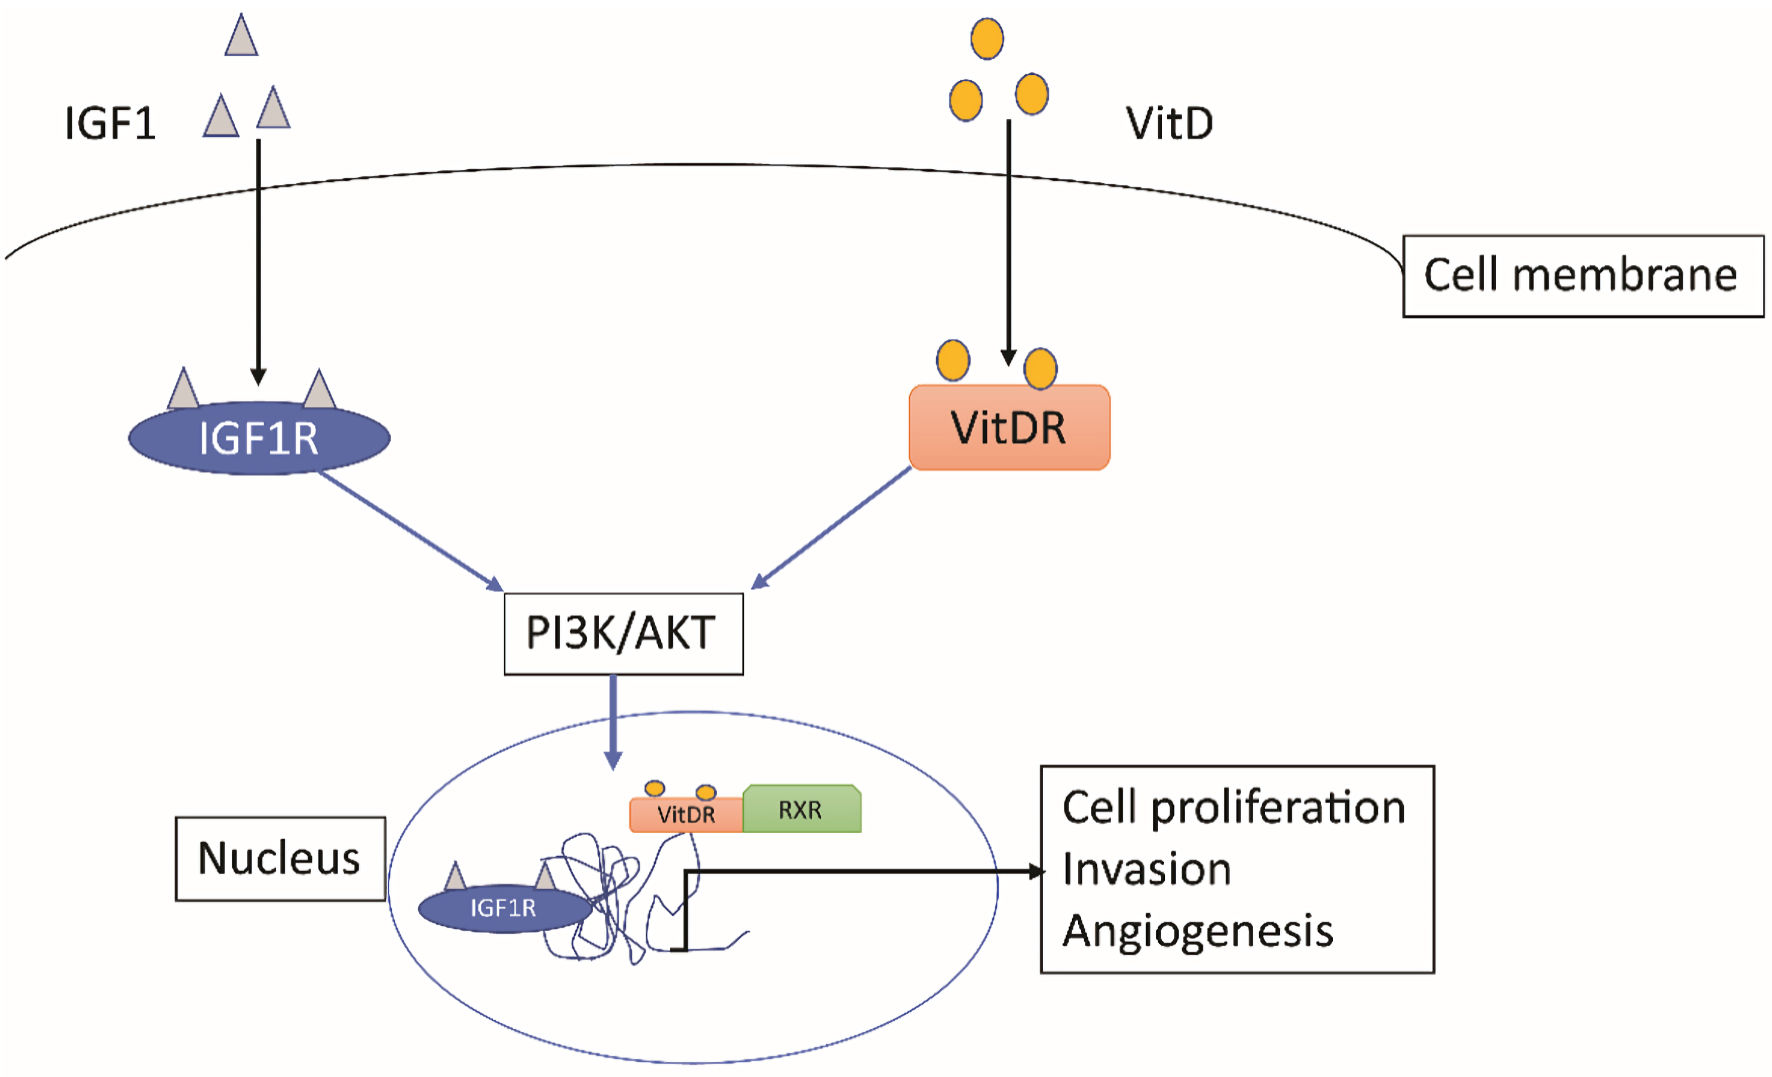
Figure 2. Signaling mechanism for IGF1R and VDR in a cancer cell. Both pathways involve PI3K/AKT pathway to localize to nucleus and act as transcription factors for genes involved in cell proliferation, invasion, and angiogenesis. VDR: vitamin D receptor; IGFIR: insulin-like growth factor 1 receptor; VitD: vitamin D.