Figures
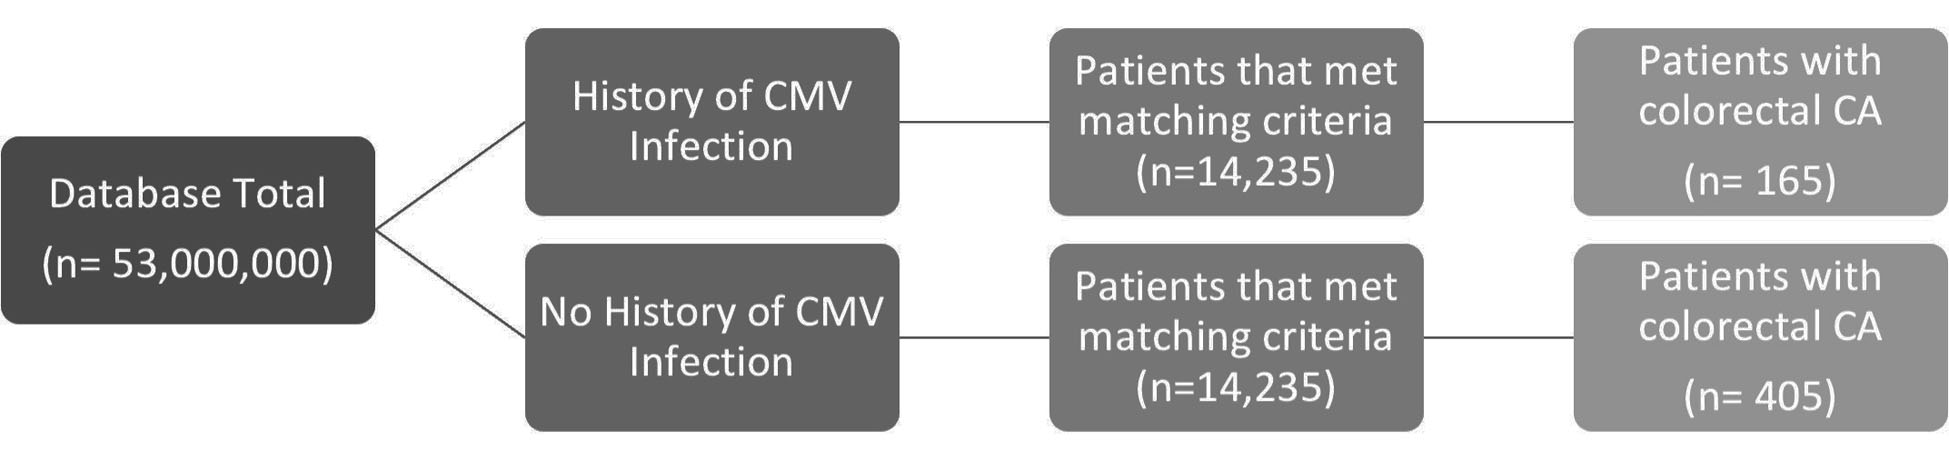
Figure 1. Analysis of the incidence of colorectal CA in groups matched for age range, sex, and CCI, of patients with history of CMV infection versus the control group. CCI: Charlson Comorbidity Index; CMV: cytomegalovirus; CA: cancer.
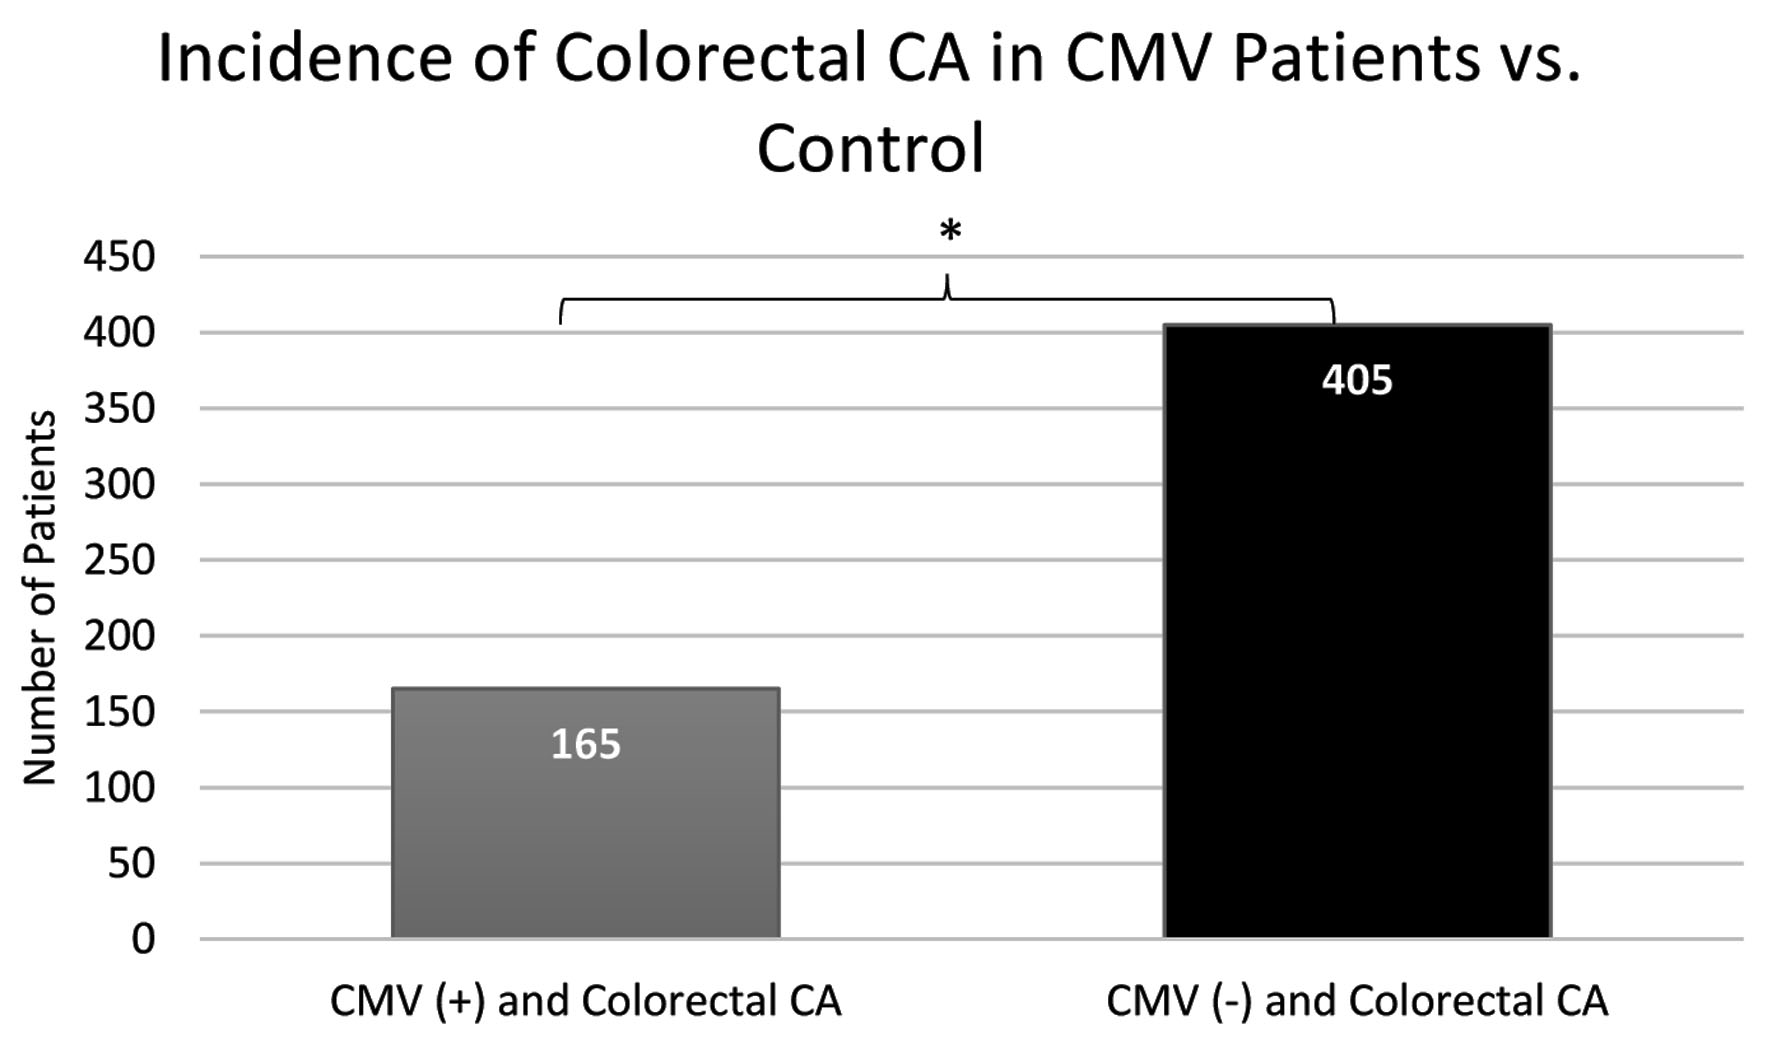
Figure 2. A notable increase in incidence of colorectal CA in patients not previously infected with CMV (405 patients) in comparison to patients previously infected with CMV (165 patients). CMV: cytomegalovirus; CA: cancer.
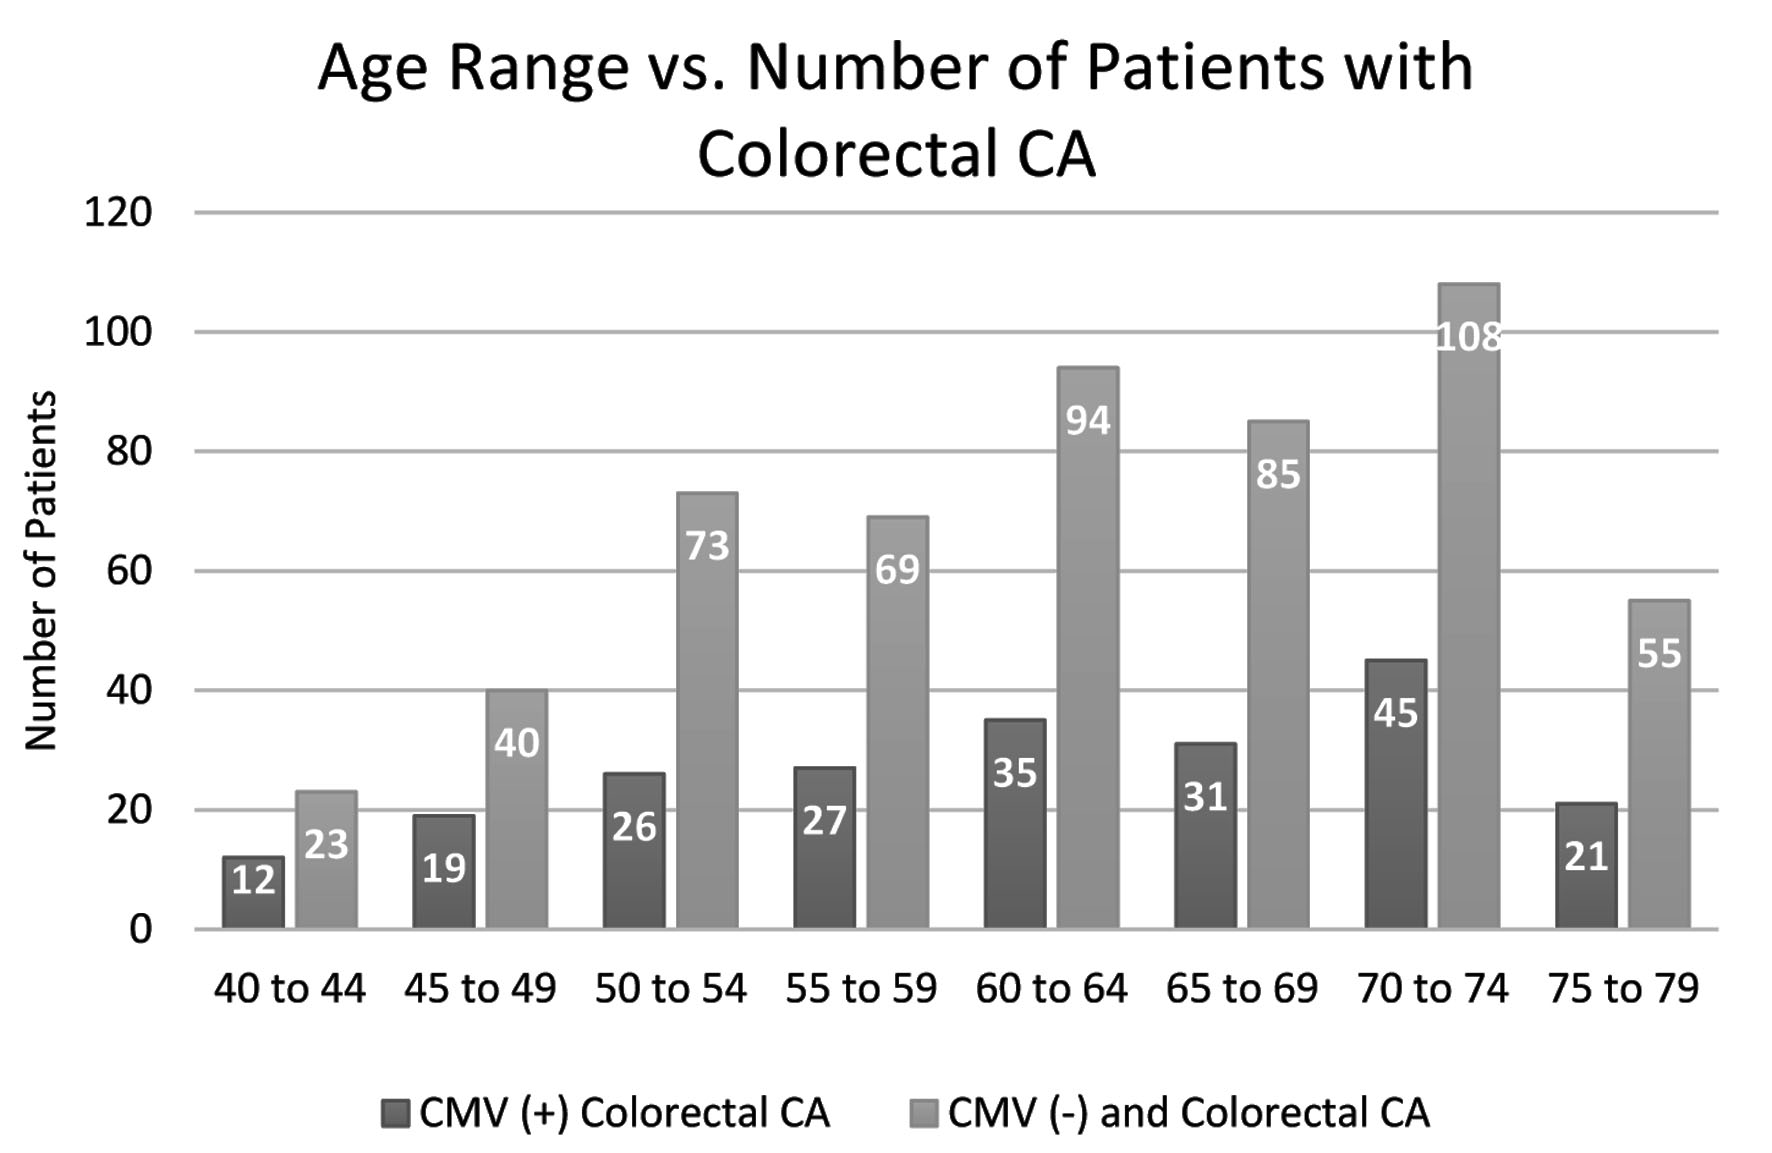
Figure 3. Distribution by age of colorectal CA patients in both the CMV(+) and CMV(-) groups. Patients not previously infected show consistently higher volumes of patients with colorectal CA over all ages and both groups peak in the age range 70 - 74. CMV: cytomegalovirus; CA: cancer.
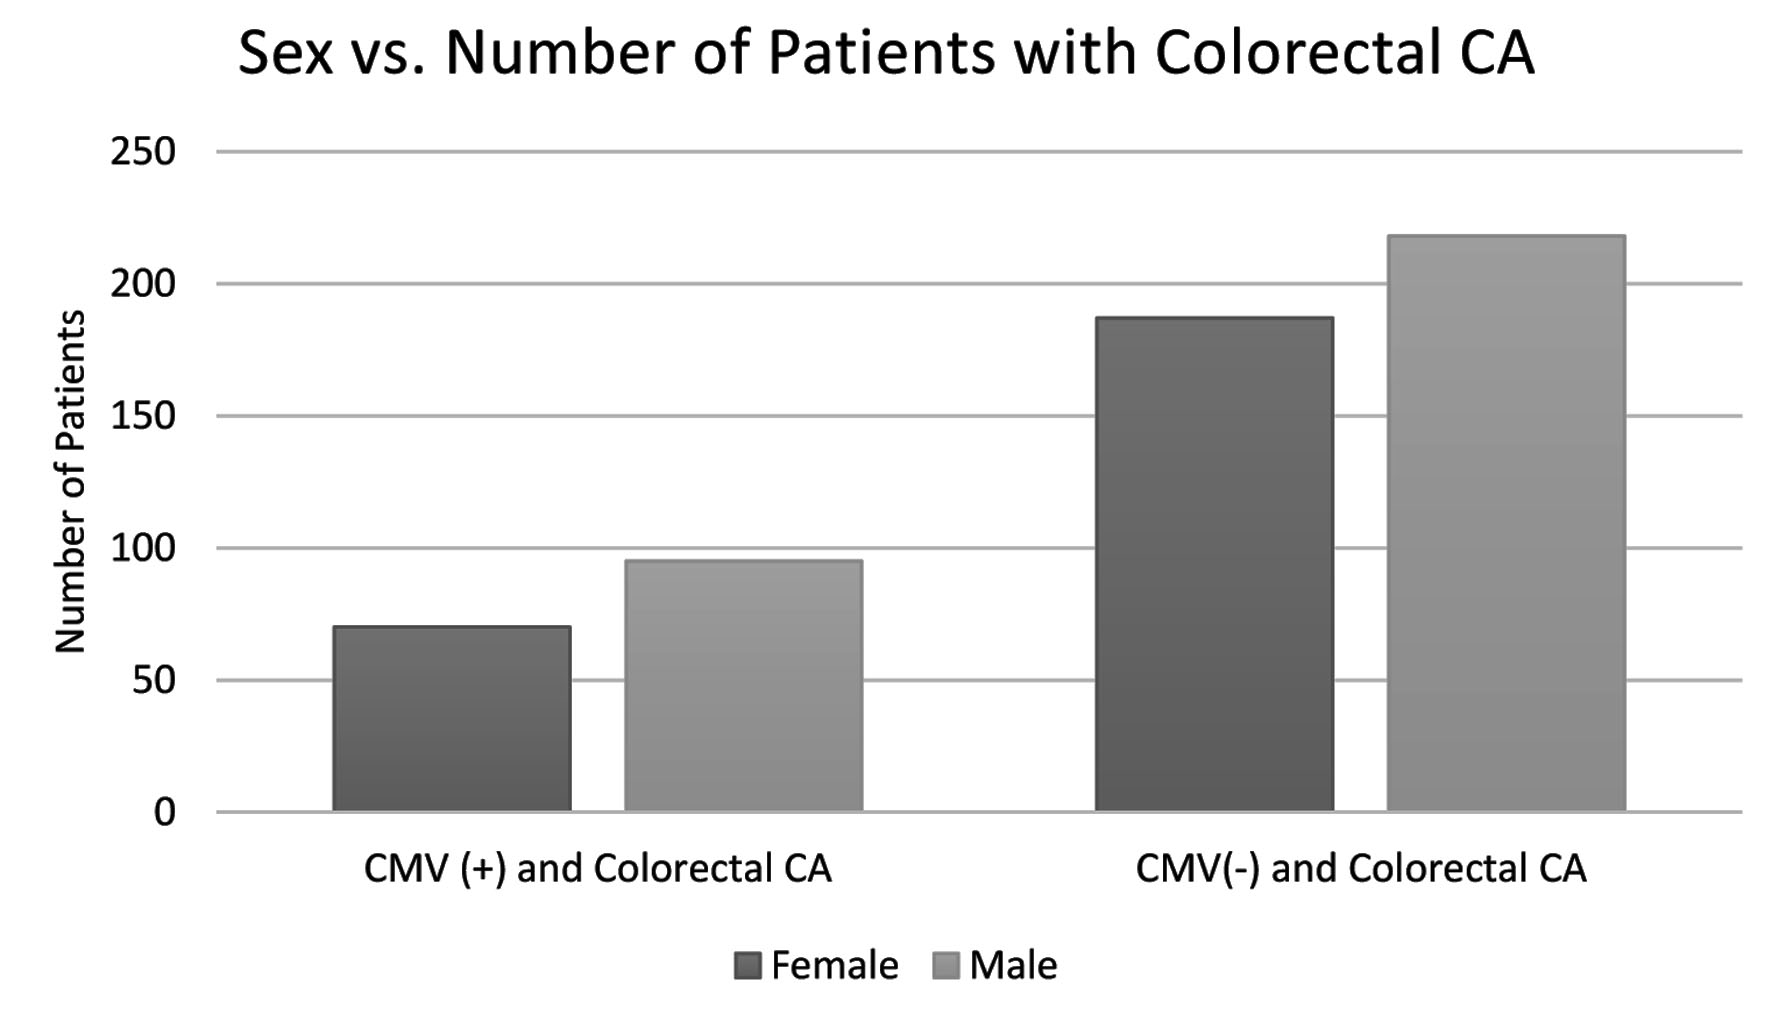
Figure 4. Distribution in incidence of colorectal CA in both the CMV(+) and CMV(-) groups separated by sex. Males display a higher incidence of colorectal CA in both groups. CMV: cytomegalovirus; CA: cancer.
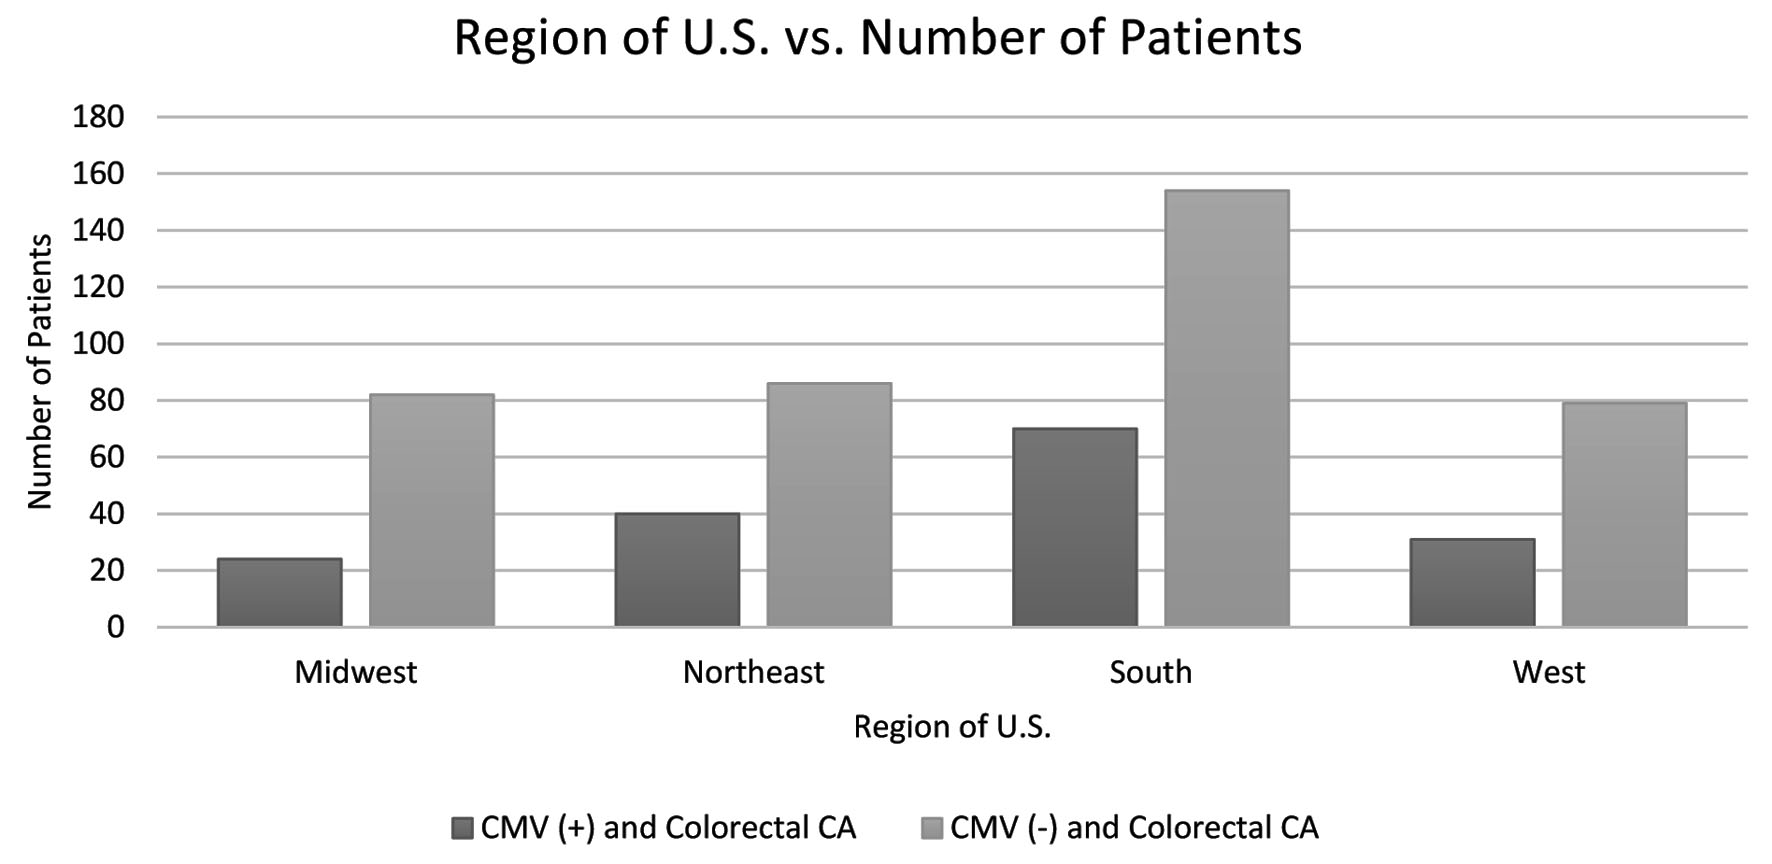
Figure 5. The difference in incidence of colorectal CA in both the CMV(+) and CMV(-) groups separated by region of the USA. Patients located in the southern region display the highest incidence of colorectal CA in both groups. CMV: cytomegalovirus; CA: cancer.
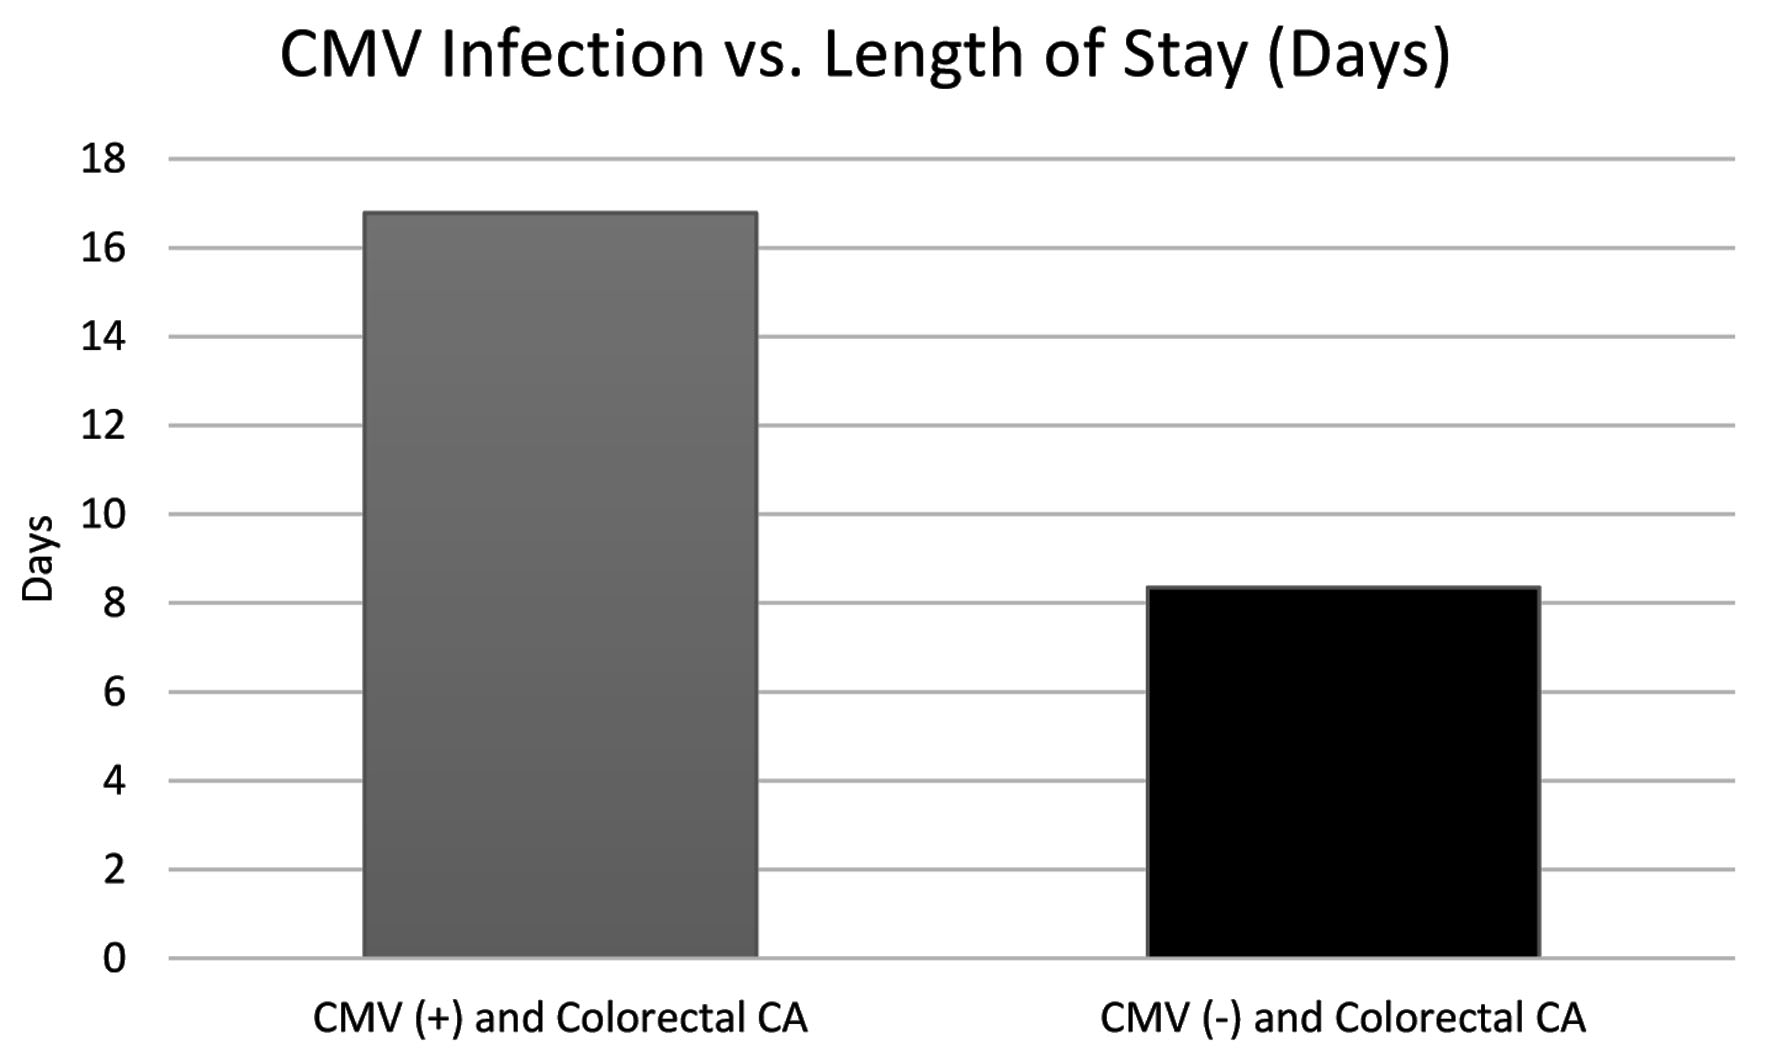
Figure 6. The difference (in days) in length of stay for treatment in both the CMV(+) and CMV(-) groups. The CMV(+) group displays a stay nearly twice as long as the CMV(-) group. CA: cancer; CMV: cytomegalovirus.