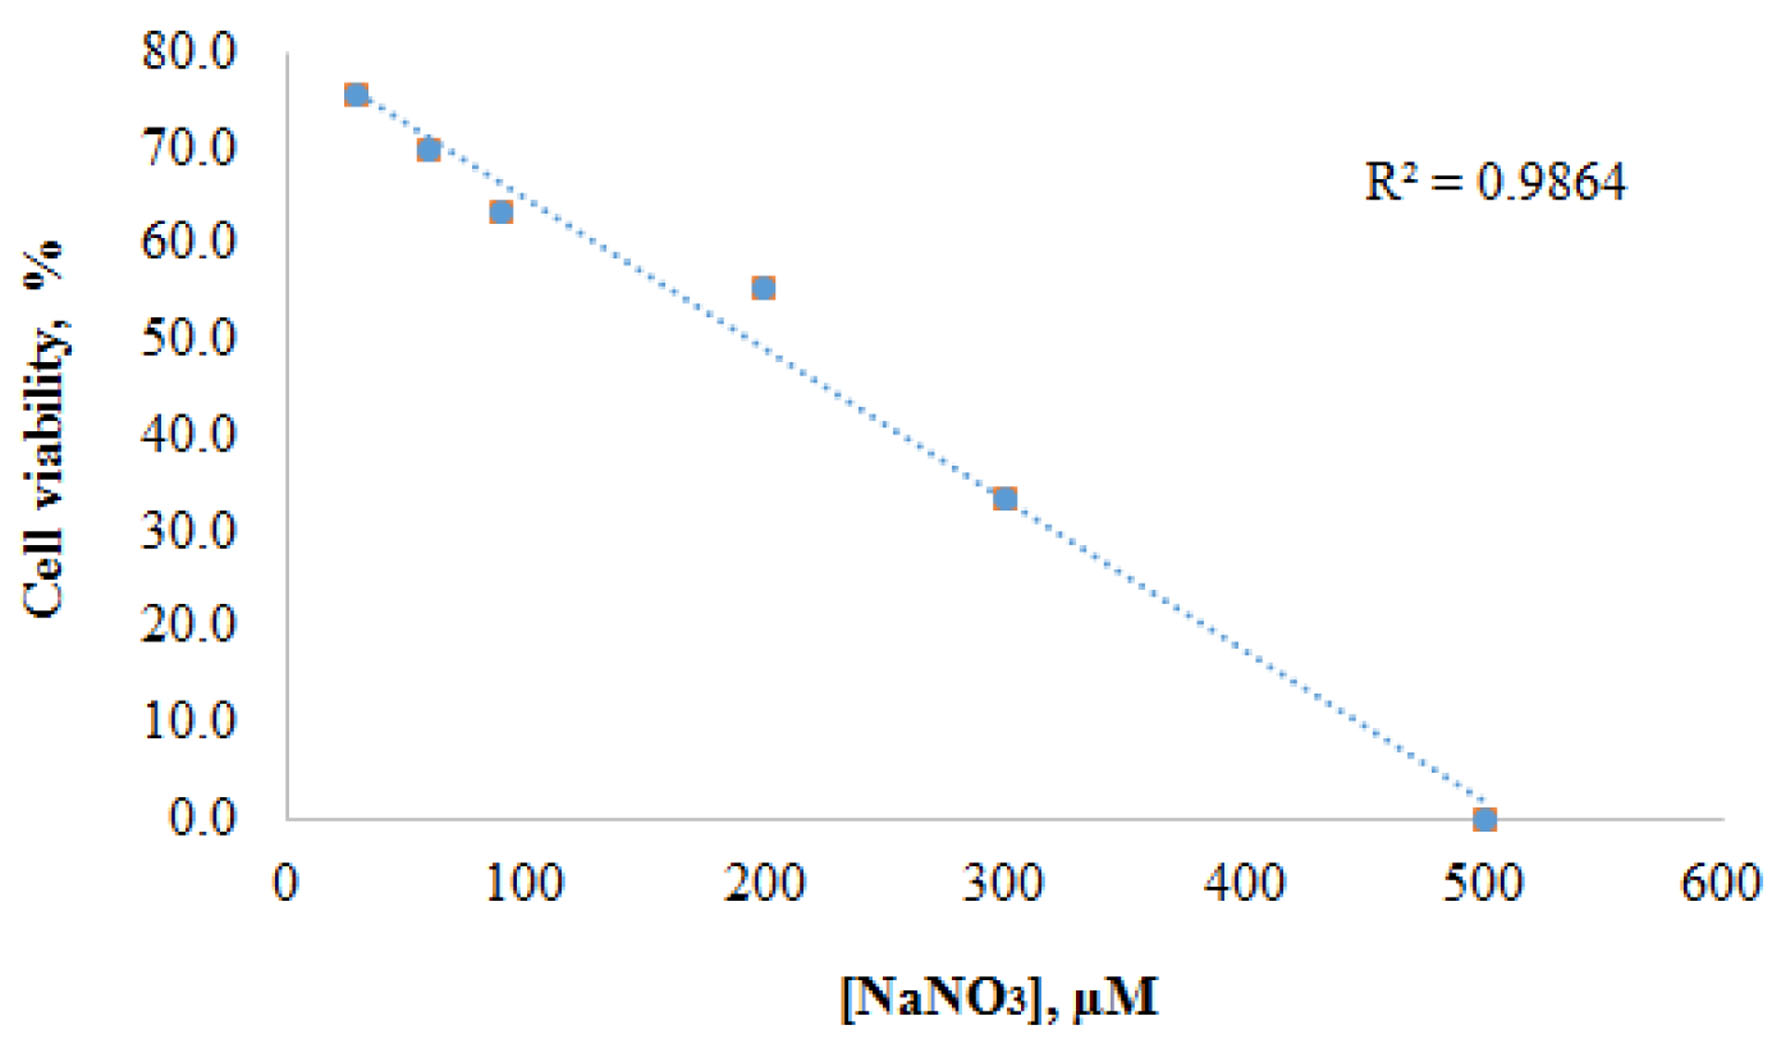
Figure 1. Correlation between concentrations of NaNO3 and cell viabilities of normal bladder cells (PdECs) after 48 h.
| World Journal of Oncology, ISSN 1920-4531 print, 1920-454X online, Open Access |
| Article copyright, the authors; Journal compilation copyright, World J Oncol and Elmer Press Inc |
| Journal website https://www.wjon.org |
Original Article
Volume 15, Number 1, February 2024, pages 38-44
Viability Profiles of Normal and Cancer Bladder Cells With Metformin, Nitrate and Adenosine Monophosphate-Activated Protein Kinase Inhibitor
Figures
Tables
| Concentration, µM | NaNO3 | Metformin |
|---|---|---|
| Each value is the average values of three runs. | ||
| Control | 82.3 | 66.4 |
| 30 | 75.7 | |
| 60 | 69.6 | |
| 90 | 63.4 | |
| 200 | 55.4 | |
| 300 | 33.5 | |
| 500 | 0.0 | |
| 1.0 × 10³ | 65.4 | |
| 5.0 × 10³ | 63.1 | |
| 1.0 × 10⁴ | 63.6 | |
| Concentration, µM | 24 h | 48 h | ||||
|---|---|---|---|---|---|---|
| NaNO3, % | Met, % | Both, % | NaNO3, % | Met, % | Both, % | |
| Each value is the average value of three runs. | ||||||
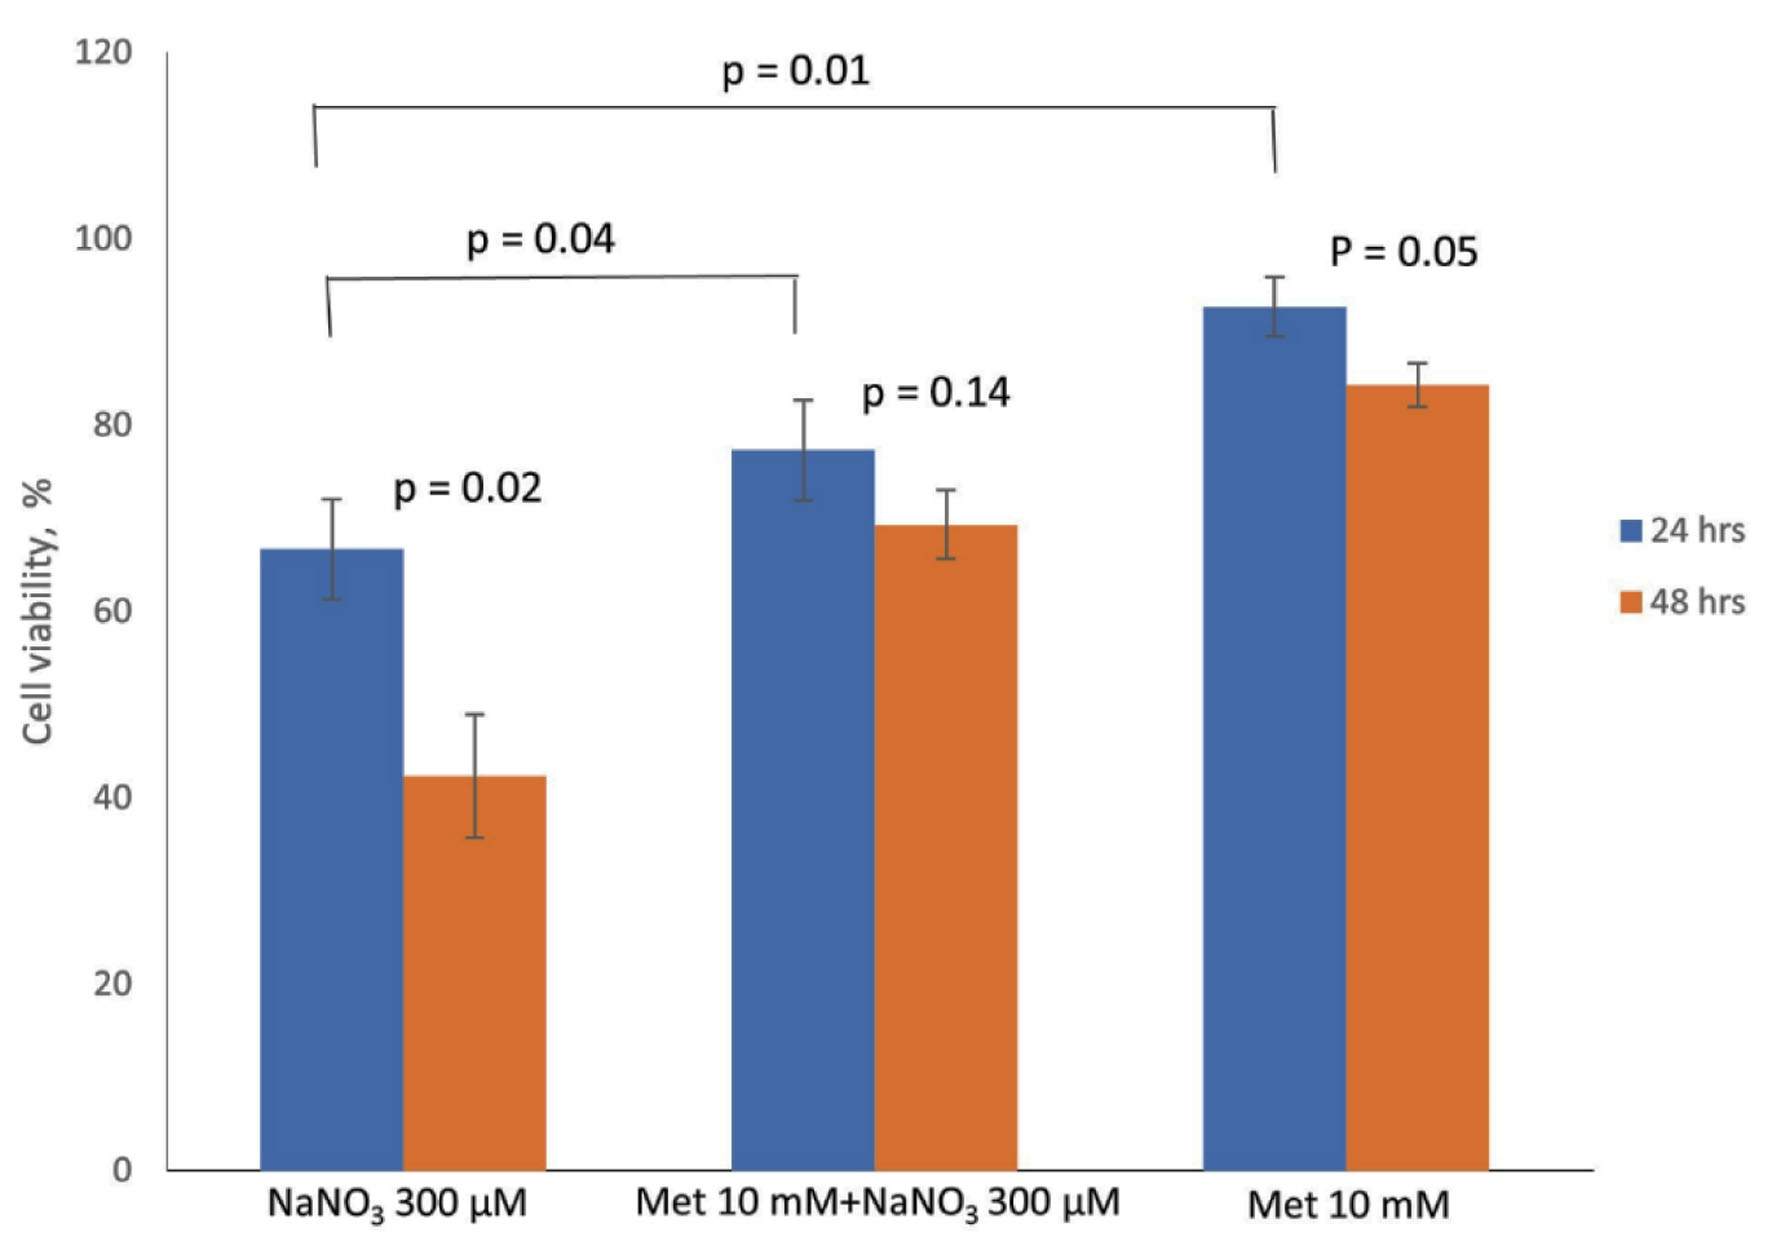
| Control | 93.3 | 93.3 | 93.3 | 86.0 | 86.0 | 86.0 |
| 300 µM NaNO3 | 66.7 | 42.7 | ||||
| 1.0 × 10³ µM metformin | 92.7 | 84.3 | ||||
| Both | 77.0 | 69.3 | ||||
| Δ in cell viability | 26.6 | 0.6 | 16.3 | 43.3 | 1.7 | 16.7 |
| Addition order | Cell viability, % | Δ in cell viability, %b |
|---|---|---|
| Each value is the average value of three runs. aIncubation time. bEach value is calculated as control minus the experiment. | ||
| (a) Control | 92.0 | |
| (b) 300 µM NaNO3 | 23.3 | 68.7 |
| (c) 1.0 × 10³ µM metformin | 91.7 | 0.3 |
| (d) 1.0 × 10³ µM compound C | 88.7 | 3.3 |
| (e) 300 µM NaNO3 (24 h)a, 1.0 × 10³ µM metformin (48 h)a | 84.3 | 7.7 |
| (f) 1.0 × 10³ µM metformin (24 h)a, 300 µM NaNO3 (48 h)a | 84.0 | 8.0 |
| (g) 1.0 × 10³ compound C (6 h pre-treatment)a, 300 µM NaNO3 (24 h)a, 1.0 × 10³ µM metformin (48 h)a | 55.3 | 36.7 |
| (h) 1.0 × 10³ compound C (6 h pre-treatment)a, 1.0 × 10³ µM metformin (24 h)a, 300 µM NaNO3 (48 h)a | 56.0 | 36.0 |
| Concentration, µM | Cell viability, % | Δ in cell viability, % |
|---|---|---|
| Each value is the average value of three runs. | ||
| Control | 91.3 | |
| 1.0 × 10³ | 81.3 | 10.0 |
| 5.0 × 10³ | 74.9 | 16.4 |
| 1.0 × 10⁴ | 42.0 | 49.3 |