Figures
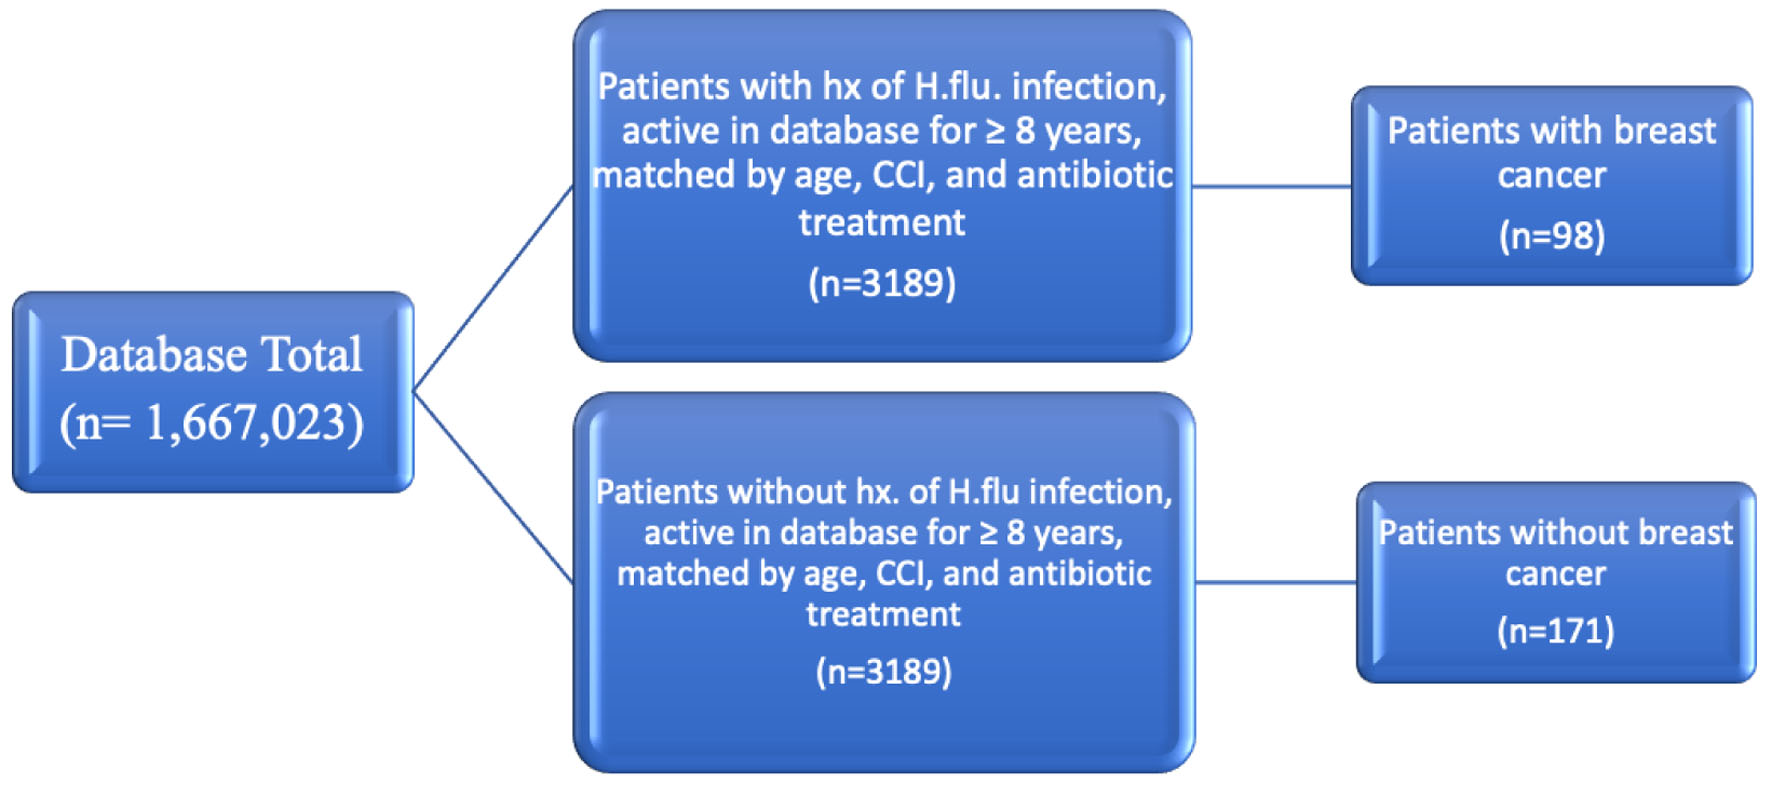
Figure 1. Diagram depicting grouping of patients matched by age range, CCI, and antibiotic treatment. CCI: Charlson Comorbidity Index.
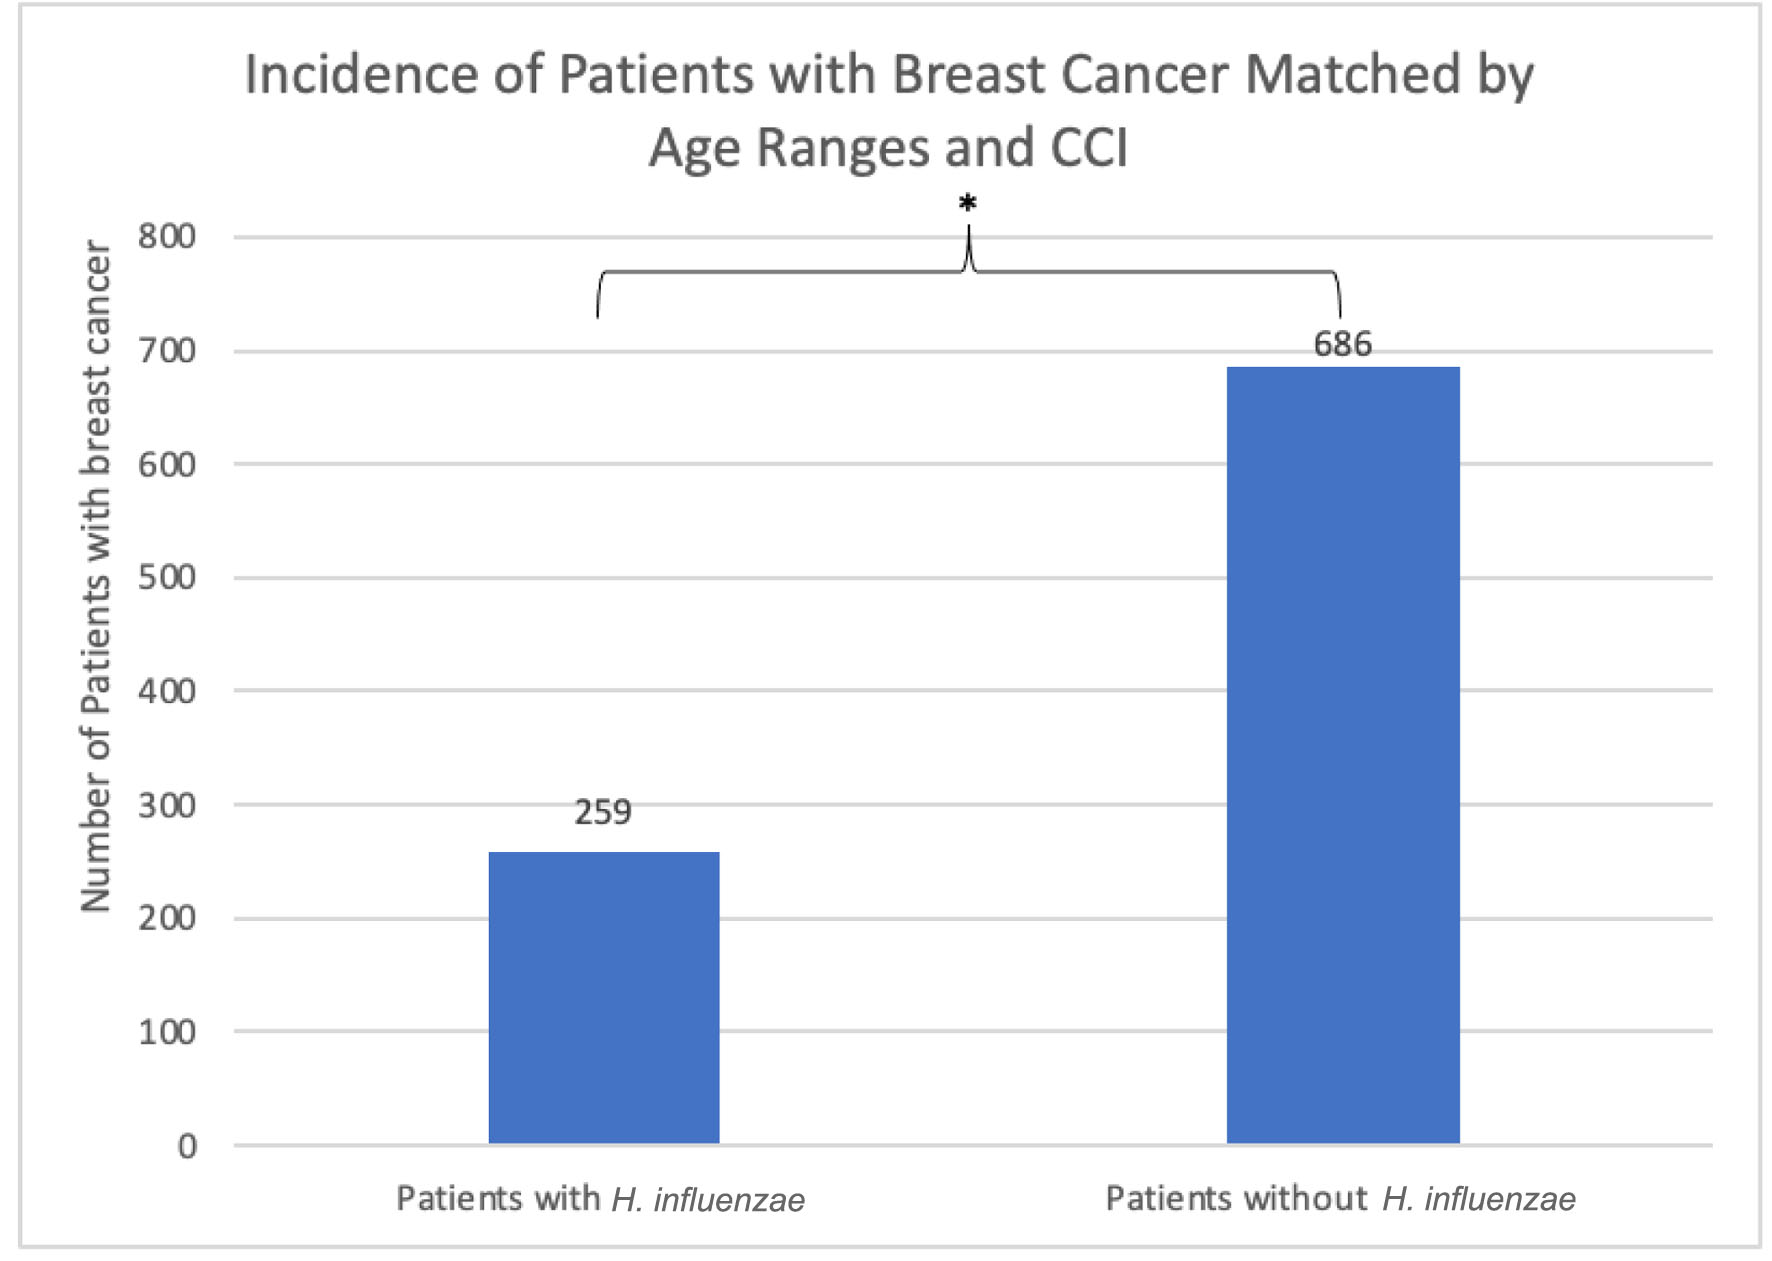
Figure 2. The incidence of breast cancer was 259 (1.905%) in the H. influenzae group compared to 686 (5.044%) in the control group. This difference was statistically significant by P < 2.2 × 10⁻¹⁶ (OR = 0.604, 95% CI: 0.553 - 0.660). OR: odds ratio; CI: confidence interval; H. influenzae: Hemophilus influenzae.
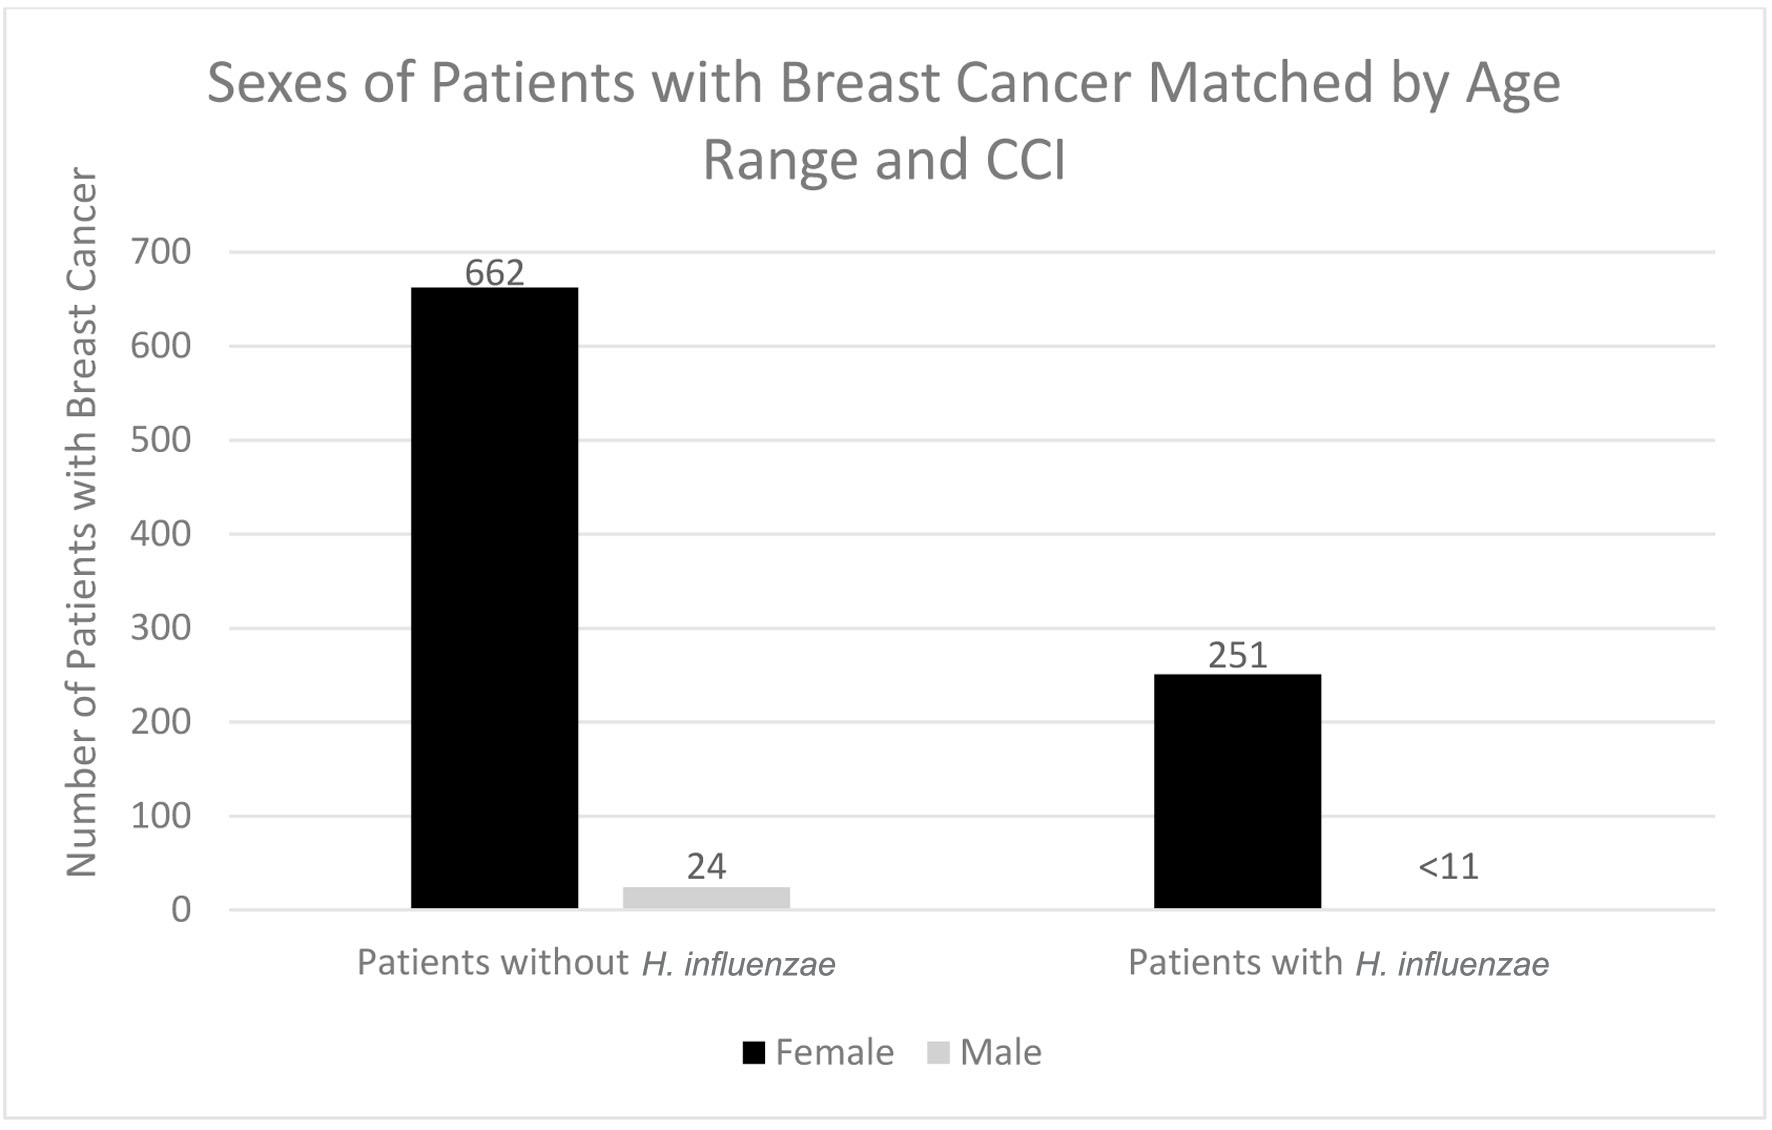
Figure 3. Sexes of patients with and without previous H. influenzae infection who developed breast cancer. In the experimental group for males, < 11 signifies that there were less than 11 patients in this subset of data. The exact number of patients could not be provided because of HIPPA constraints. H. influenzae: Hemophilus influenzae.
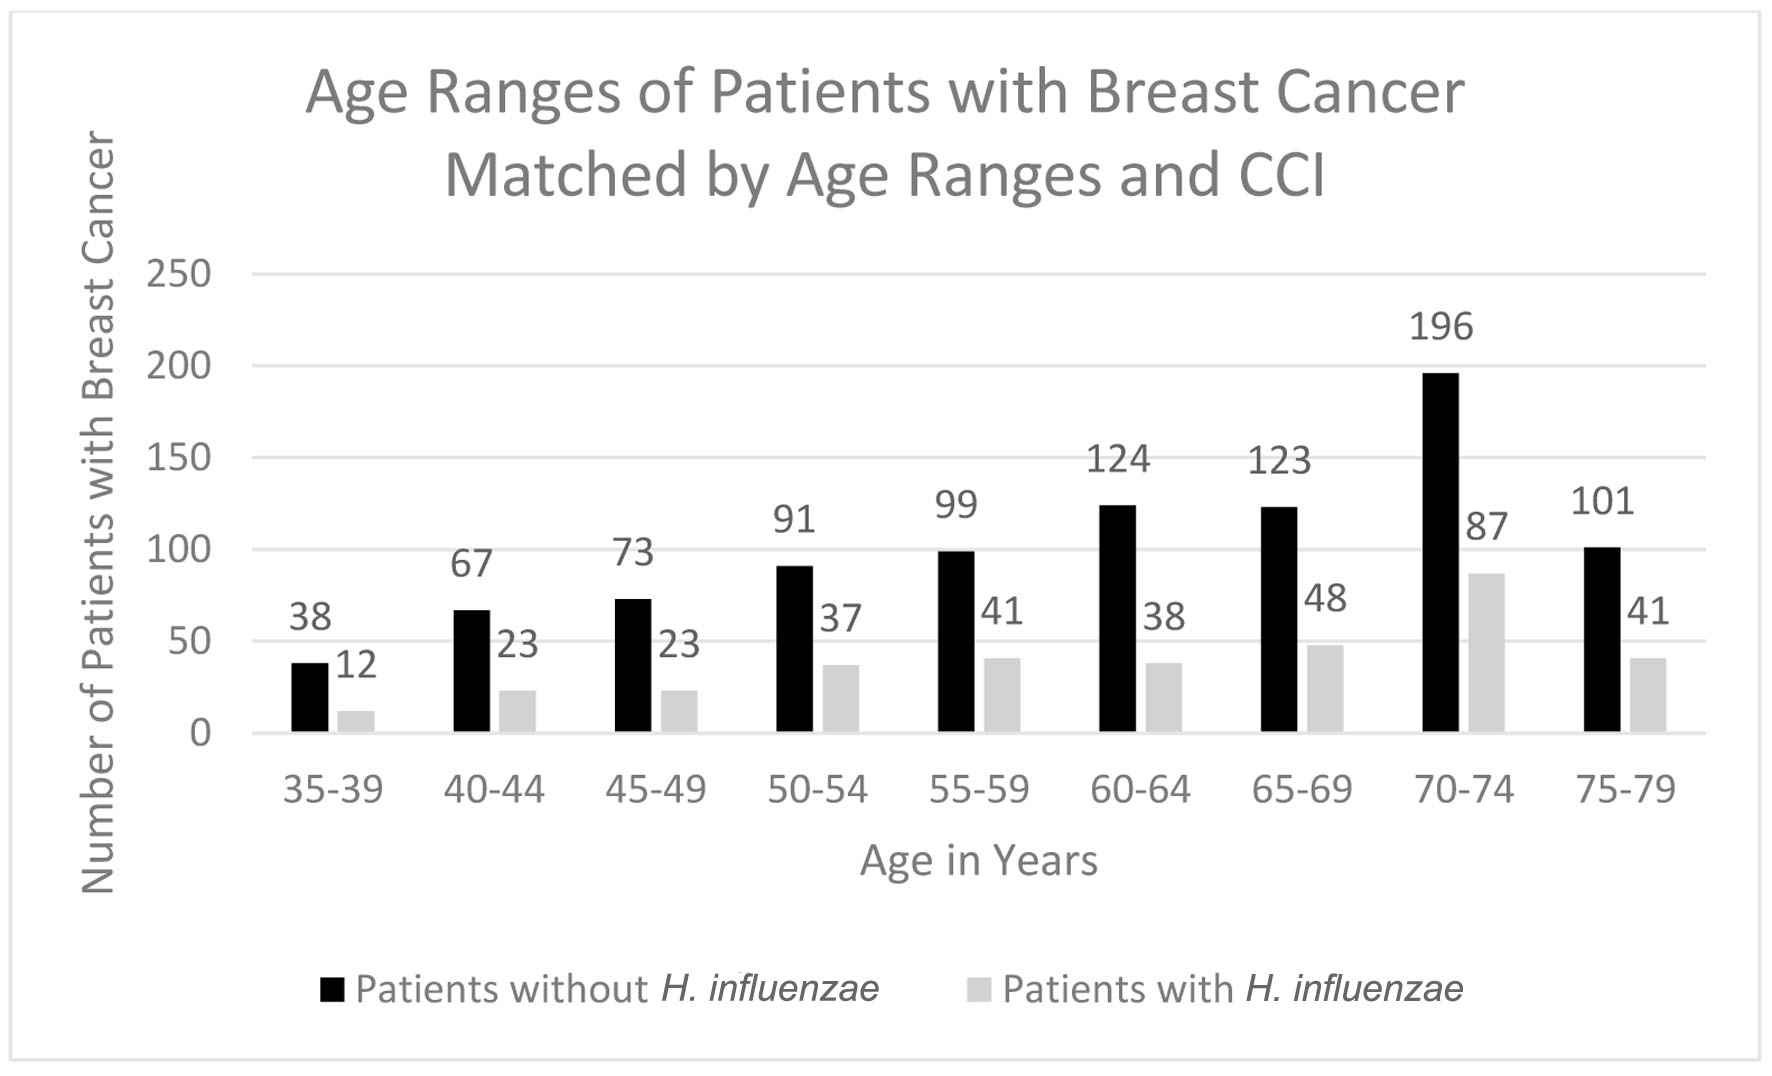
Figure 4. Age ranges of patients with and without H. influenzae who developed breast cancer. H. influenzae: Hemophilus influenzae.
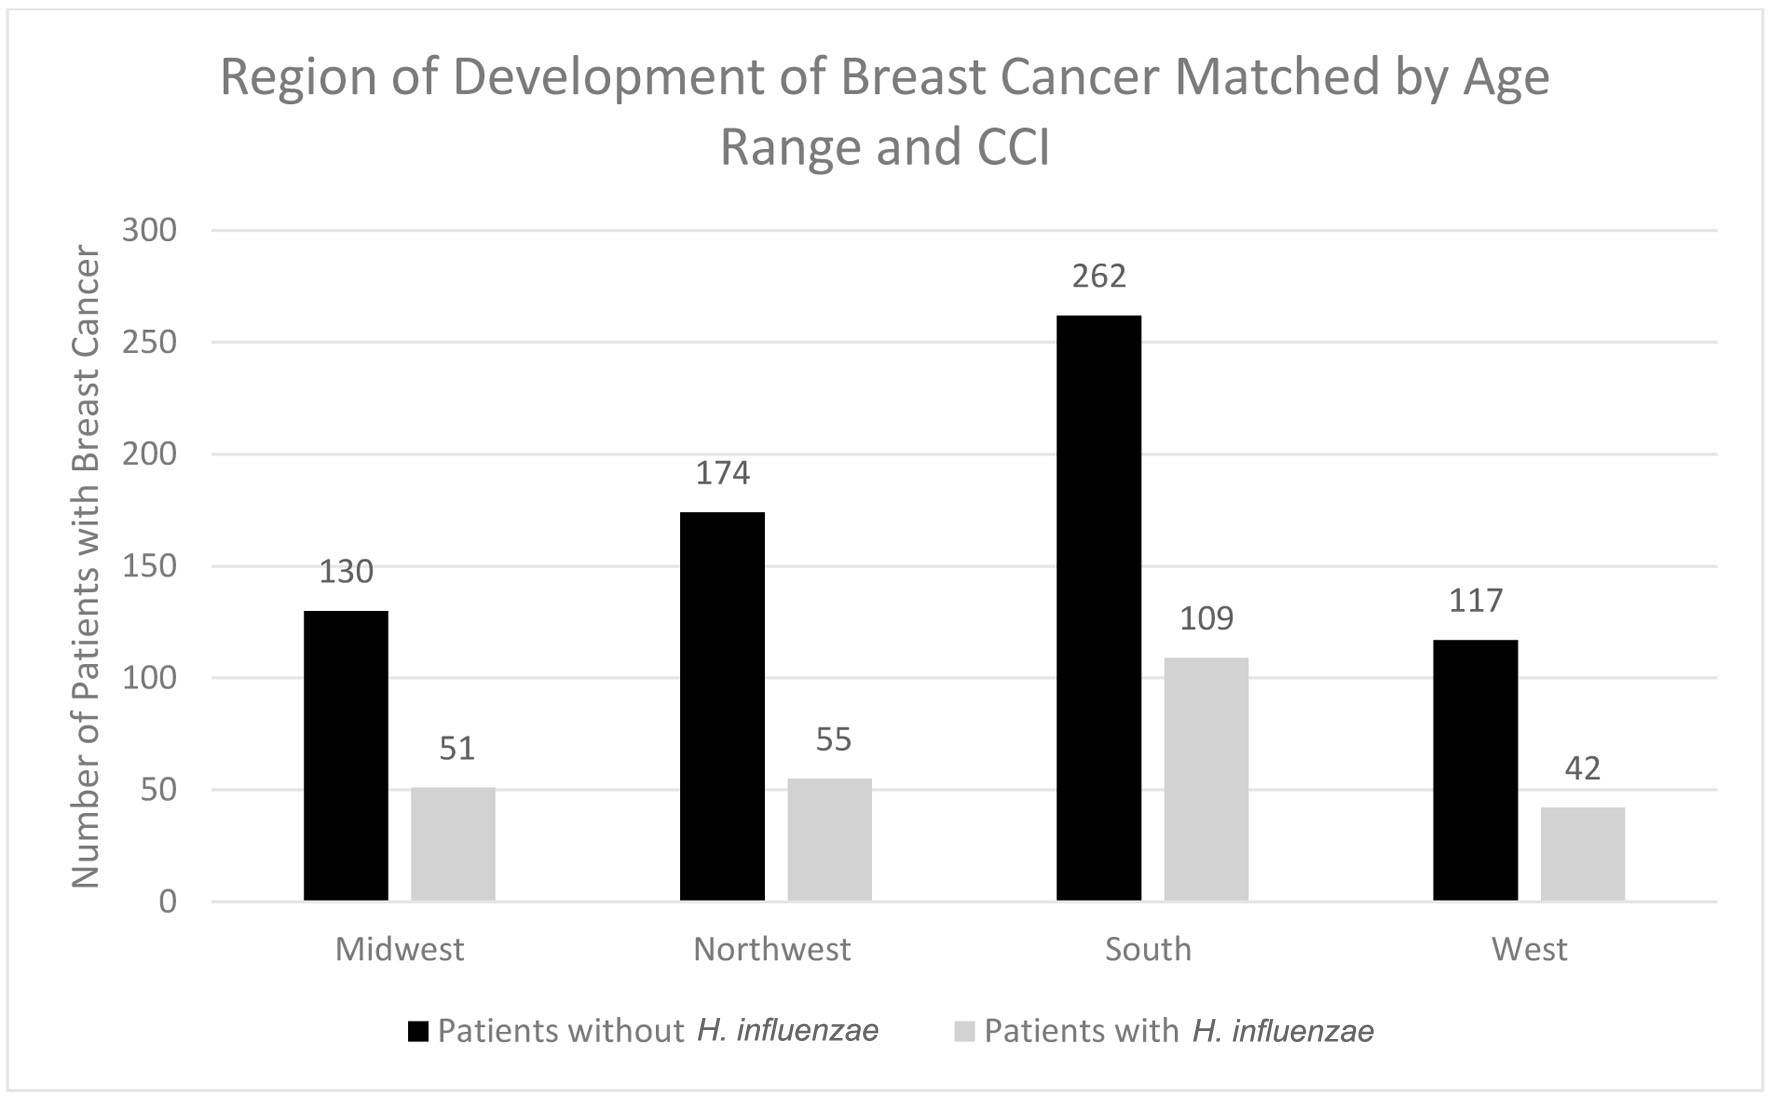
Figure 5. Regions of breast cancer development most prevalent amongst individuals with and without prior H. influenzae infections. H. influenzae: Hemophilus influenzae.
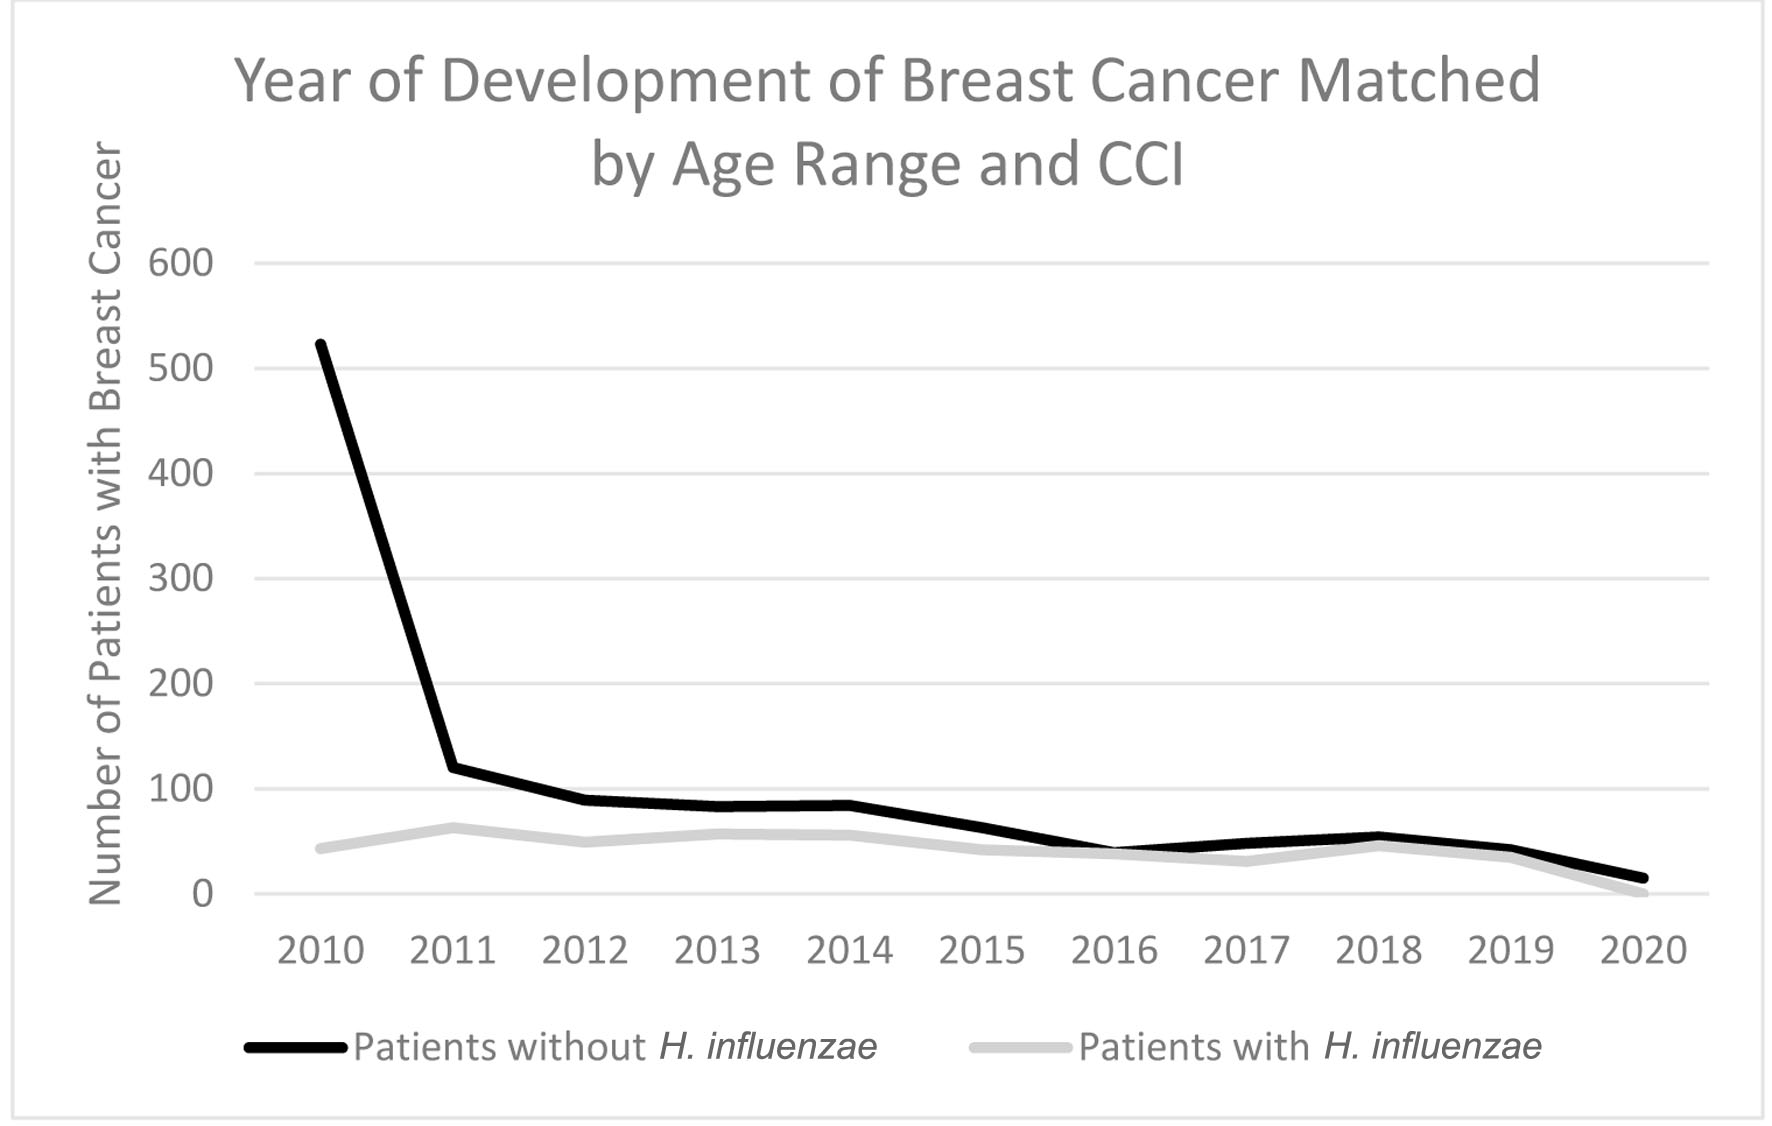
Figure 6. Timeline indicating which year the highest rate of breast cancer development was in patients with H. influenzae and patients without H. influenzae. H. influenzae: Hemophilus influenzae.
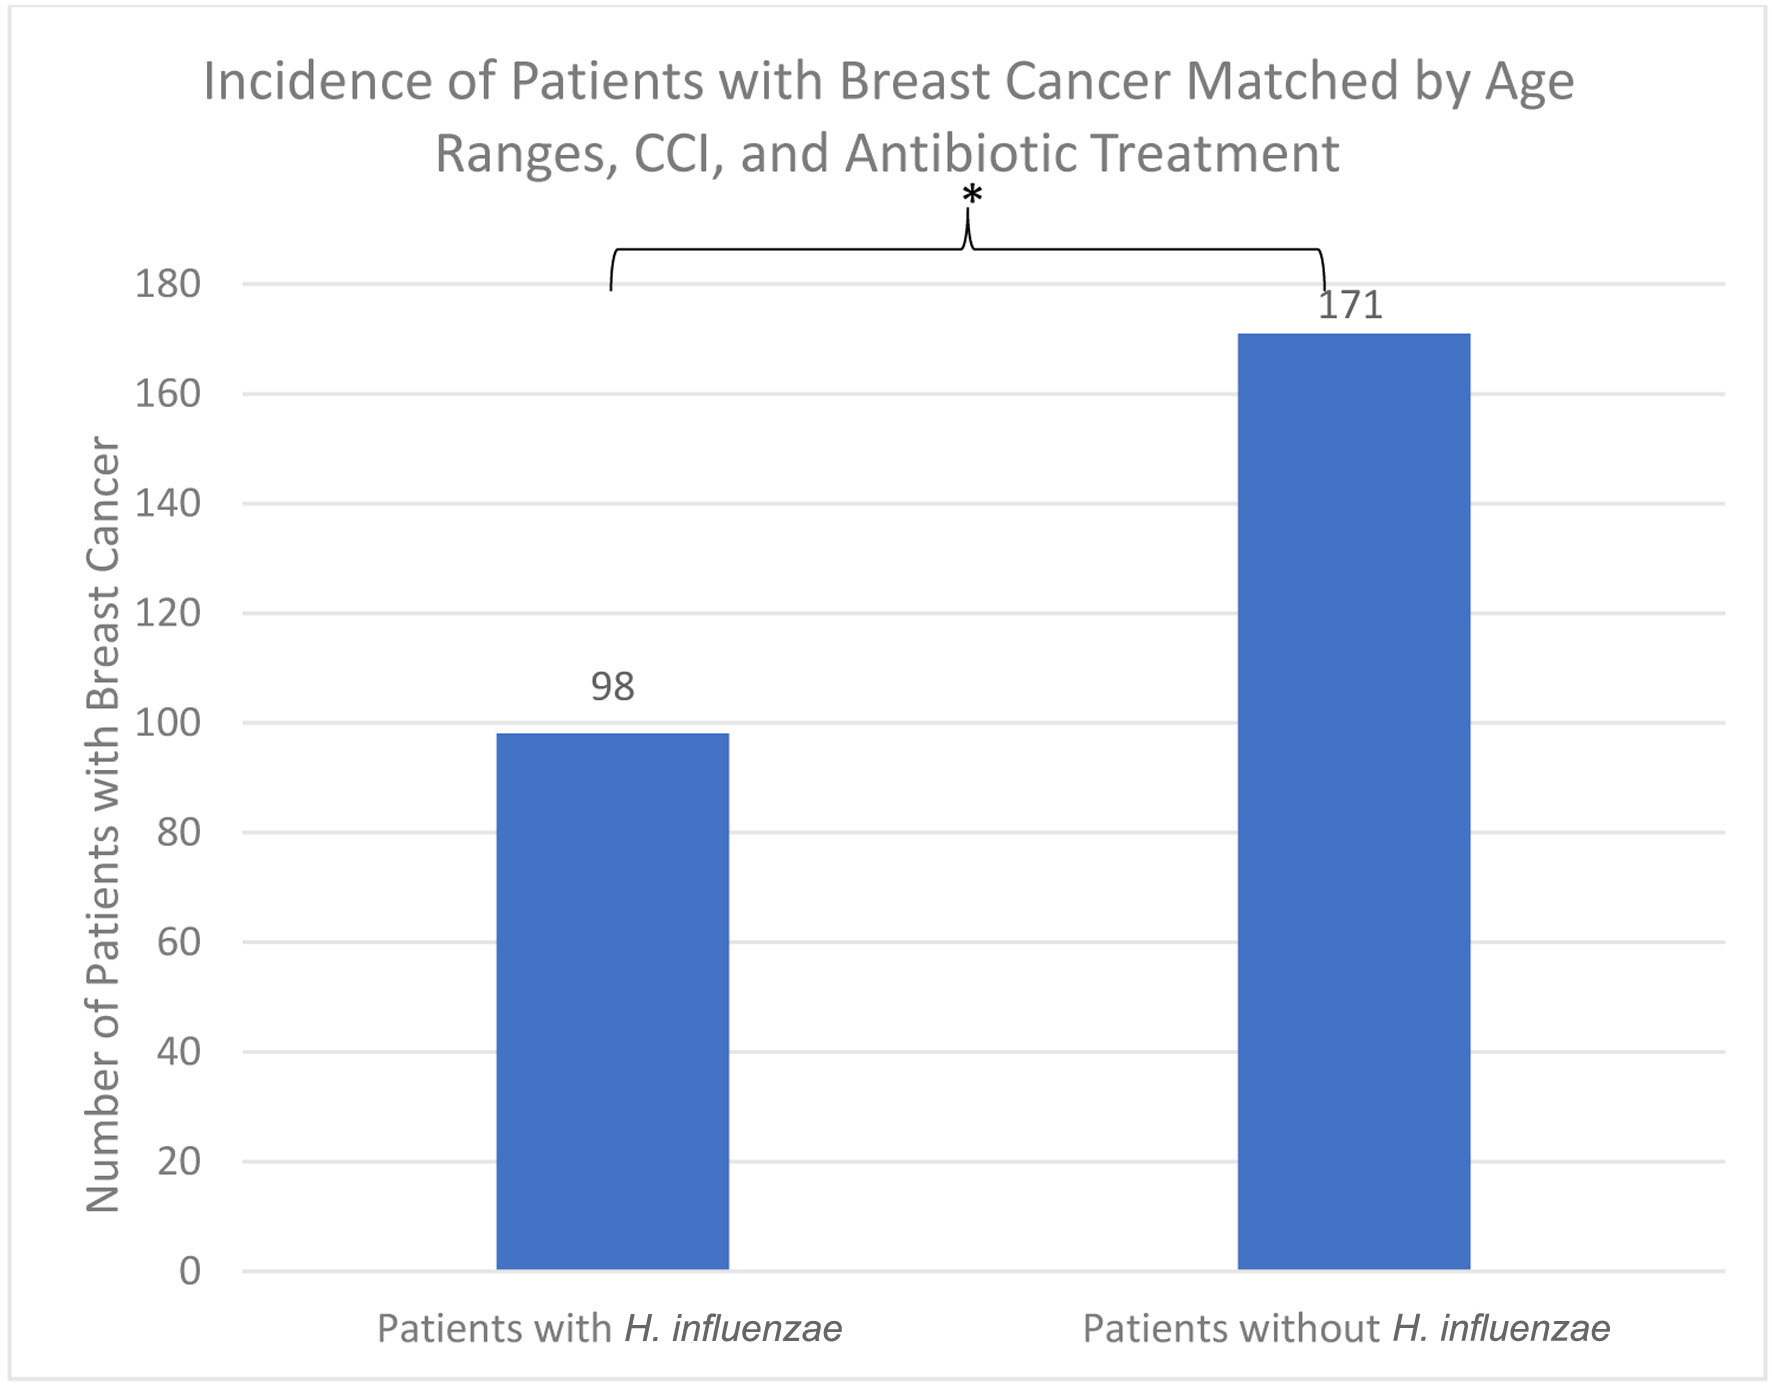
Figure 7. The incidence of breast cancer was 98 (3.073%) in the H. influenzae group compared to 171 (5.362%) in the control group. The difference was statistically significant by P < 2.2 × 10⁻¹⁶ (OR = 0.584, 95% CI: 0.515 - 0.661). OR: odds ratio; CI: confidence interval; H. influenzae: Hemophilus influenzae.
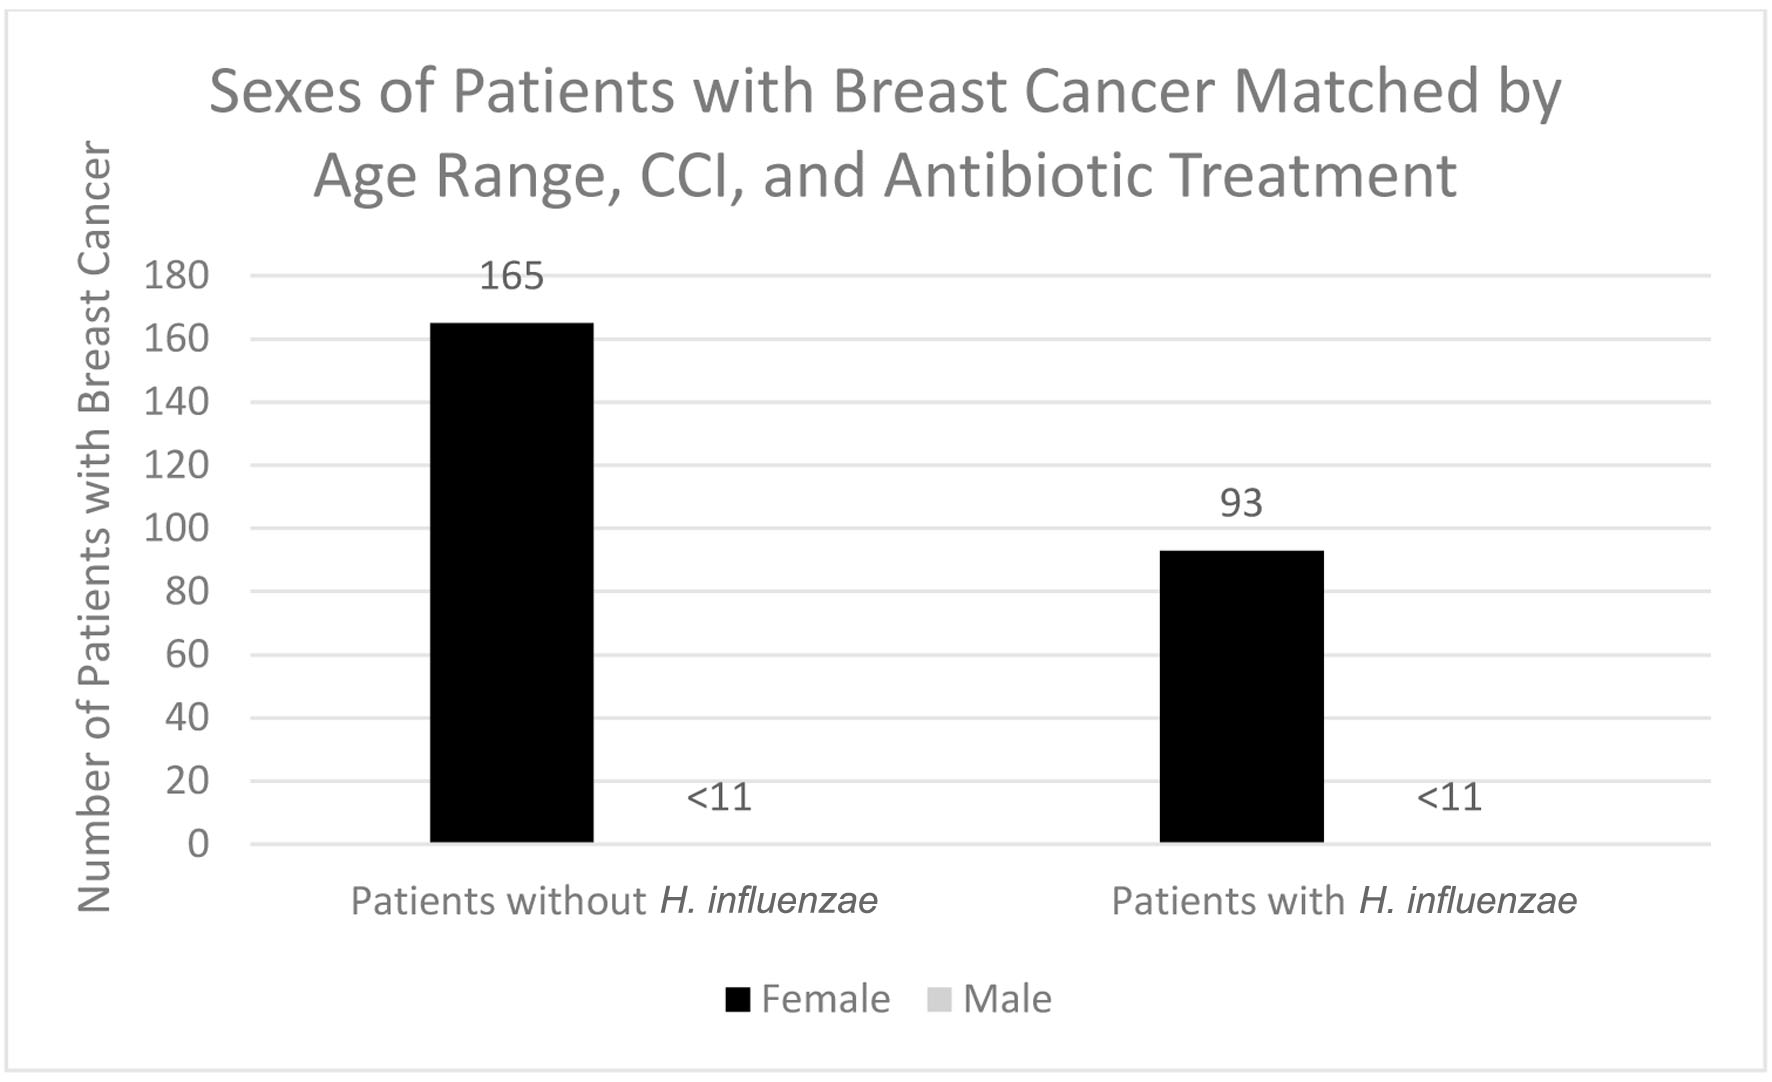
Figure 8. Sexes of patients with and without previous H. influenzae infection after being matched with antibiotic treatment who developed breast cancer. In both the male groups, < 11 signifies that there were less than 11 patients in this subset of data. The exact number of patients could not be provided because of HIPPA constraints. H. influenzae: Hemophilus influenzae.
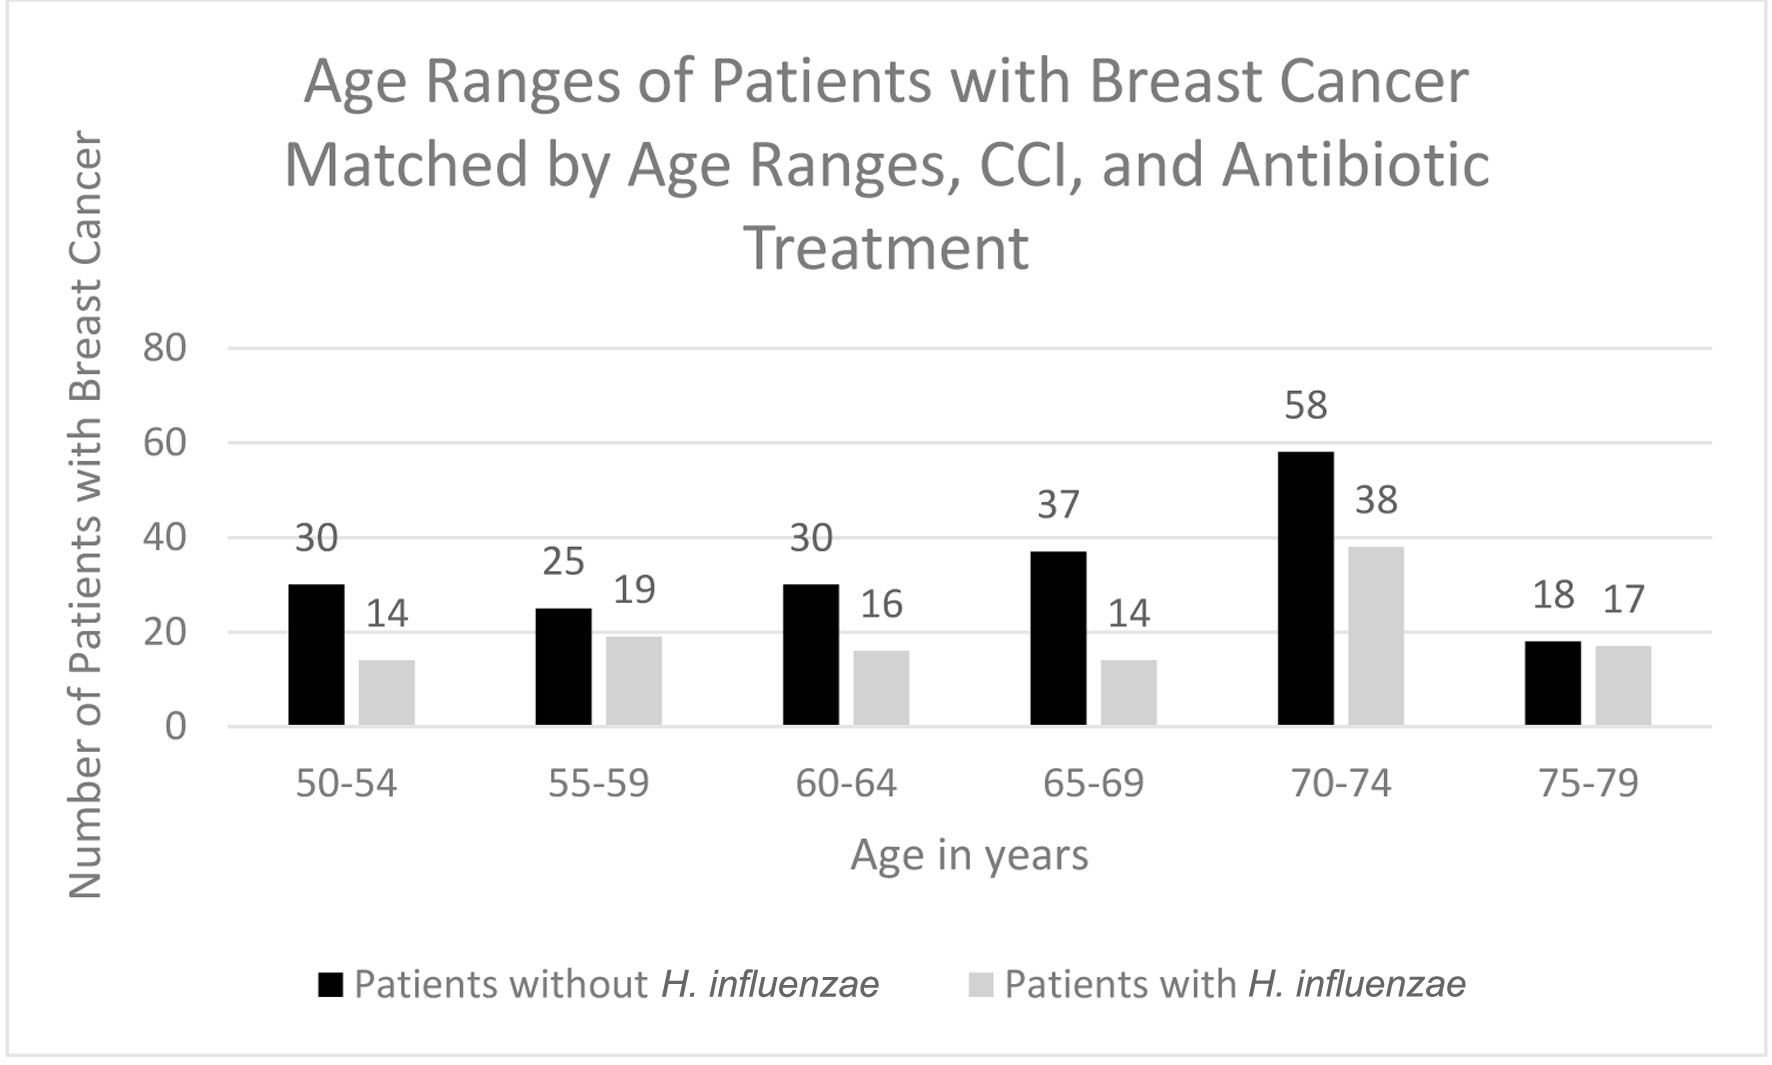
Figure 9. Age ranges of patients with and without H. influenzae and antibiotic matching who developed breast cancer. H. influenzae: Hemophilus influenzae.
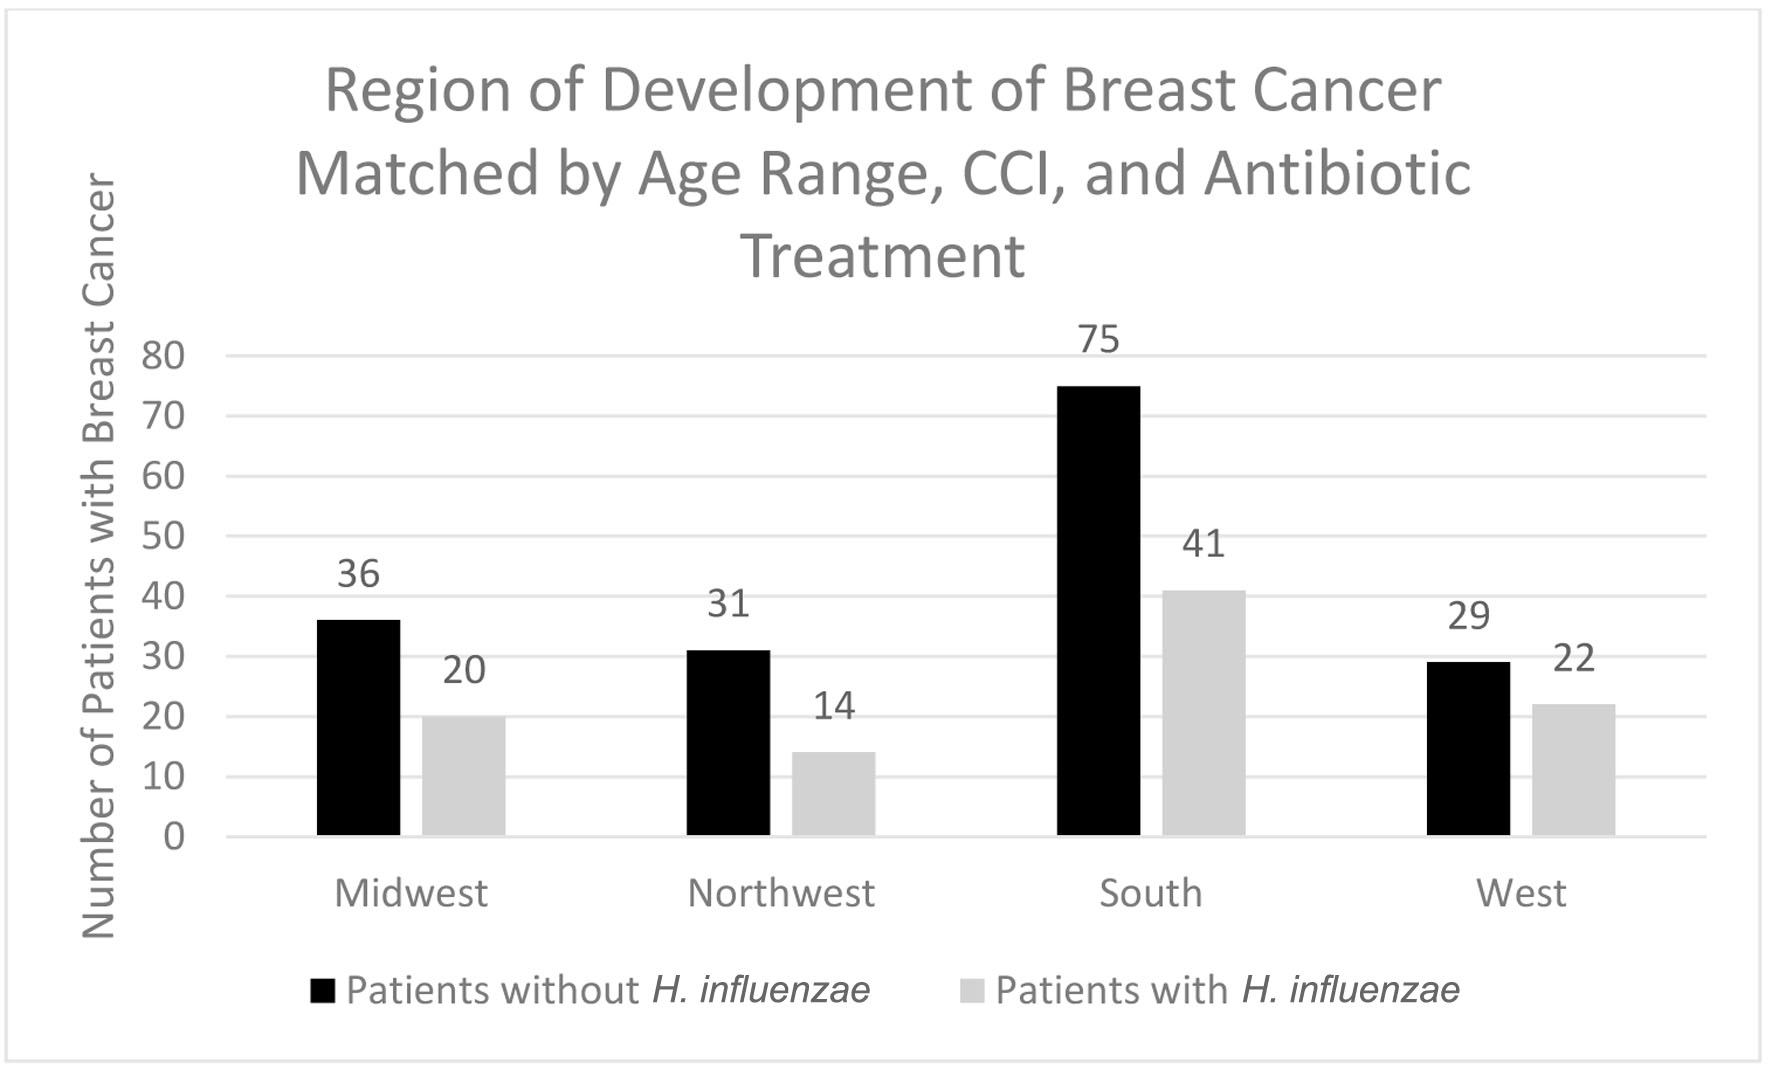
Figure 10. Regions of breast cancer development most prevalent amongst individuals with and without prior H. influenzae infections after matching for antibiotic treatment. H. influenzae: Hemophilus influenzae.
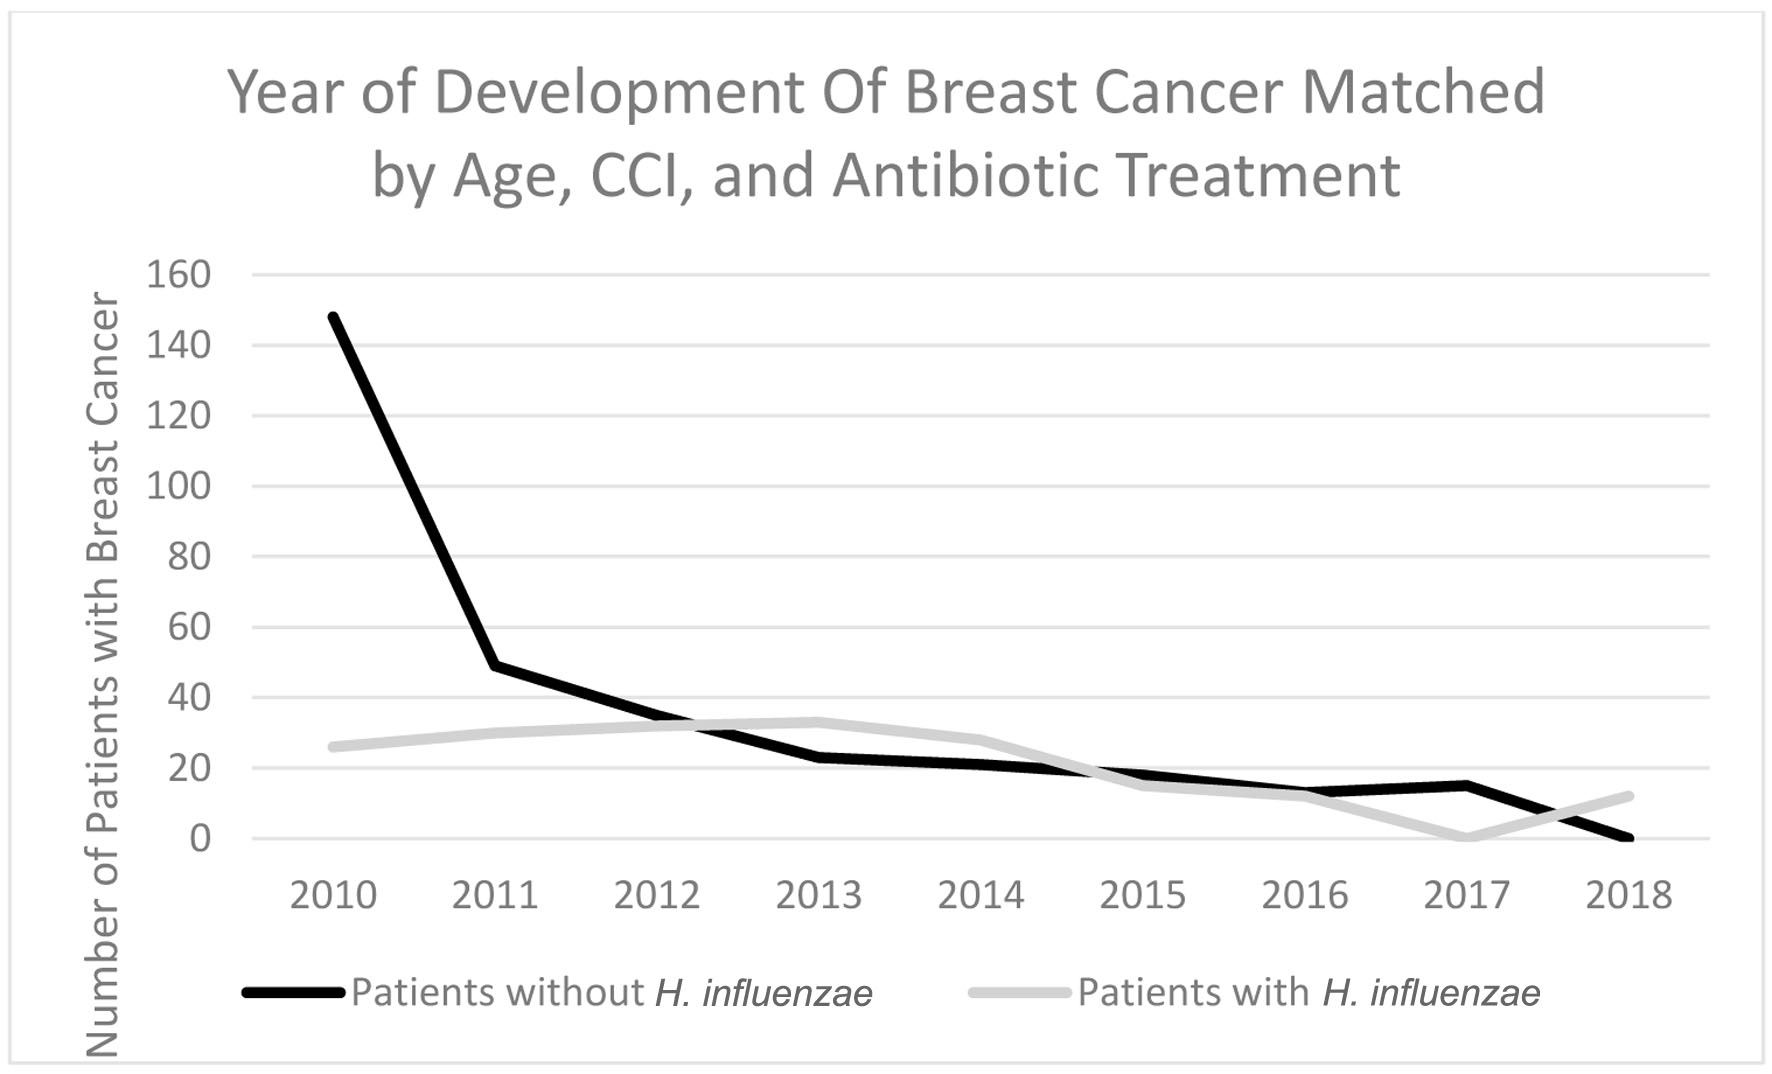
Figure 11. Timeline indicating which year the highest rate of breast cancer development was in patients with H. influenzae and patients without H. influenzae after antibiotic matching. H. influenzae: Hemophilus influenzae.
Tables
Table 1. Age Ranges of Patients With Breast Cancer With H. influenzae and Without H. influenzae
| Age ranges | Patients without H. influenzae | Patients with H. influenzae |
|---|
| H. influenzae: Hemophilus influenzae. |
| 35 - 39 | 38 | 12 |
| 40 - 44 | 67 | 23 |
| 45 - 49 | 73 | 23 |
| 50 - 54 | 91 | 37 |
| 55 - 59 | 99 | 41 |
| 60 - 64 | 124 | 38 |
| 65 - 69 | 123 | 48 |
| 70 - 74 | 196 | 87 |
| 75 - 79 | 101 | 41 |
Table 2. Years During Which Breast Cancer Developed Amongst Patients Who Had H. influenza and Patients Who Did Not
| Years | Patients without H. influenzae | Patients with H. influenzae |
|---|
| In the experimental group for 2020, < 11 signifies that there were less than 11 patients in this subset of data. The exact number of patients could not be provided because of HIPPA constraints. H. influenzae: Hemophilus influenzae. |
| 2010 | 523 | 43 |
| 2011 | 120 | 63 |
| 2012 | 89 | 49 |
| 2013 | 83 | 57 |
| 2014 | 84 | 56 |
| 2015 | 63 | 42 |
| 2016 | 39 | 38 |
| 2017 | 48 | 31 |
| 2018 | 54 | 46 |
| 2019 | 42 | 35 |
| 2020 | 15 | < 11 |
Table 3. Age Ranges of Patients With Breast Cancer With H. influenzae and Without H. influenzae After Being Matched for Antibiotic Treatment
| Age ranges | Patients without H. influenzae | Patients with H. influenzae |
|---|
| H. influenzae: Hemophilus influenzae. |
| 50 - 54 | 30 | 14 |
| 55 - 59 | 25 | 19 |
| 60 - 64 | 30 | 16 |
| 65 - 69 | 37 | 14 |
| 70 - 74 | 58 | 38 |
| 75 - 79 | 18 | 17 |
Table 4. Years During Which Breast Cancer Developed Amongst Patients Who Had H. influenzae and Patients Who Did Not After Matching for Antibiotic Treatment
| Years | Patients without H. influenzae | Patients with H. influenzae |
|---|
| < 11 signifies that there were less than 11 patients in this subset of data. The exact number of patients could not be provided because of HIPPA constraints. H. influenzae: Hemophilus influenzae. |
| 2010 | 148 | 26 |
| 2011 | 49 | 30 |
| 2012 | 35 | 32 |
| 2013 | 23 | 33 |
| 2014 | 21 | 28 |
| 2015 | 18 | 15 |
| 2016 | 13 | 12 |
| 2017 | 15 | < 11 |
| 2018 | < 11 | 12 |