Figures
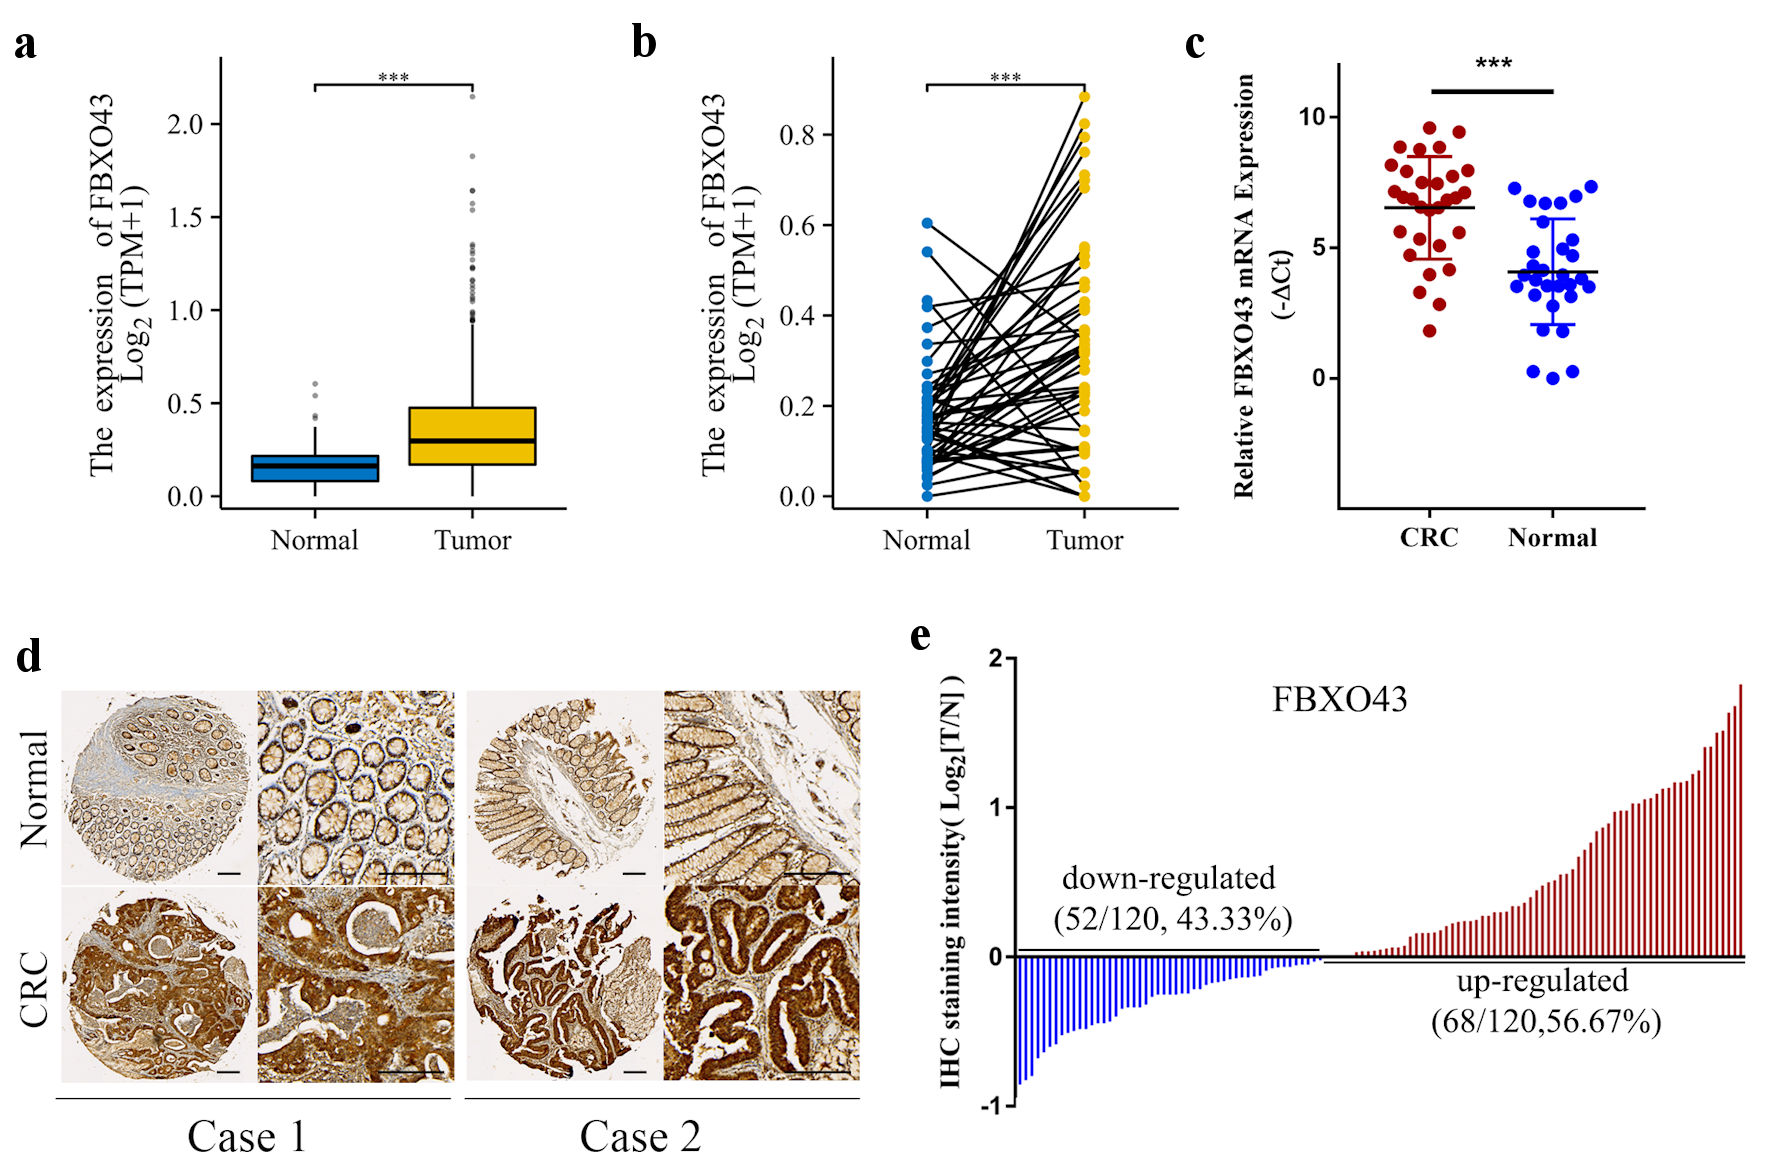
Figure 1. FBXO43 was highly expressed in CRC tissues. (a, b) The expression of FBXO43 in unpaired (a) and pair (b) tissues between CRC and normal tissues in TCGA. (c) mRNA expression of FBXO43 in 30 pairs of CRC and para-tumor normal tissues were determined by real-time qPCR. (d) Representative IHC staining of FBXO43 expression in CRC (scale bar: 100 µm). (e) FBXO43 was upregulated in the majority of CRC patients (56.67%). FBXO43: F-box protein 43; CRC: colorectal cancer; TCGA: The Cancer Genome Atlas; PCR: polymerase chain reaction; IHC: immunohistochemistry.
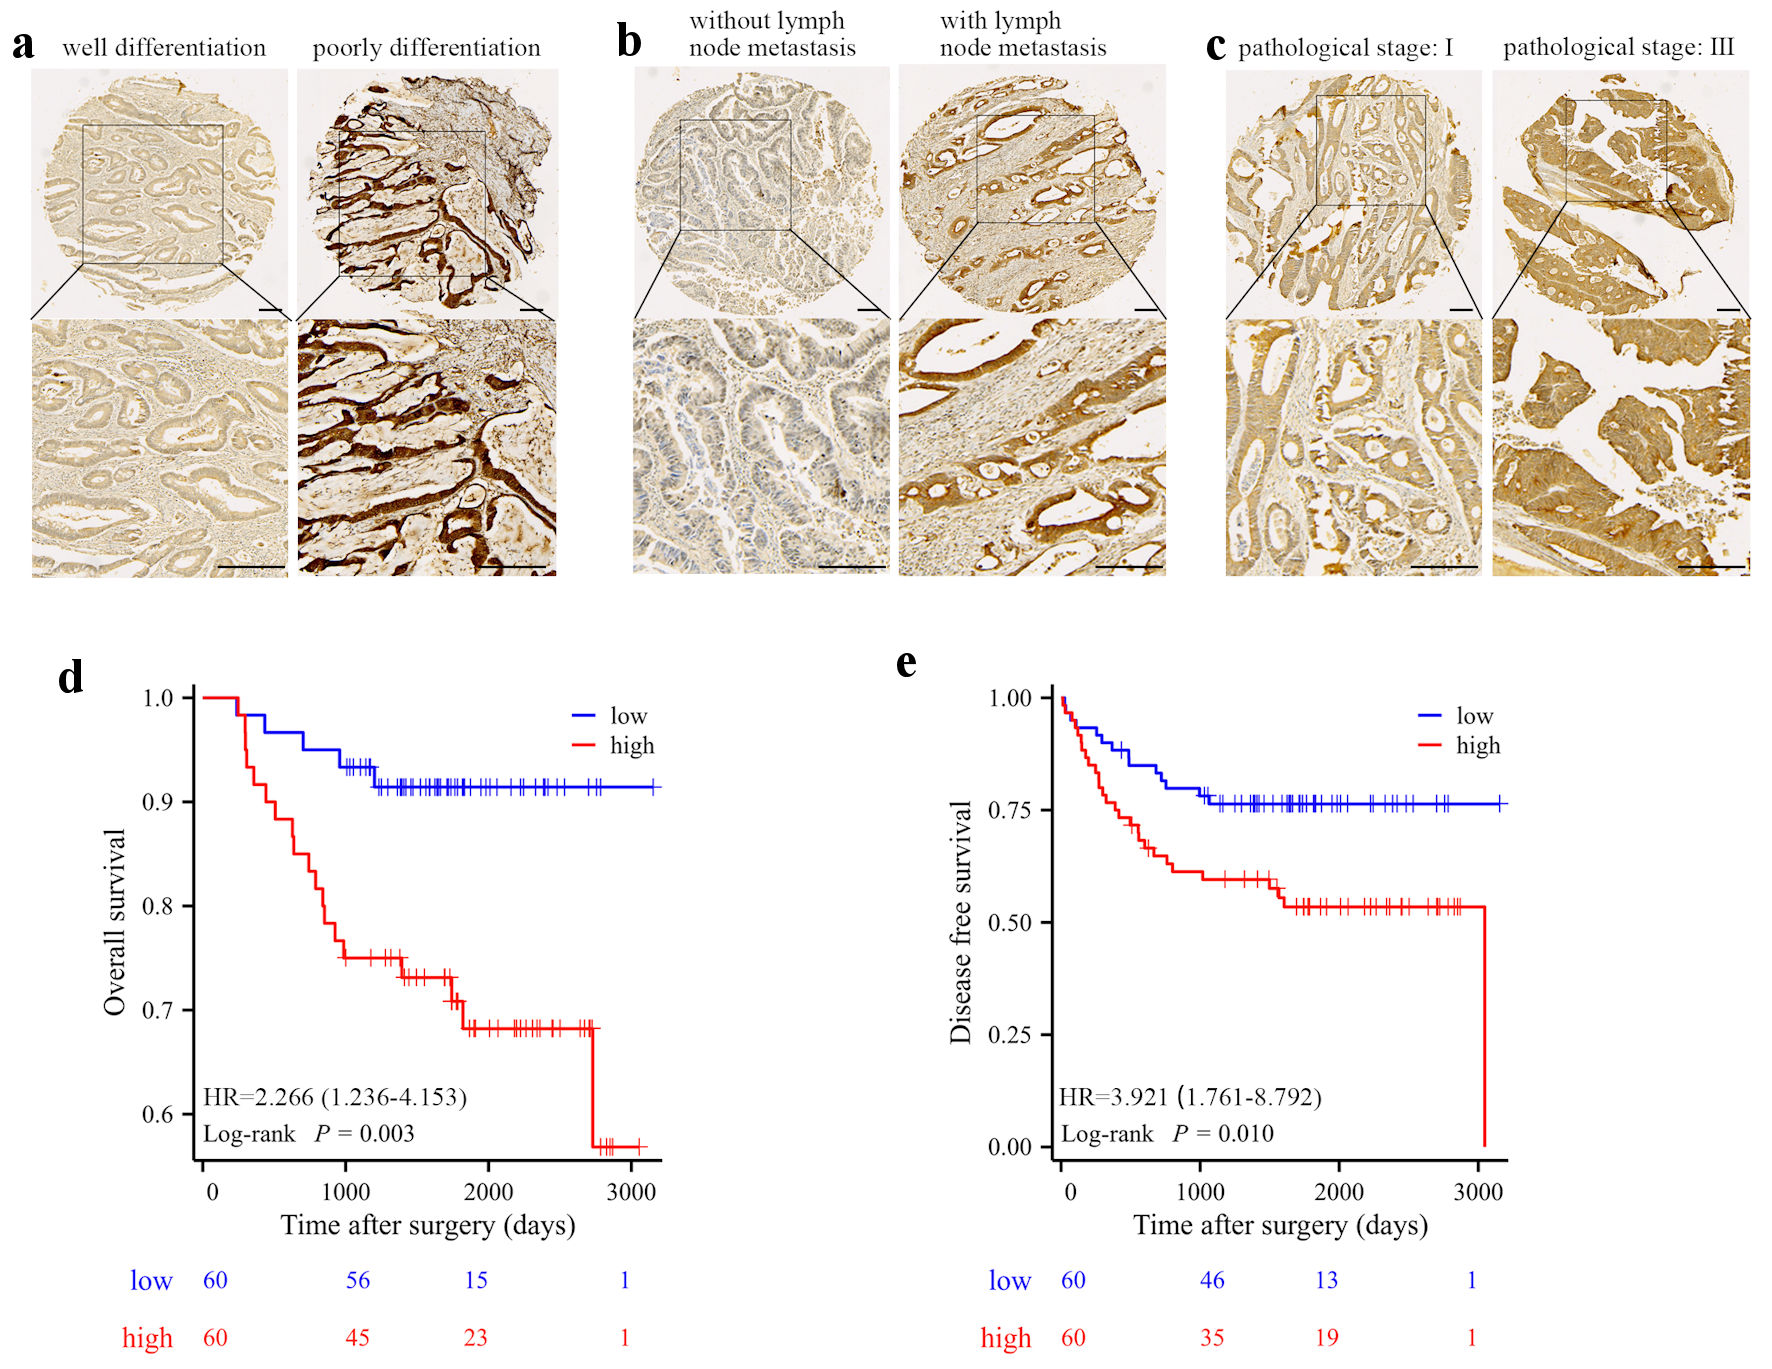
Figure 2. High level of FBXO43 was associated with poor clinical characteristics and prognosis. (a-c) Representative IHC staining of FBXO43 expression in different clinical stage CRCs: differentiation (a), lymph metastasis (b), and pathological stage (c) (scale bar: 100 µm). (d-e) OS (d) and RFS (e) of CRC patients after surgery resection were compared between the “high FBXO43” and “low FBXO43” groups using Kaplan-Meier analysis. FBXO43: F-box protein 43; IHC: immunohistochemistry; CRC: colorectal cancer; OS: overall survival; DFS: disease-free survival; HR: hazard ratio.
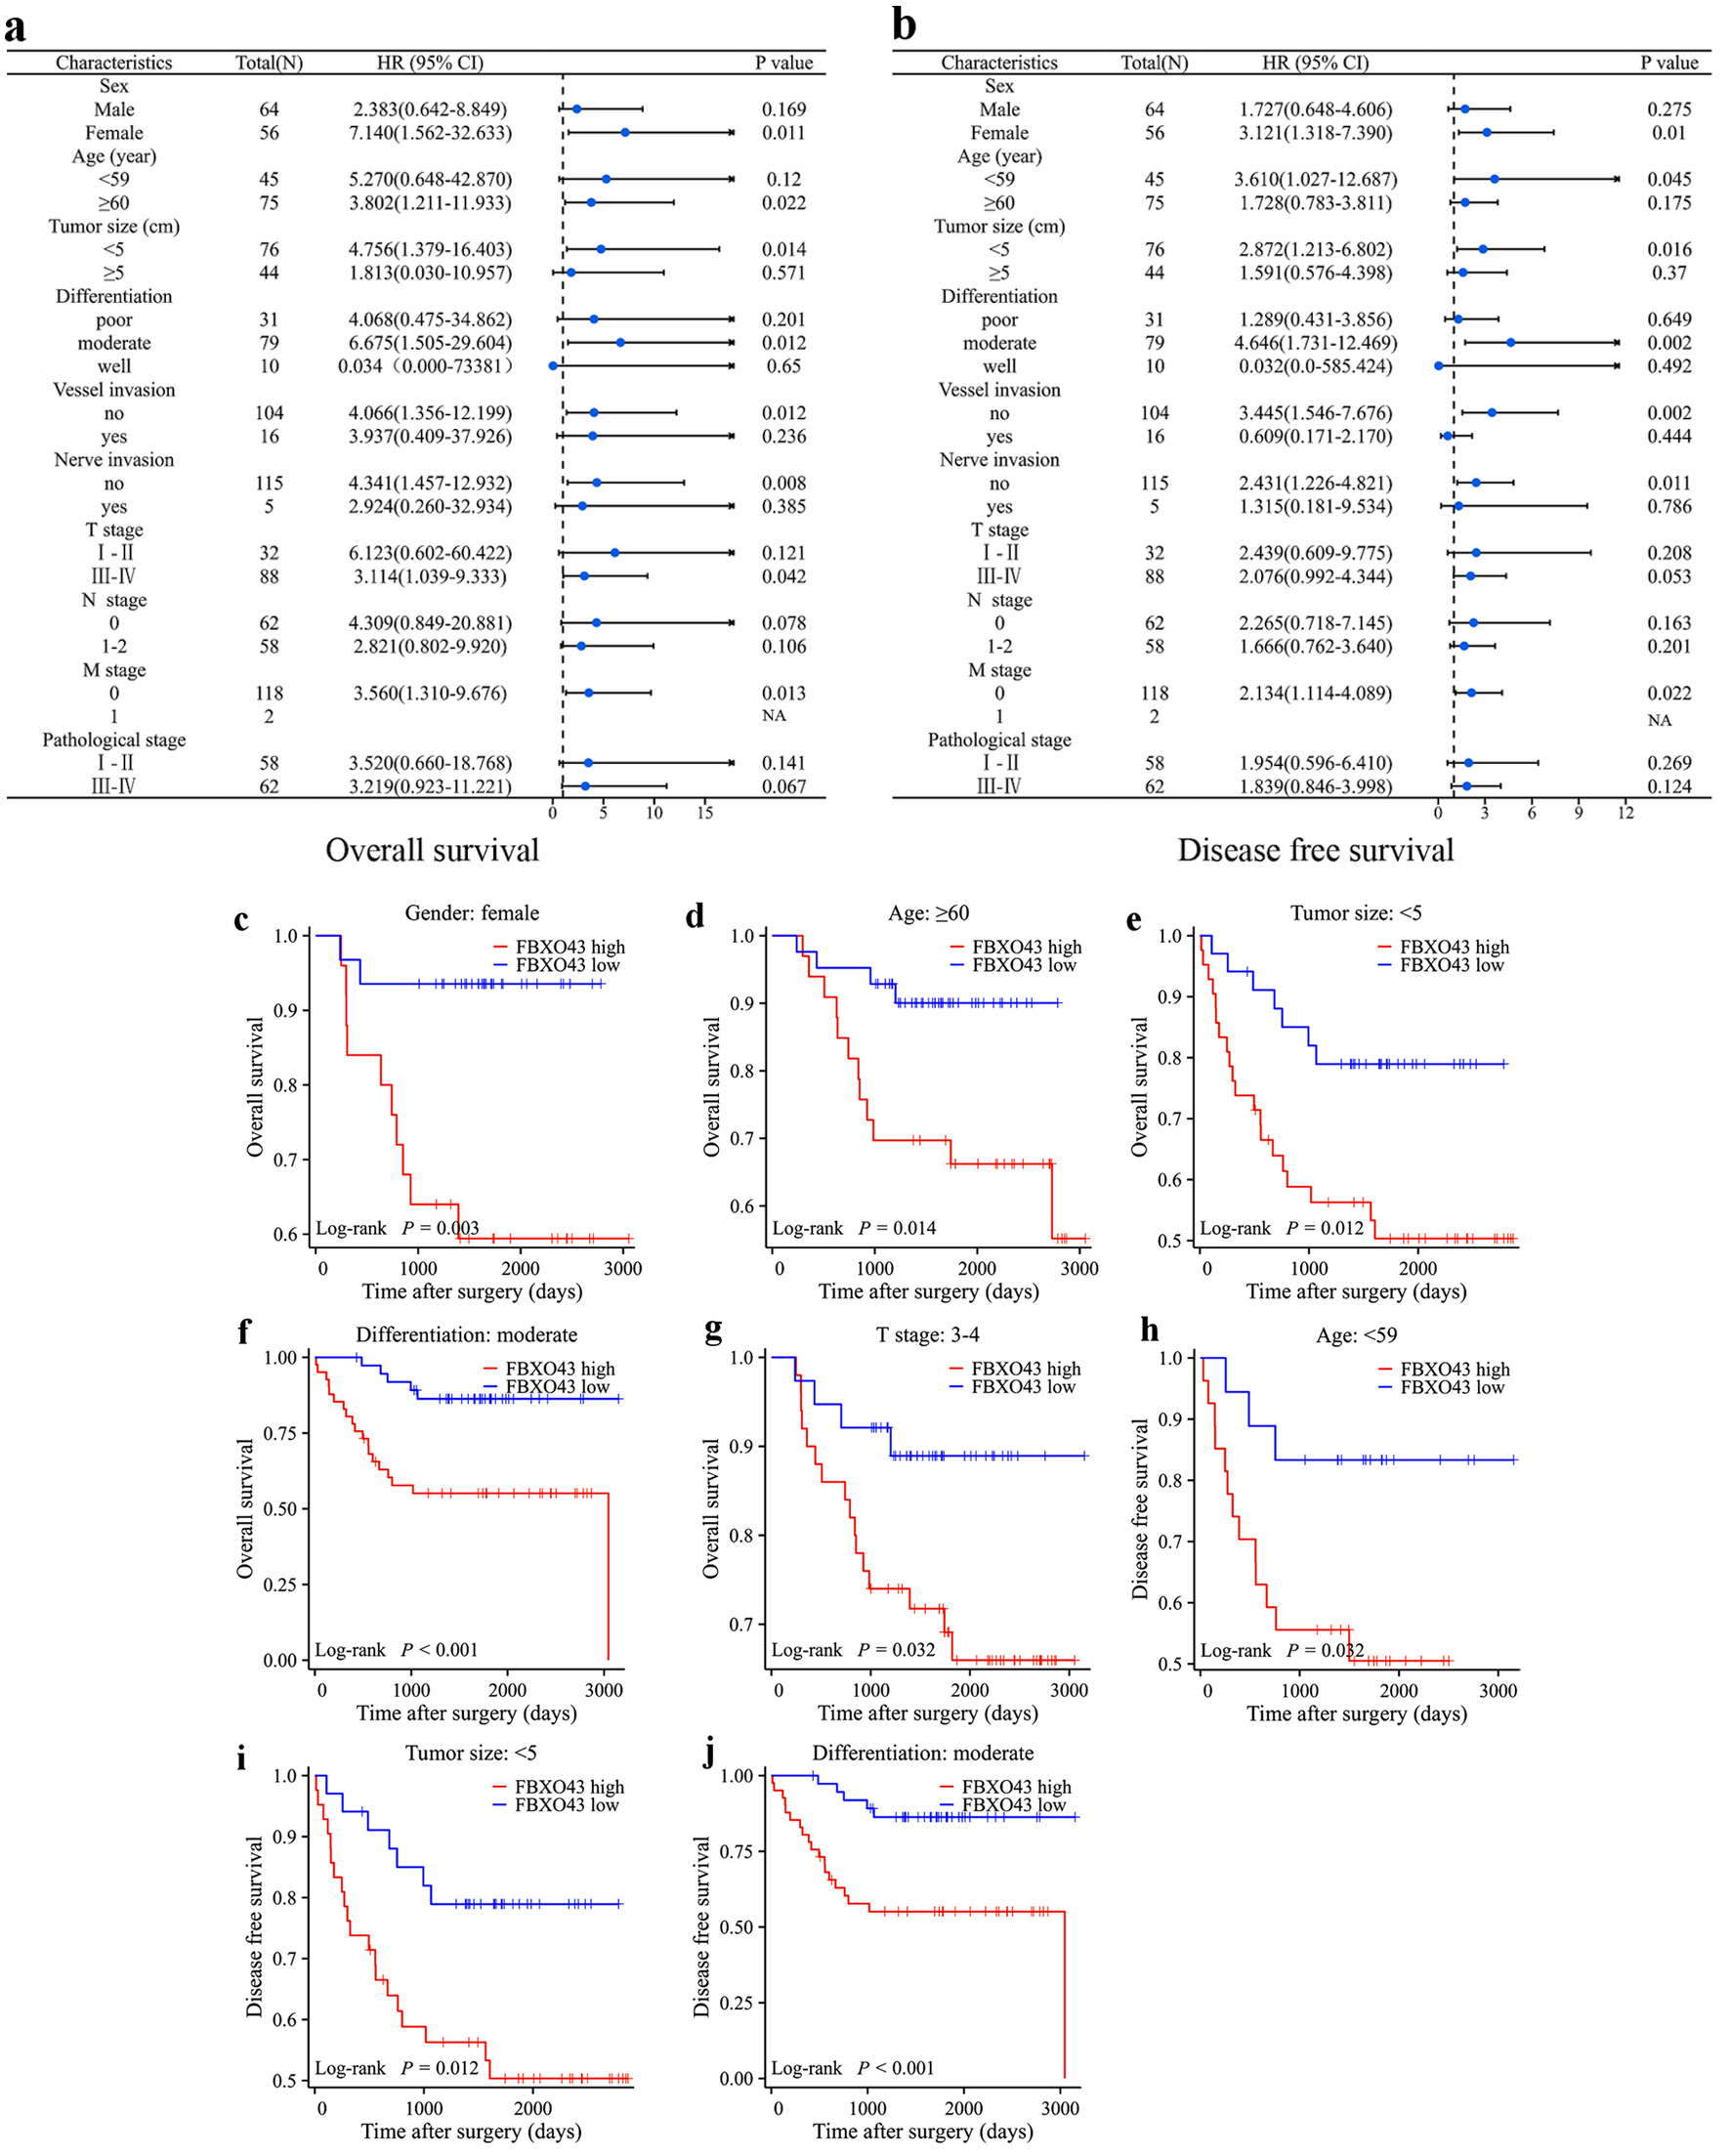
Figure 3. Prognostic value of FBXO43 for subgroup stratification of CRC. (a, b) Subgroup analysis of OS (a) and (b) by Cox regression according to the FBXO43 levels in cohort 1. (c) The OS of patients (female) in cohort 1 was compared between FBXO43 high and FBXO43 low groups. (d) The OS of patients (age ≥ 60) in cohort 1 was compared between FBXO43 high and FBXO43 low groups. (e) The OS of patients (tumor size < 5 cm) in cohort 1 was compared between FBXO43 high and FBXO43 low groups. (f) The OS of patients (moderate differentiation) in cohort 1 was compared between FBXO43 high and FBXO43 low groups. (g) The OS of patients (T stage III - IV) in cohort 1 was compared between FBXO43 high and FBXO43 low groups. (h) The DFS of patients (age < 59) in cohort 1 was compared between FBXO43 high and FBXO43 low groups. (i) The DFS of patients (tumor size < 5 cm) in cohort 1 was compared between FBXO43 high and FBXO43 low groups. (j) The DFS of patients (moderate differentiation) in cohort 1 was compared between FBXO43 high and FBXO43 low groups. FBXO43: F-box protein 43; CRC: colorectal cancer; OS: overall survival; DFS: disease-free survival; HR: hazard ratio; CI: confidence interval.
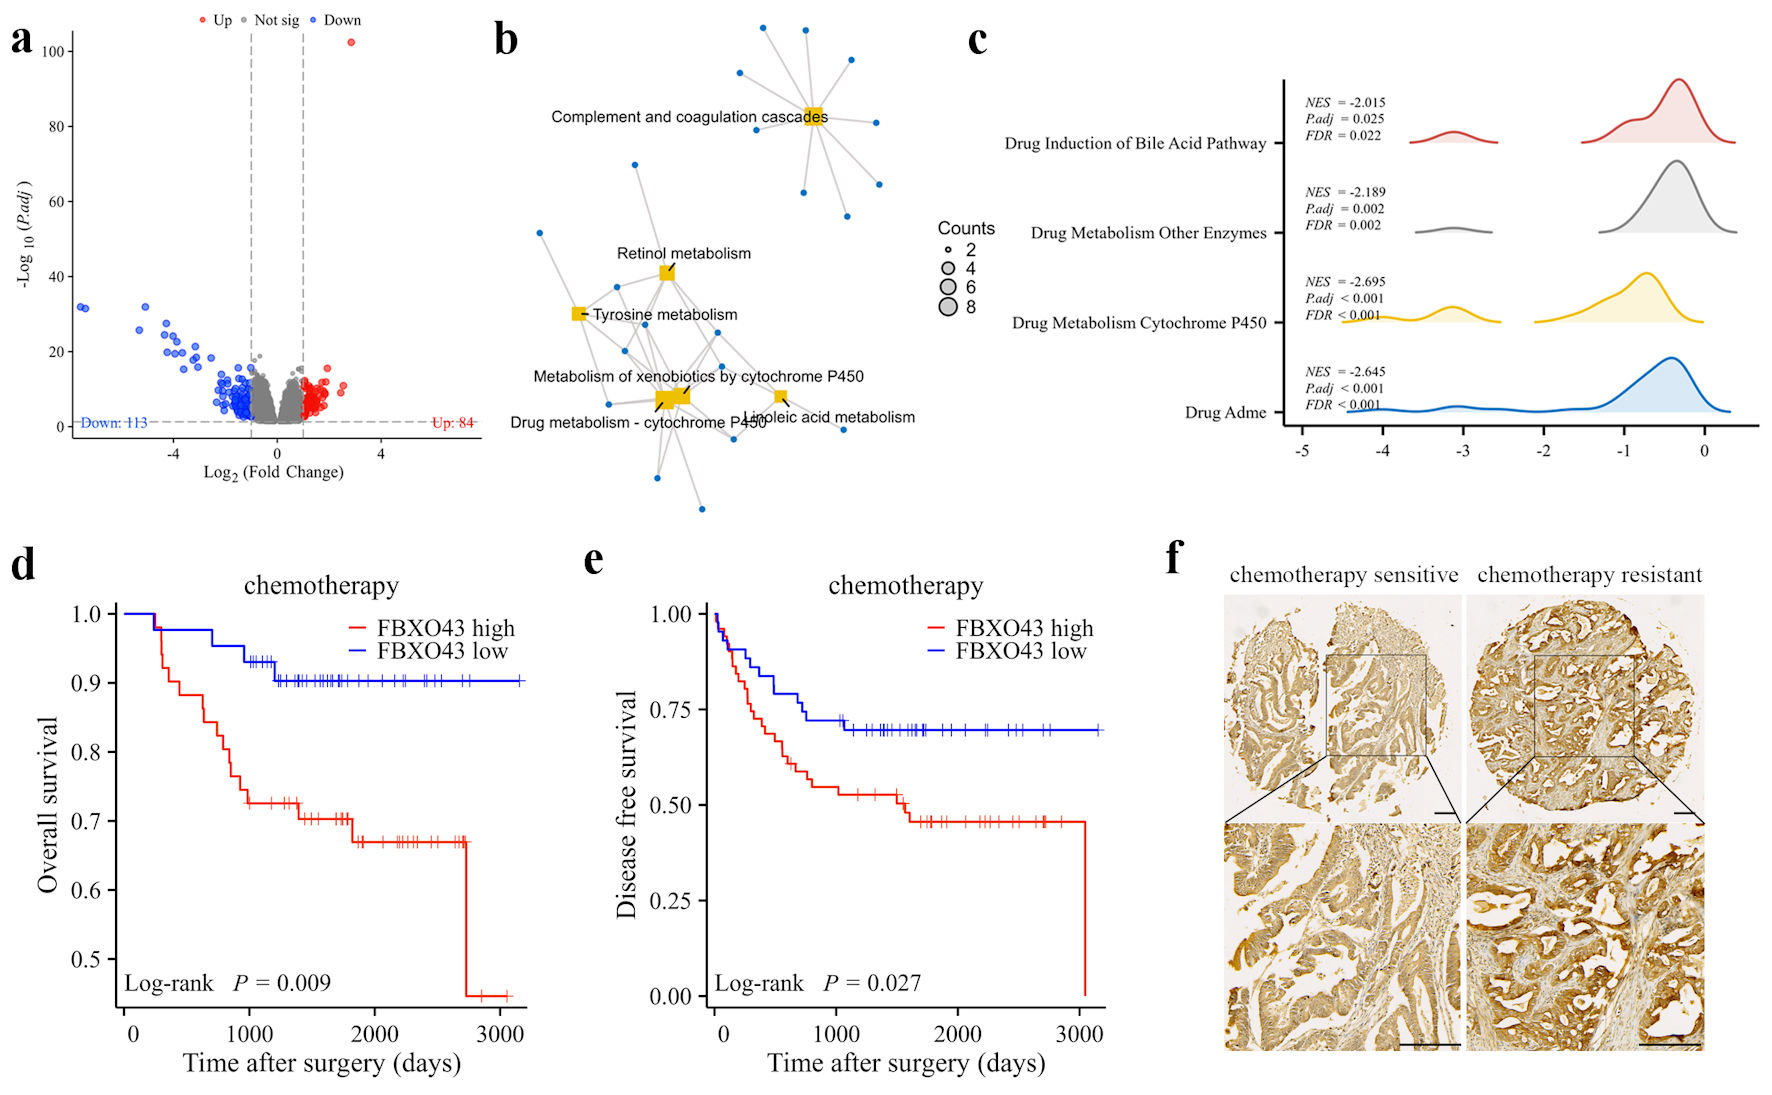
Figure 4. FBXO43 was associated with chemotherapy resistance in CRC patients. (a) Differential expression genes (DEGs) between FBXO43 high and FBXO43 low groups in the TCGA cohort were shown by volcano plots. Each red dot indicates an upregulated gene, and each blue dot indicates a downregulated gene (fold change > 1, adjusted P < 0.05). (b) Results of KEGG pathway analysis of DEGs (fold change > 1, adjusted P < 0.05). (c) Results of GSEA enrichment analysis of DEGs. (d, e) The OS and DFS of patients who receiving chemotherapy in cohort 1 after surgery resection were compared between FBXO43 high and FBXO43 low groups. (f) Representative IHC staining of FBXO43 expression in chemotherapy-resistance and chemotherapy-sensitive CRC tissues (scale bar: 100 µm). FBXO43: F-box protein 43; CRC: colorectal cancer; OS: overall survival; DFS: disease-free survival; HR: hazard ratio; TCGA: The Cancer Genome Atlas; IHC: immunohistochemistry; KEGG: Kyoto Encyclopedia of Genes and Genomes; GSEA: Gene Set Enrichment Analysis.