World Journal of Oncology, ISSN 1920-4531 print, 1920-454X online, Open Access
Article copyright, the authors; Journal compilation copyright, World J Oncol and Elmer Press Inc
Journal website https://www.wjon.org

Original Article

Volume 14, Number 6, December 2023, pages 488-498


Prevalence and Prognosis of Secondary Genetic Aberrations Among Patients With Core Binding Factor Acute Myeloid Leukemia: A Mitelman Database Analysis

Figures

Figure 1.
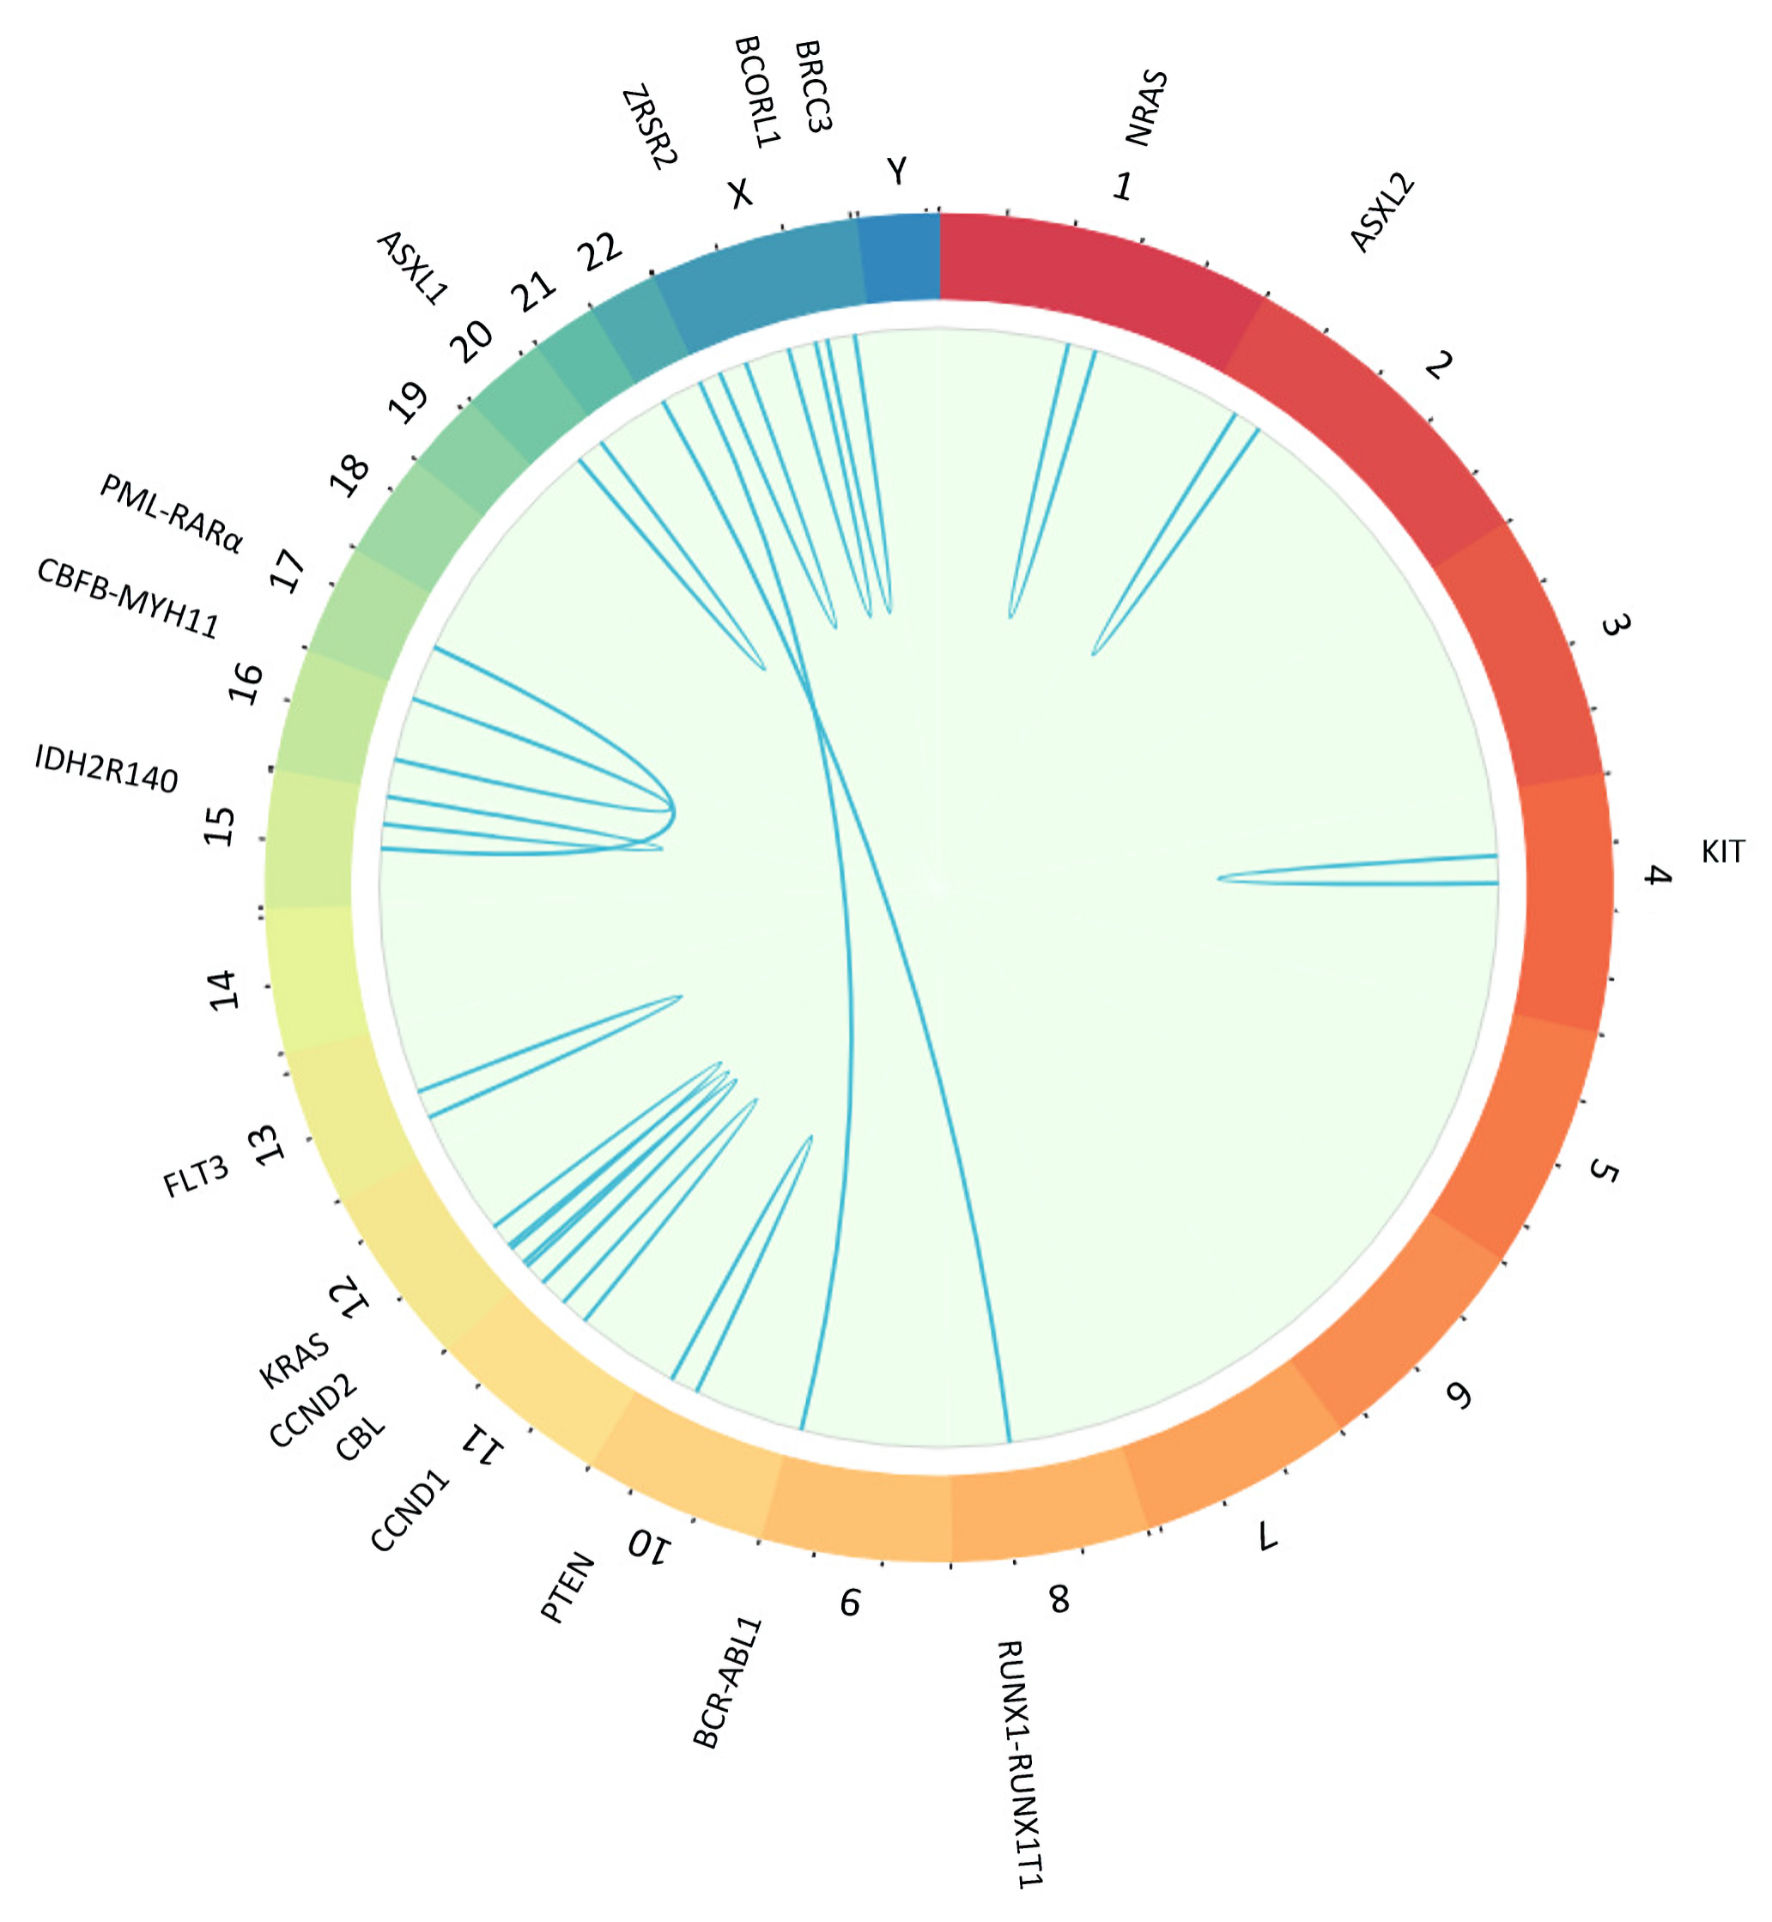
Figure 1. Plot created with BioCircos package in R showing with sky-blue lines secondary genetic mutations and gene fusions found in core binding factor acute myeloid leukemia (CBF-AML) cases in Mitelman Database. Chromosomes are individually colored and arranged clockwise from chromosome 1 to Y. We showed only mutations with a frequency greater than 1, and there were no rearrangements involving the Y chromosome. NRAS: neuroblastoma RAS viral gene mutation; ASXL2: ASXL transcriptional regulator 2 gene mutation; RUNX1-RUNX1T1: RUNX1-RUNX1 partner transcriptional co-repressor 1 genes fusion; BCR-ABL1: BCR-ABL1 fusion gene mutation; PTEN: phosphatase and tensin homolog gene mutation; CCND1: cyclin D1 gene mutation; CCND2: cyclin D2 gene mutation; CBL: casitas B-lineage lymphoma gene mutation; KRAS: Kirsten rat sarcoma virus gene mutation; FLT3: FMS-like tyrosine kinase 3 gene mutation; IDH2R140: isocitrate dehydrogenase 2 R140 gene mutation; CBFB-MYH11: core binding factor beta subunit-myosin heavy chain 11 genes fusion; PML-RARa: promyelocytic leukemia/retinoic acid receptor alpha gene mutation; ASXL1: ASXL transcriptional regulator 1 gene mutation; ZRSR2: zinc finger, RNA-binding motif and serine/arginine rich 2 gene mutation; BCORL1: BCORL1 gene mutation; BRCC3: BRCA1/BRCA2-containing complex 3 gene mutation.
Figure 2.
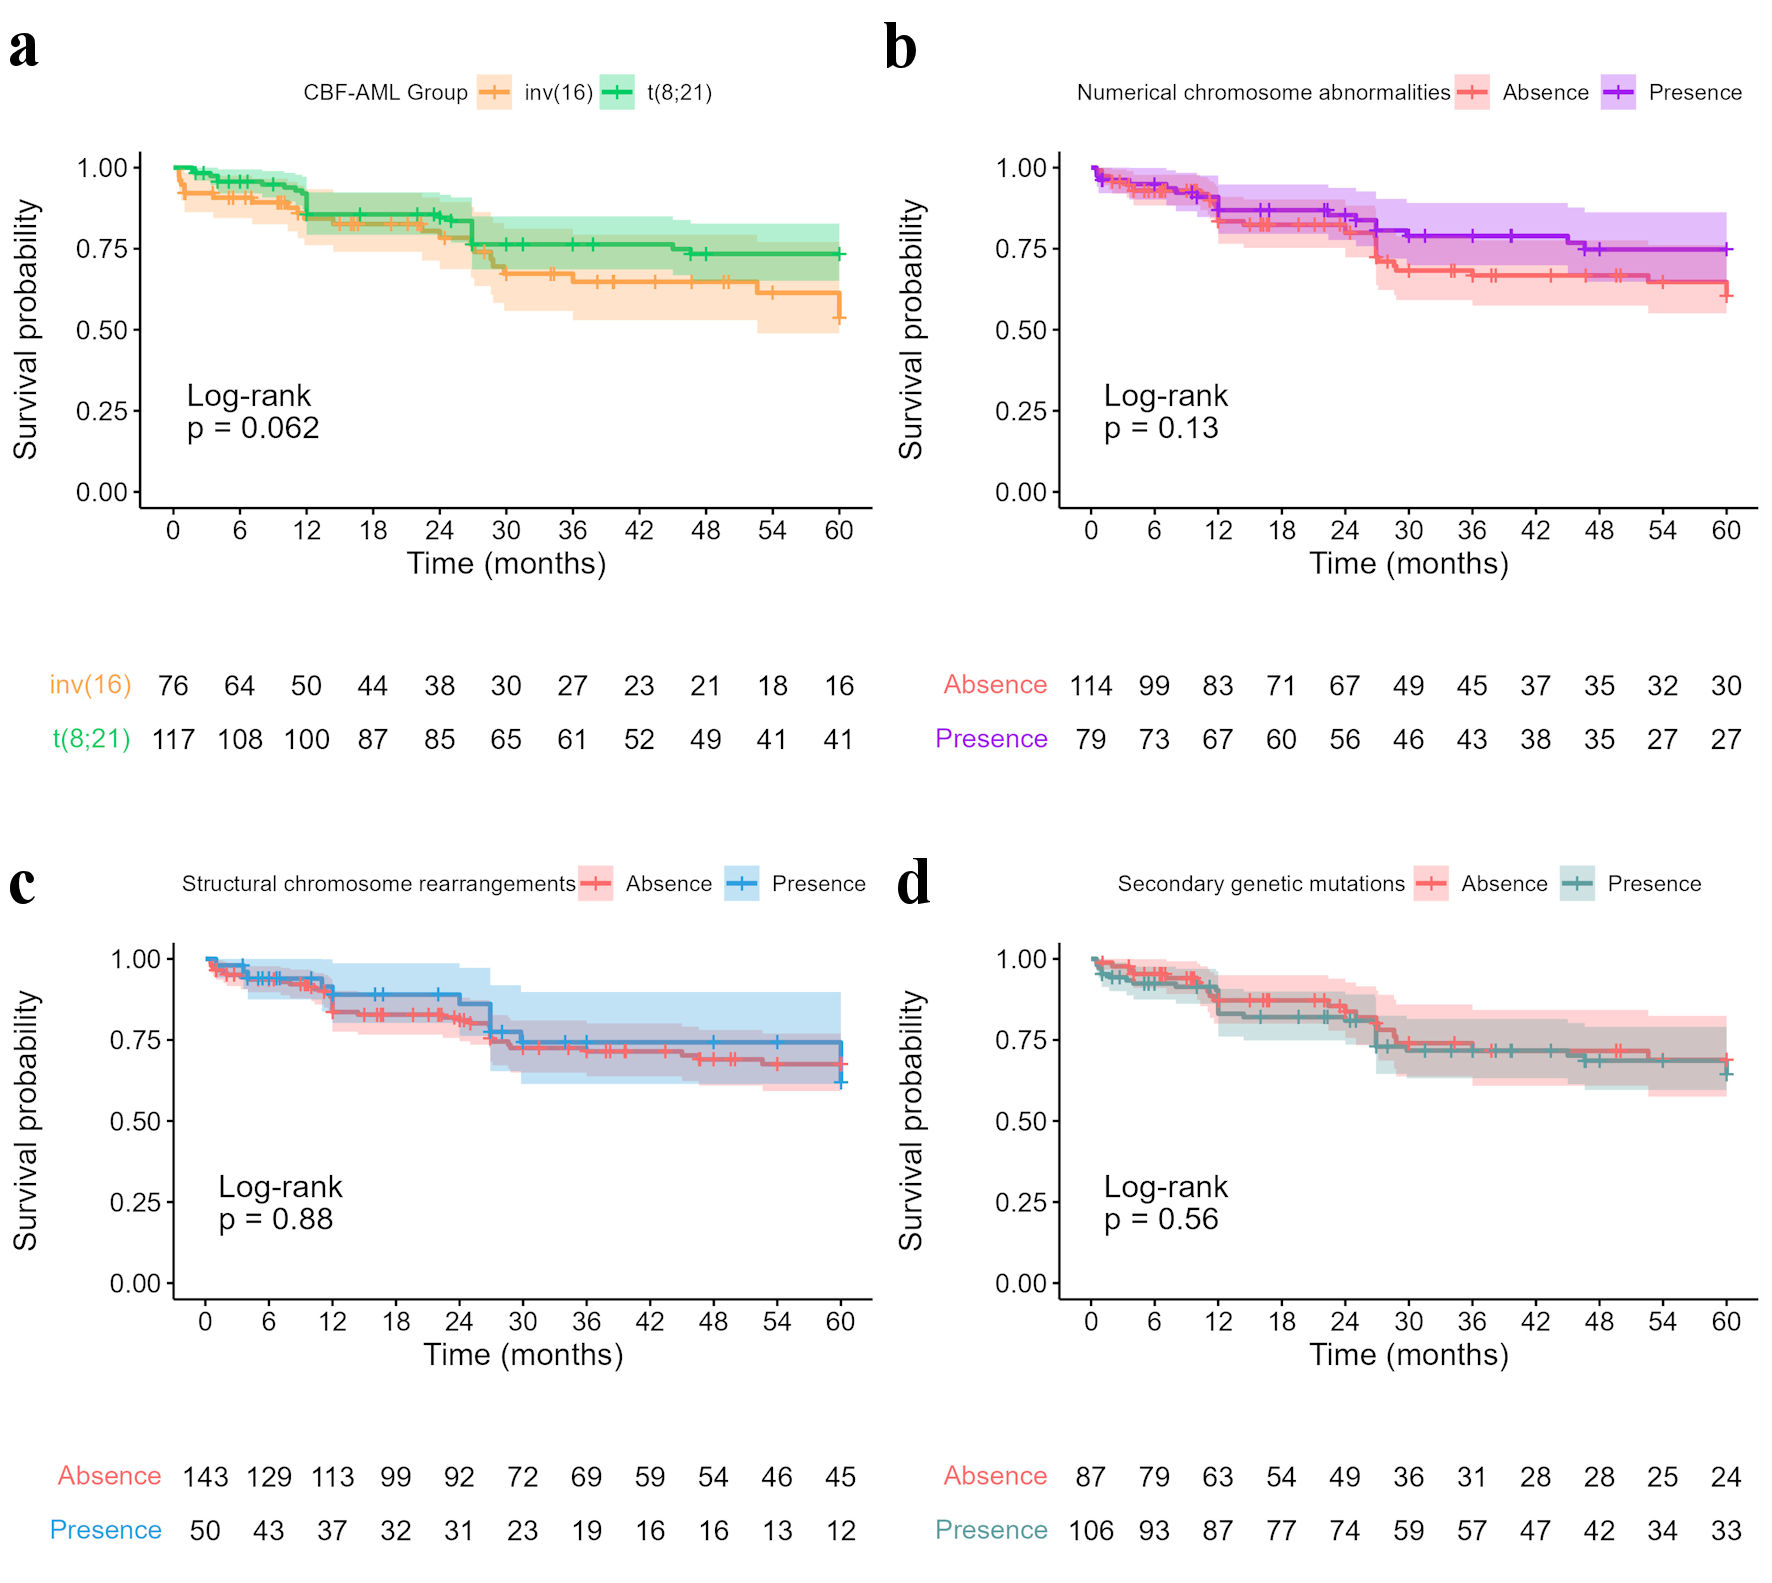
Figure 2. (a) Kaplan Meier curves for core binding factor acute myeloid leukemia (CBF-AML) groups showed no significant difference between groups. Five-year survival data of CBF-AML cases with secondary genetic findings: (b) Numerical chromosome abnormalities (5-year OS: 74.8%, 95% CI: 64.8 - 86.2, versus 60.4%, 95% CI: 50.1 - 72.9); (c) Structural chromosome rearrangements (5-year OS: 61.9%, 95% CI: 45.1 - 84.9, versus 67.5%, 95% CI: 59.2 - 77.0); (d) Secondary genetic mutations (5-year OS: 64.5%, 95% CI: 54.6 - 76.1, versus 68.9%, 95% CI: 57.5 - 82.4). CI: confidence interval; OS: overall survival.
Figure 3.
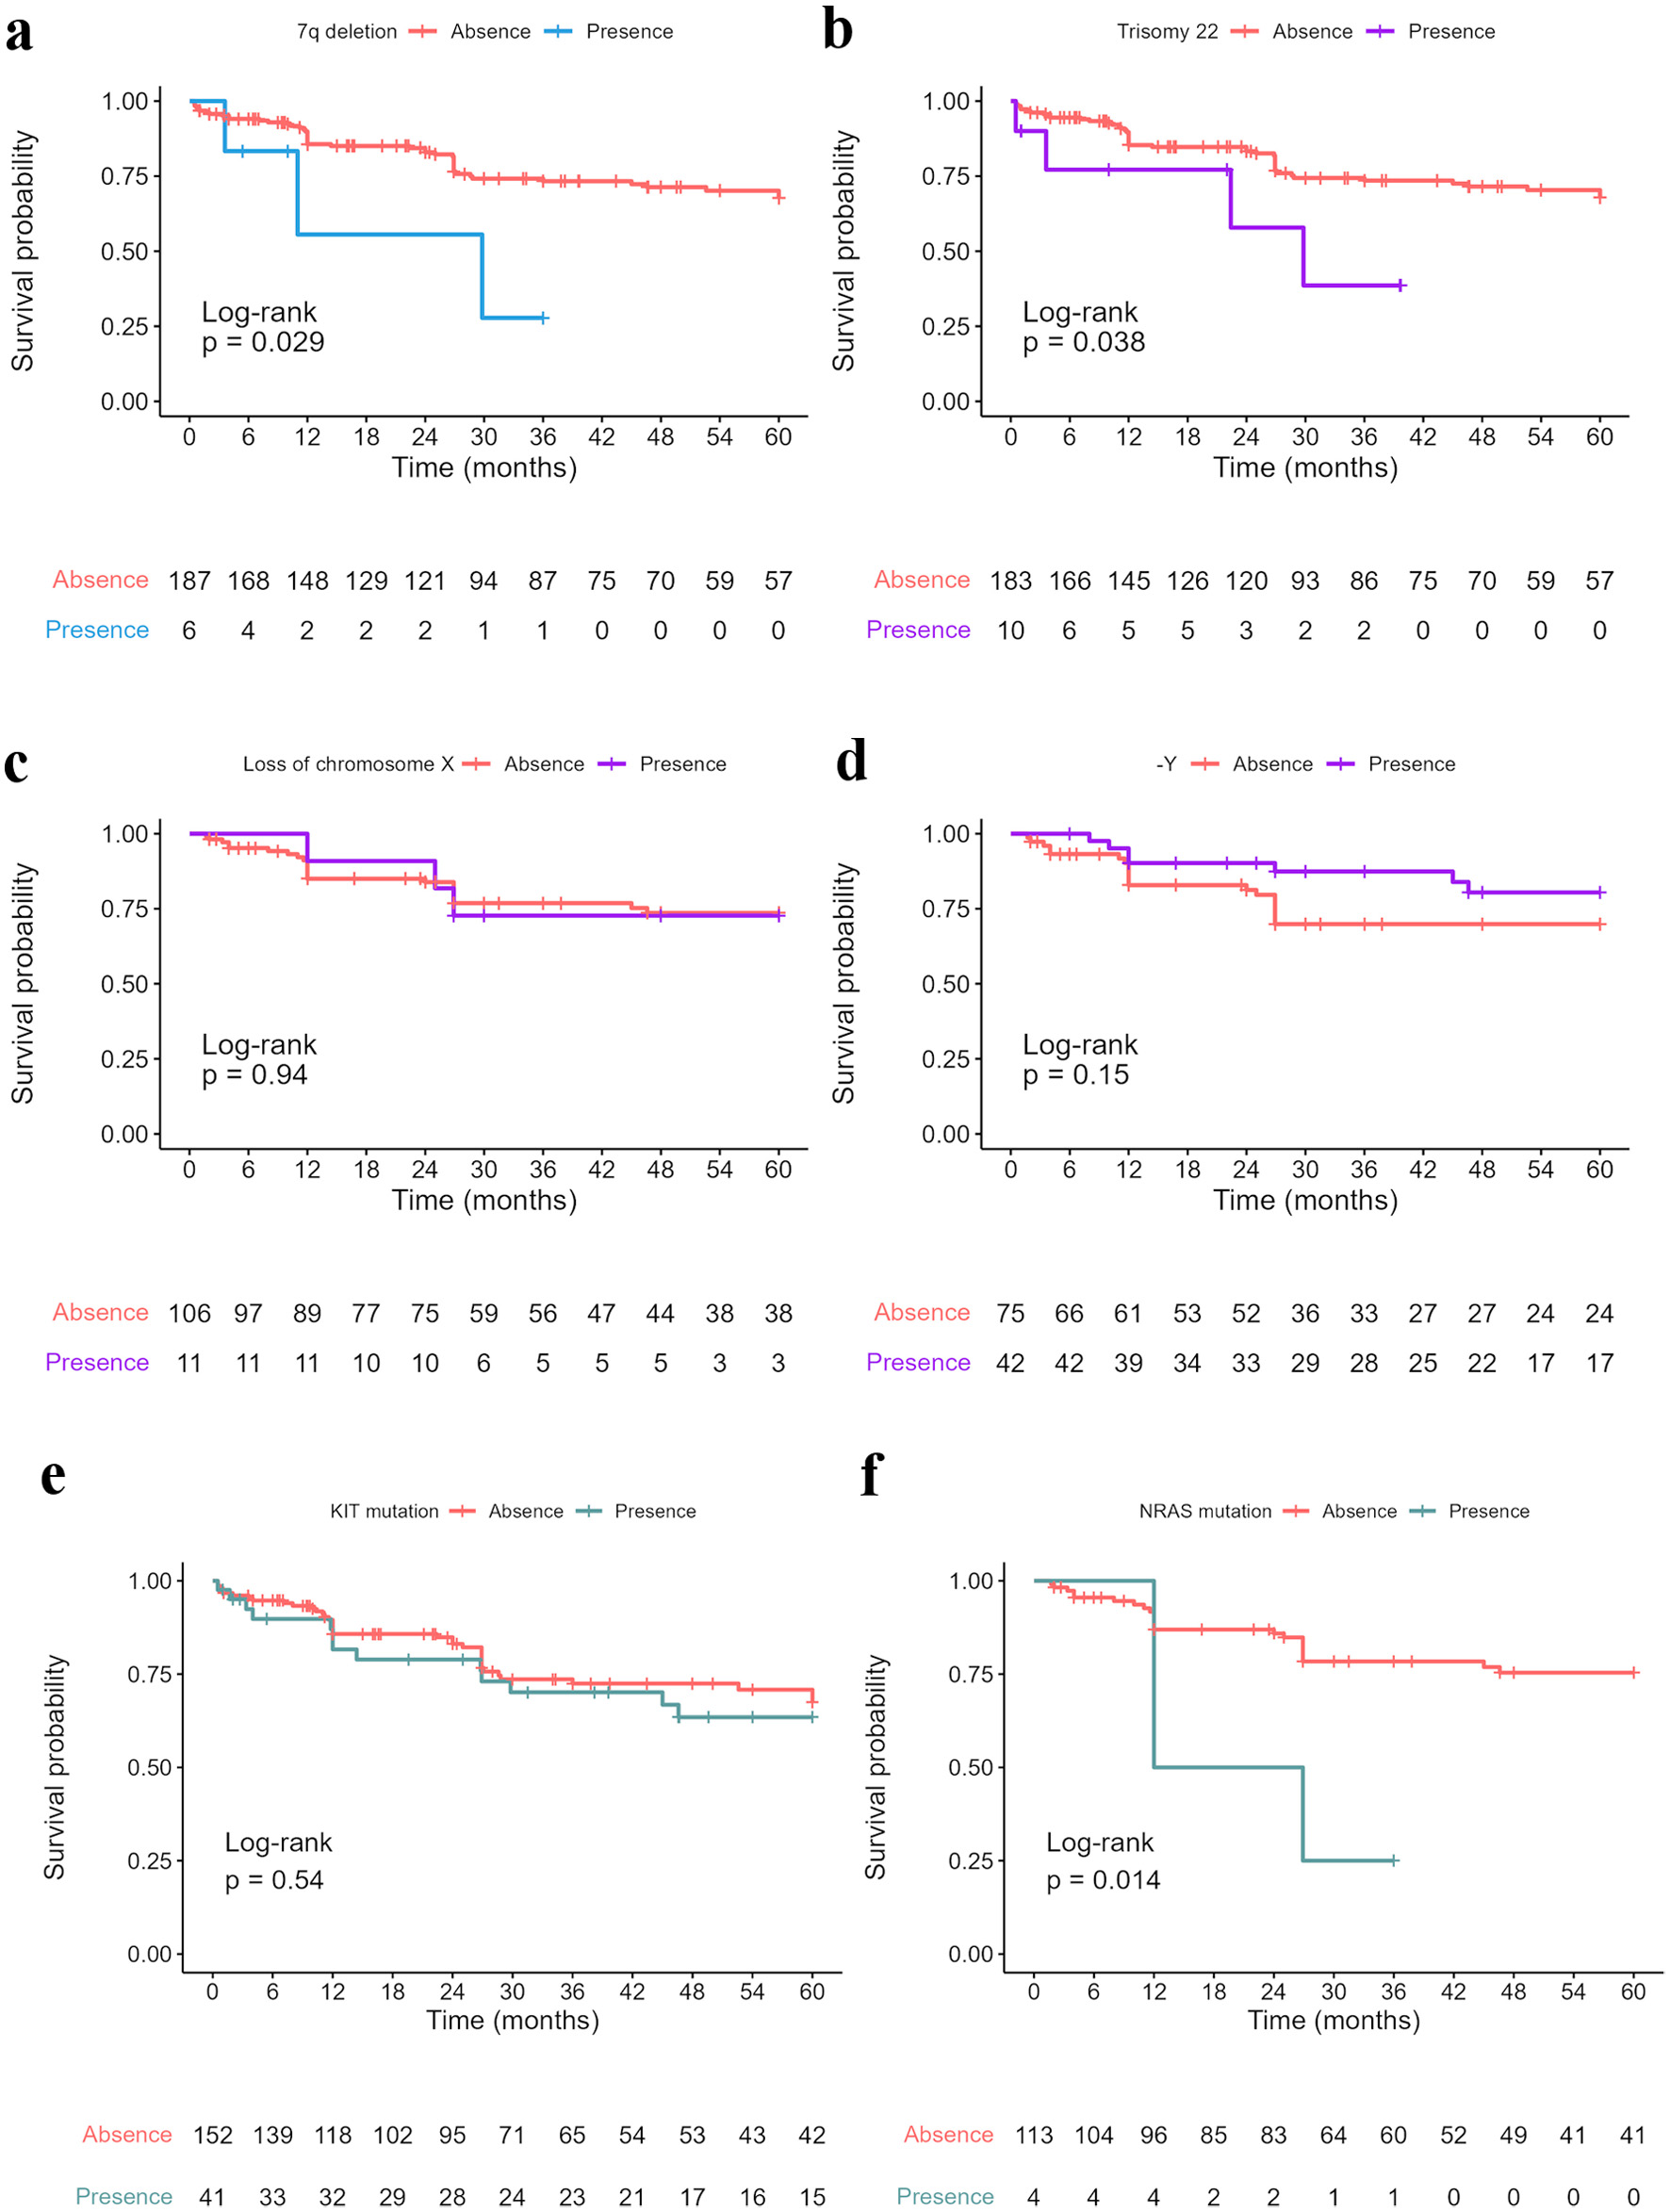
Figure 3. Five-year survival data of CBF-AML cases with specific secondary genetic aberration: (a) 7q deletion “del(7)” (5-year OS in total sample: 27.8%, 95% CI: 5.39 - 100, versus 67.7%, 95% CI: 60.1 - 76.2); (b) Trisomy 22 “+22” (5-year OS in total sample: 38.6%, 95% CI: 13.5 - 100, versus 67.9%, 95% CI: 60.2 - 76.5); (c) Loss of chromosome X “-X” (5-year OS in t(8;21) group: 72.7%, 95% CI: 50.6 - 100, versus 73.6%, 95% CI: 64.9 - 83.5); (d) Loss of chromosome Y “-Y” (5-year OS in t(8;21) group: 80.4%, 95% CI: 68.2 - 94.9, versus 69.9%, 95% CI: 59.6 - 82.0); (e) KIT mutation (5-year OS in total sample: 63.5%, 95% CI: 49.2 - 81.8, versus 67.4%, 95% CI: 58.7 - 77.4); (f) NRAS mutation (5-year OS in t(8;21) group: 25.0%, 95% CI: 4.58 - 100, versus 75.4%, 95% CI: 67.1 - 84.7). -Y: loss of chromosome Y; KIT: receptor tyrosine kinase gene KIT mutation; NRAS: neuroblastoma RAS viral gene mutation. CI: confidence interval; OS: overall survival.

Tables

Table 1. Characteristics of 193 CBF-AML Cases From Mitelman Database Between 2010 and 2021
 
VariableOverall (n = 193), n (%)inv(16) (n = 76), n (%)t(8;21) (n = 117), n (%)P value
aMedian (IQR). bPearson’s Chi-squared test. cWilcoxon rank sum test. dFisher’s exact test. del(7): deletion of chromosome 7; del(9): deletion of chromosome 9; t(9;22): chromosomal translocation t(9;22); +8: trisomy 8; +22: trisomy 22; -X: loss of chromosome X; -Y: loss of chromosome Y; BCR-ABL1: BCR-ABL1 fusion gene mutation; BRCC3: BRCA1/BRCA2-containing complex 3 gene mutation; NRAS: neuroblastoma RAS viral gene mutation; KRAS: Kirsten rat sarcoma virus gene mutation; KIT: receptor tyrosine kinase gene KIT mutation; CCND1: cyclin D1 gene mutation; CCND2: cyclin D2 gene mutation; ASXL1: ASXL transcriptional regulator 1 gene mutation; ASXL2: ASXL transcriptional regulator 2 gene mutation; FLT3: FMS-like tyrosine kinase 3 gene mutation; CBF-AML: core binding factor acute myeloid leukemia; AML: acute myeloid leukemia.
Sex0.404b
  Female73 (37.8)26 (34.2)47 (40.2)
  Male120 (62.2)50 (65.8)70 (59.8)
Age at diagnosis (median)43.0 (25.0, 53.0)a40.5 (28.8, 53.2)a45.0 (23.0, 52.0)a0.748c
Age group (years)0.230b
  Pediatric (< 18)31 (16.1)8 (10.5)23 (19.7)
  Adult (18 - 64)142 (73.6)59 (77.6)83 (70.9)
  Elderly (≥ 65)20 (10.4)9 (11.8)11 (9.4)
FAB classification< 0.001d
  AML without maturation (M1)9 (4.7)2 (2.6)7 (6.0)
  AML with maturation (M2)33 (17.1)3 (3.9)30 (25.6)
  Acute promyelocytic leukemia (M3)1 (0.5)0 (0.0)1 (0.9)
  Acute myelomonocytic leukemia (M4)20 (10.4)18 (23.7)2 (1.7)
  Acute monoblastic or monocytic leukemia (M5)2 (1.0)1 (1.3)1 (0.9)
  AML not otherwise specified (NOS)128 (66.3)52 (68.4)76 (65.0)
Chromosome number< 0.001b
  < 4654 (28.0)0 (0.0)54 (46.2)
  46112 (58.0)55 (72.4)57 (48.7)
  > 4627 (14.0)21 (27.6)6 (5.1)
Structural chromosome rearrangements50 (25.9)22 (28.9)28 (23.9)0.437b
  del(7)6 (3.1)4 (5.3)2 (1.7)0.214d
  del(9)12 (6.2)0 (0.0)12 (10.3)0.004d
  t(9;22)9 (4.7)8 (10.5)1 (0.9)0.003d
Numerical chromosome abnormalities79 (40.9)21 (27.6)58 (49.6)0.002b
  +812 (6.2)10 (13.2)2 (1.7)0.002d
  +2210 (5.2)10 (13.2)0 (0.0)< 0.001d
  -X11 (5.7)0 (0.0)11 (9.4)0.004d
  -Y42 (21.8)0 (0.0)42 (35.9)< 0.001b
Secondary genetic mutations106 (54.9)40 (52.6)66 (56.4)0.606b
  BCR-ABL112 (6.2)12 (15.8)0 (0.0)< 0.001d
  BRCC38 (4.1)0 (0.0)8 (6.8)0.023d
  NRAS8 (4.1)4 (5.3)4 (3.4)0.714d
  KRAS2 (1.0)2 (2.6)0 (0.0)0.154d
  KIT41 (21.2)17 (22.4)24 (20.5)0.758b
  CCND13 (1.6)0 (0.0)3 (2.6)0.280d
  CCND210 (5.2)0 (0.0)10 (8.5)0.007d
  ASXL111 (5.7)1 (1.3)10 (8.5)0.053d
  ASXL211 (5.7)0 (0.0)11 (9.4)0.004d
  FLT311 (5.7)5 (6.6)6 (5.1)0.755d
Relapse134 (69.4)61 (80.3)73 (62.4)0.008b
Status0.266b
  Alive143 (74.1)53 (69.7)90 (76.9)
  Dead50 (25.9)23 (30.3)27 (23.1)
Overall survival (months)28.8 (12.0, 60.0)a23.2 (10.0, 50.6)a36.0 (16.8, 60.0)a0.009c


Table 2. Differences in the Characteristics of 193 CBF-AML Cases With Chromosome Aberrations
 
VariableOverall (n = 193), n (%)del(7) (n = 6), n (%)del(9) (n = 12), n (%)t(9;22) (n = 9), n (%)+8 (n = 12), n (%)+22 (n = 10), n (%)-X (n = 11), n (%)-Y (n = 42), n (%)
aMedian (IQR). bFisher’s exact test. cWilcoxon rank sum test. dPearson’s Chi-squared test. del(7): deletion of chromosome 7; del(9): deletion of chromosome 9; t(9;22): chromosomal translocation t(9;22); +8: trisomy 8; +22: trisomy 22; -X: loss of chromosome X; -Y: loss of chromosome Y; CBF-AML: core binding factor acute myeloid leukemia.
CBF-AML group
  inv(16)76 (39.4)4 (66.7)0 (0.0)8 (88.9)10 (83.3)10 (100.0)0 (0.0)0 (0.0)
  t(8;21)117 (60.6)2 (33.3)12 (100.0)1 (11.1)2 (16.7)0 (0.0)11 (100.0)42 (100.0)
  P value0.214b0.004b0.003b0.002b< 0.001b0.004b< 0.001d
Sex
  Female73 (37.8)2 (33.3)4 (33.3)3 (33.3)5 (41.7)4 (40.0)11 (100.0)0 (0.0)
  Male120 (62.2)4 (66.7)8 (66.7)6 (66.7)7 (58.3)6 (60.0)0 (0.0)42 (100.0)
  P value> 0.999b> 0.999b> 0.999b> 0.999b> 0.999b< 0.001b< 0.001d
Age at diagnosis (median)43.0 (25.0, 53.0)a43.5 (28.8, 50.0)a29.0 (19.0, 47.2)a38.0 (31.0, 49.0)a39.0 (29.8, 49.5)a43.5 (18.5, 47.8)a50.3 (37.0, 56.0)a42.5 (25.0, 50.3)a
  P value0.941c0.298c0.830c0.697c0.532c0.307c0.277c
Age group (years)
  Pediatric (< 18)31 (16.1)1 (16.7)2 (16.7)0 (0.0)2 (16.7)2 (20.0)2 (18.2)9 (21.4)
  Adult (18 - 64)142 (73.6)5 (83.3)9 (75.0)8 (88.9)9 (75.0)7 (70.0)8 (72.7)31 (73.8)
  Elderly (≥ 65)20 (10.4)0 (0.0)1 (8.3)1 (11.1)1 (8.3)1 (10.0)1 (9.1)2 (4.8)
  P value> 0.999b> 0.999b0.510b> 0.999b0.867b> 0.999b0.298b
Chromosome number
  < 4654 (28.0)0 (0.0)6 (50.0)1 (11.1)0 (0.0)0 (0.0)10 (90.9)41 (97.6)
  46112 (58.0)4 (66.7)5 (41.7)5 (55.6)1 (8.3)0 (0.0)1 (9.1)0 (0.0)
  > 4627 (14.0)2 (33.3)1 (8.3)3 (33.3)11 (91.7)10 (100.0)0 (0.0)1 (2.4)
  P value0.137b0.246b0.191b< 0.001b< 0.001b< 0.001b< 0.001d
Relapse134 (69.4)6 (100.0)10 (83.3)6 (66.7)11 (91.7)9 (90.0)7 (63.6)29 (69.0)
  P value0.180b0.351b> 0.999b0.110b0.288b0.739b0.952d
Status
  Alive143 (74.1)3 (50.0)9 (75.0)7 (77.8)7 (58.3)6 (60.0)8 (72.7)35 (83.3)
  Dead50 (25.9)3 (50.0)3 (25.0)2 (22.2)5 (41.7)4 (40.0)3 (27.3)7 (16.7)
  P value0.181b> 0.999b> 0.999b0.304b0.287b> 0.999b0.122d
Overall survival (months)28.8 (12.0, 60.0)a10.5 (6.6, 25.1)a33.0 (26.2, 48.0)a22.0 (10.0, 65.0)a23.1 (6.2, 66.5)a16.0 (1.7, 28.0)a30.0 (26.9, 54.0)a48.0 (26.9, 93.5)a
  P value0.050c0.716c0.649c0.406c0.011c0.506c0.004c


Table 3. Univariate and Multivariate Cox Regression of Survival Outcomes in Patients With CBF-AML
 
VariableUnivariate Cox regressionMultivariate Cox regressiona
HR95% CIP valueHR95% CIP value
aAll multivariate analyses were adjusted for sex, age group and relapse. del(7): deletion of chromosome 7; +22: trisomy 22; -X: loss of chromosome X; -Y: loss of chromosome Y; NRAS: neuroblastoma RAS viral gene mutation; KIT: receptor tyrosine kinase gene KIT mutation; CBF-AML: core binding factor acute myeloid leukemia; HR: hazard ratio; 95% CI: 95% confidence interval.
Structural chromosome rearrangements0.950.50 - 1.800.8840.960.50 - 1.900.915
  del(7)3.401.00 - 11.000.0414.201.27 - 14.200.019
Numerical chromosome abnormalities0.640.36 - 1.200.1390.790.42 - 1.500.456
  +222.81.00 - 7.900.0493.601.26 - 10.500.017
  -X1.000.31 - 3.500.9460.740.21 - 2.600.642
  -Y0.540.23 - 1.300.161.100.33 - 3.800.856
Secondary genetic mutations1.200.67 - 2.100.5681.100.64 - 2.000.654
  NRAS4.001.20 - 13.000.0253.000.86 - 10.200.084
  KIT1.200.65 - 2.300.5431.100.57 - 2.100.807