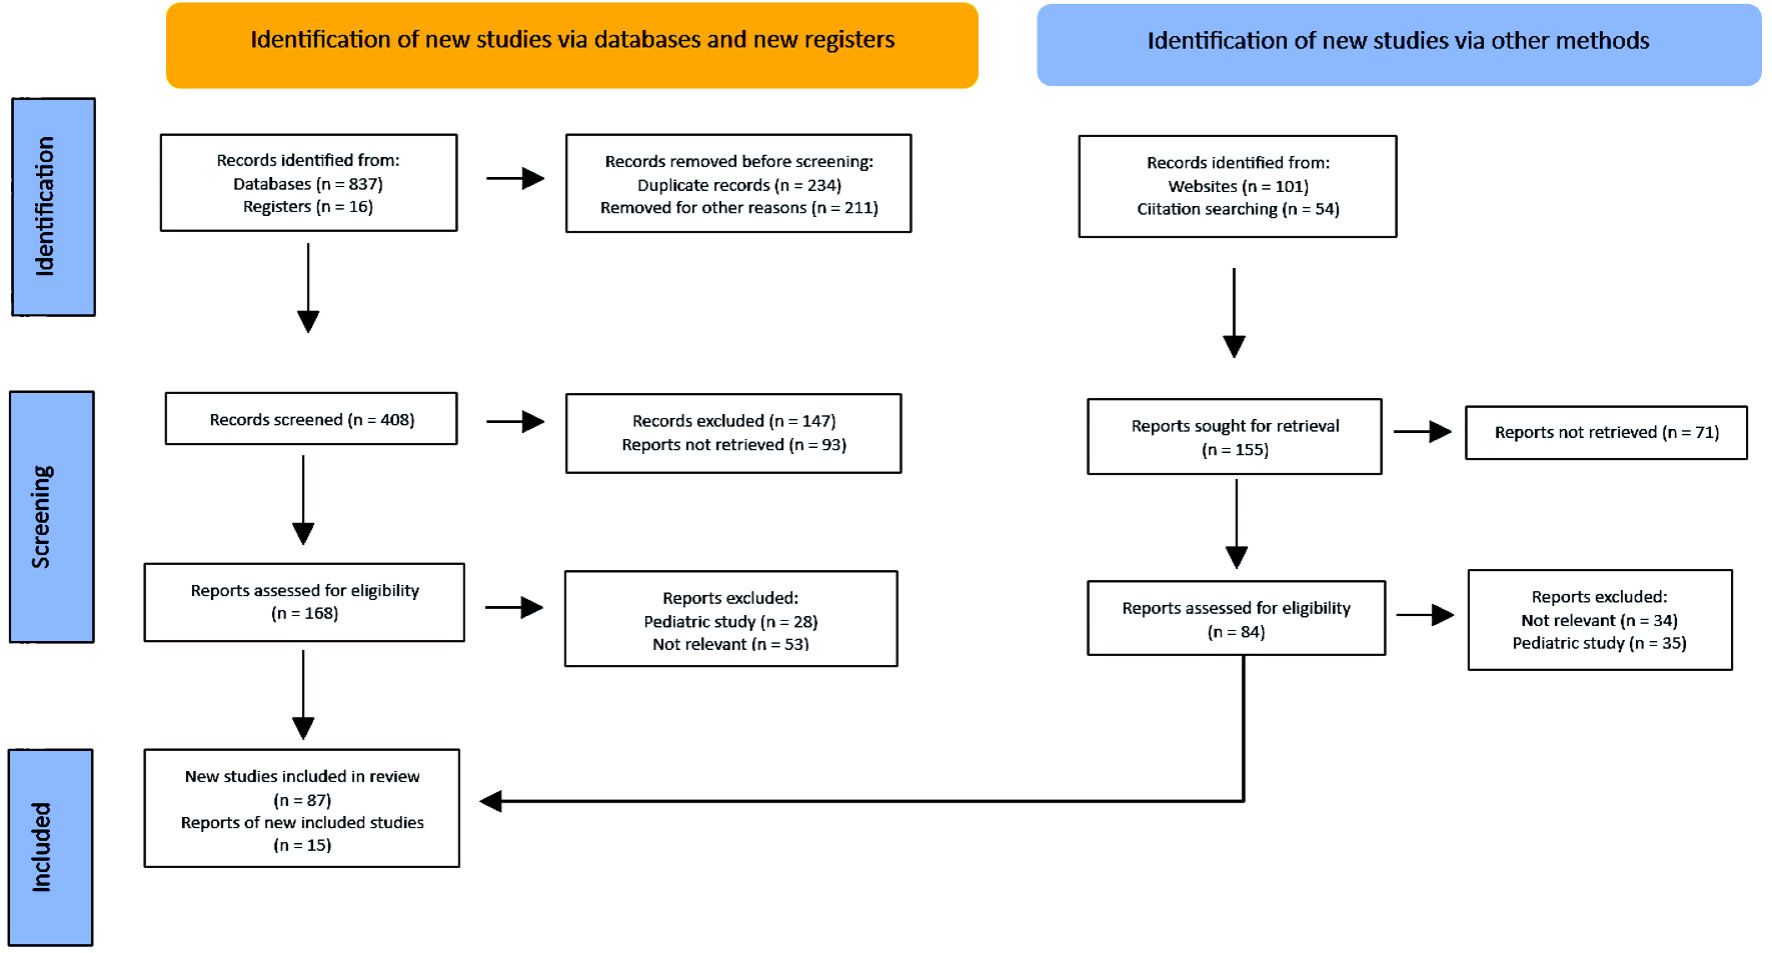
Figure 1. PRISMA flow diagram. Method for the selection of articles. PRISMA: Preferred Reporting Items for Systematic reviews and Meta-Analyses.
| World Journal of Oncology, ISSN 1920-4531 print, 1920-454X online, Open Access |
| Article copyright, the authors; Journal compilation copyright, World J Oncol and Elmer Press Inc |
| Journal website https://www.wjon.org |
Review
Volume 15, Number 1, February 2024, pages 14-27
Autoimmune Thyroid Disease and Differentiated Thyroid Carcinoma: A Review of the Mechanisms That Explain an Intriguing and Exciting Relationship
Figures
Tables
| Causes of hyperthyroidism | Measure of association (SIR) and risk of DTC | 95% CI |
|---|---|---|
| aMeta-analysis. bStudies that found significant results. CI: confidence interval; DTC: differentiated thyroid carcinoma; HR: hazard ratio; SIR: standardized incidence ratio. | ||
| Unspecified toxic nodular goitre | 0.46 | 0.12 - 1.82 |
| 1.17 | 0.42 - 3.21 | |
| 0.09b | 0.03 - 0.3b | |
| 0.65 | 0.19 - 2.22 | |
| Toxic uninodular goitre | 0.38 | 0.08 - 1.91 |
| 2.93 | 0.34 - 25.15 | |
| 5.85 | 0.6 - 57 | |
| 0.74 | 0.1 - 5.66 | |
| 0.65 | 0.19 - 2.21 | |
| 2.71 | 0.15 - 49.54 | |
| 1.26 | 0.44 - 3.57 | |
| 0.23 | 0.05 - 1.16 | |
| 0.62 | 0.06 - 6.07 | |
| 1.3 | 0.52 - 3.29 | |
| Toxic multinodular goitre | 0.35 | 0.06 - 1.91 |
| 1.7 | 0.4 - 7.2 | |
| 0.96 | 0.12 - 7.55 | |
| 1.23 | 0.21 - 7.04 | |
| 0.74 | 0.28 - 1.95 | |
| 1.4 | 0.15 - 13.44 | |
| 1.67 | 0.62 - 4.51 | |
| 3.25 | 0.44 - 23.9 | |
| 0.94 | 0.1 - 8.56 | |
| 1.66 | 0.69 - 3.97 | |
| Toxic nodules | 3.94 (overall)b | 2.57 - 5.77b |
| 4.87 (men) | 0.59 - 17.6 | |
| 3.88 (women)b | 2.48 - 5.77b | |
| TSH levels below the normal range | 2.65 (overall)b | 1.27 - 5.52b |
| 1.07 (men) | 0.25 - 4.62 | |
| 3.74 (women)b | 1.53 - 9.19b | |
| Graves-Basedow diseasea | 1.0 | 0.68 - 1.46 |
| Graves-Basedow diseasea | 0.89 | 0.63 - 1.26 |
| Graves-Basedow diseasea | 5.3b | 2.4 - 11.6b |
| Graves-Basedow disease | 2.67 | 1.00 - 7.18 |
| Graves-Basedow disease | 3.77 (overall)b | 2.94 - 4.75b |
| 5.84 (men)b | 2.52 - 11.5b | |
| 3.61 (women)b | 2.77 - 4.61b | |
| Graves-Basedow disease | HR: 2.98 (men)b | 1.08 - 8.19b |
| HR: 1.60 (women)b | 1.11 - 2.31b | |
| Hyperthyroidism (global) | HR: 6.80b | 3.584 - 12.91b |
| Causes of hypothyroidism | Measures of association (SIR) and risk of DTC | 95% CI |
|---|---|---|
| aMeta-analysis. bStudies that found significant results. CI: confidence interval; CLT: chronic lymphocytic thyroiditis; DTC: differentiated thyroid carcinoma; FTC: follicular thyroid carcinoma; PTC: papillary thyroid carcinoma; SIR: standardized incidence ratio; HT: Hashimoto’s thyroiditis. | ||
| Studies in patients with Hashimoto’s thyroiditis | 1.93b | 1.6 - 2.34b |
| 2.24b | 1.22 - 4.11b | |
| 4.16b | 2.87 - 6.04b | |
| 3.02b | 1.94 - 4.69b | |
| 1.64b | 1.38 - 1.95b | |
| 1.34 | 0.96 - 1.85 | |
| 1.56 | 0.68 - 3.58 | |
| 1.80b | 1.53 - 2.11b | |
| 0.99 | 0.65 - 1.50 | |
| 1.57b | 1.38 - 1.78b | |
| 2.33 | 0.92 - 5.92 | |
| 1.39b | 1.26 - 1.52b | |
| 2.52 | 0.36 - 17.81 | |
| 1.58b | 1.45 - 1.71b | |
| 0.40 | 0.09 - 1.70 | |
| 1.44 | 0.97 - 2.13 | |
| 1.16 | 0.74 - 1.82 | |
| 11.8b | 4.24 - 33.1b | |
| 2.76a, b | 1.95 - 3.92b | |
| 1.49a, b | 1.42 - 1.57b | |
| 1.65 (for PTC)b and 0.73 (for FTC)a | 1.04 - 2.61b and 0.41 - 1.27 (respectively) | |
| 1.83a, b (for CLT (+) vs. CLT (-)) | 1.51 - 2.21b | |
| Genetic alterations | Outcomes in AITD and DTC |
|---|---|
| HT: Hashimoto’s thyroiditis; TC: thyroid cancer; AITD: autoimmune thyroid disease; DTC: differentiated thyroid carcinoma; PTC: papillary thyroid carcinoma. | |
| RET/PTC rearrangements | In experimental models in mice, designed to express RET/PTC, they more frequently develop thyroid hyperplasia, solid tumor variants of PTC and metastatic cancer and findings of chronic thyroiditis. In individuals who were exposed to radiation in the Chernobyl disaster and who had a diagnosis of HT, they more frequently developed RET/PTC-induced PTC. Between 3-60% of patients with PTC and around 90% of individuals with HT have this genetic alteration. |
| p63 protein | It is commonly expressed in PTC and in HT. |
| BRAFV600E | BRAFV600E mutation is less frequent in individuals where HT coexists with PTC. |
| PI3K/Akt pathway | Elevated expression of PI3K/Akt in individuals with HT and DTC. |