Figures
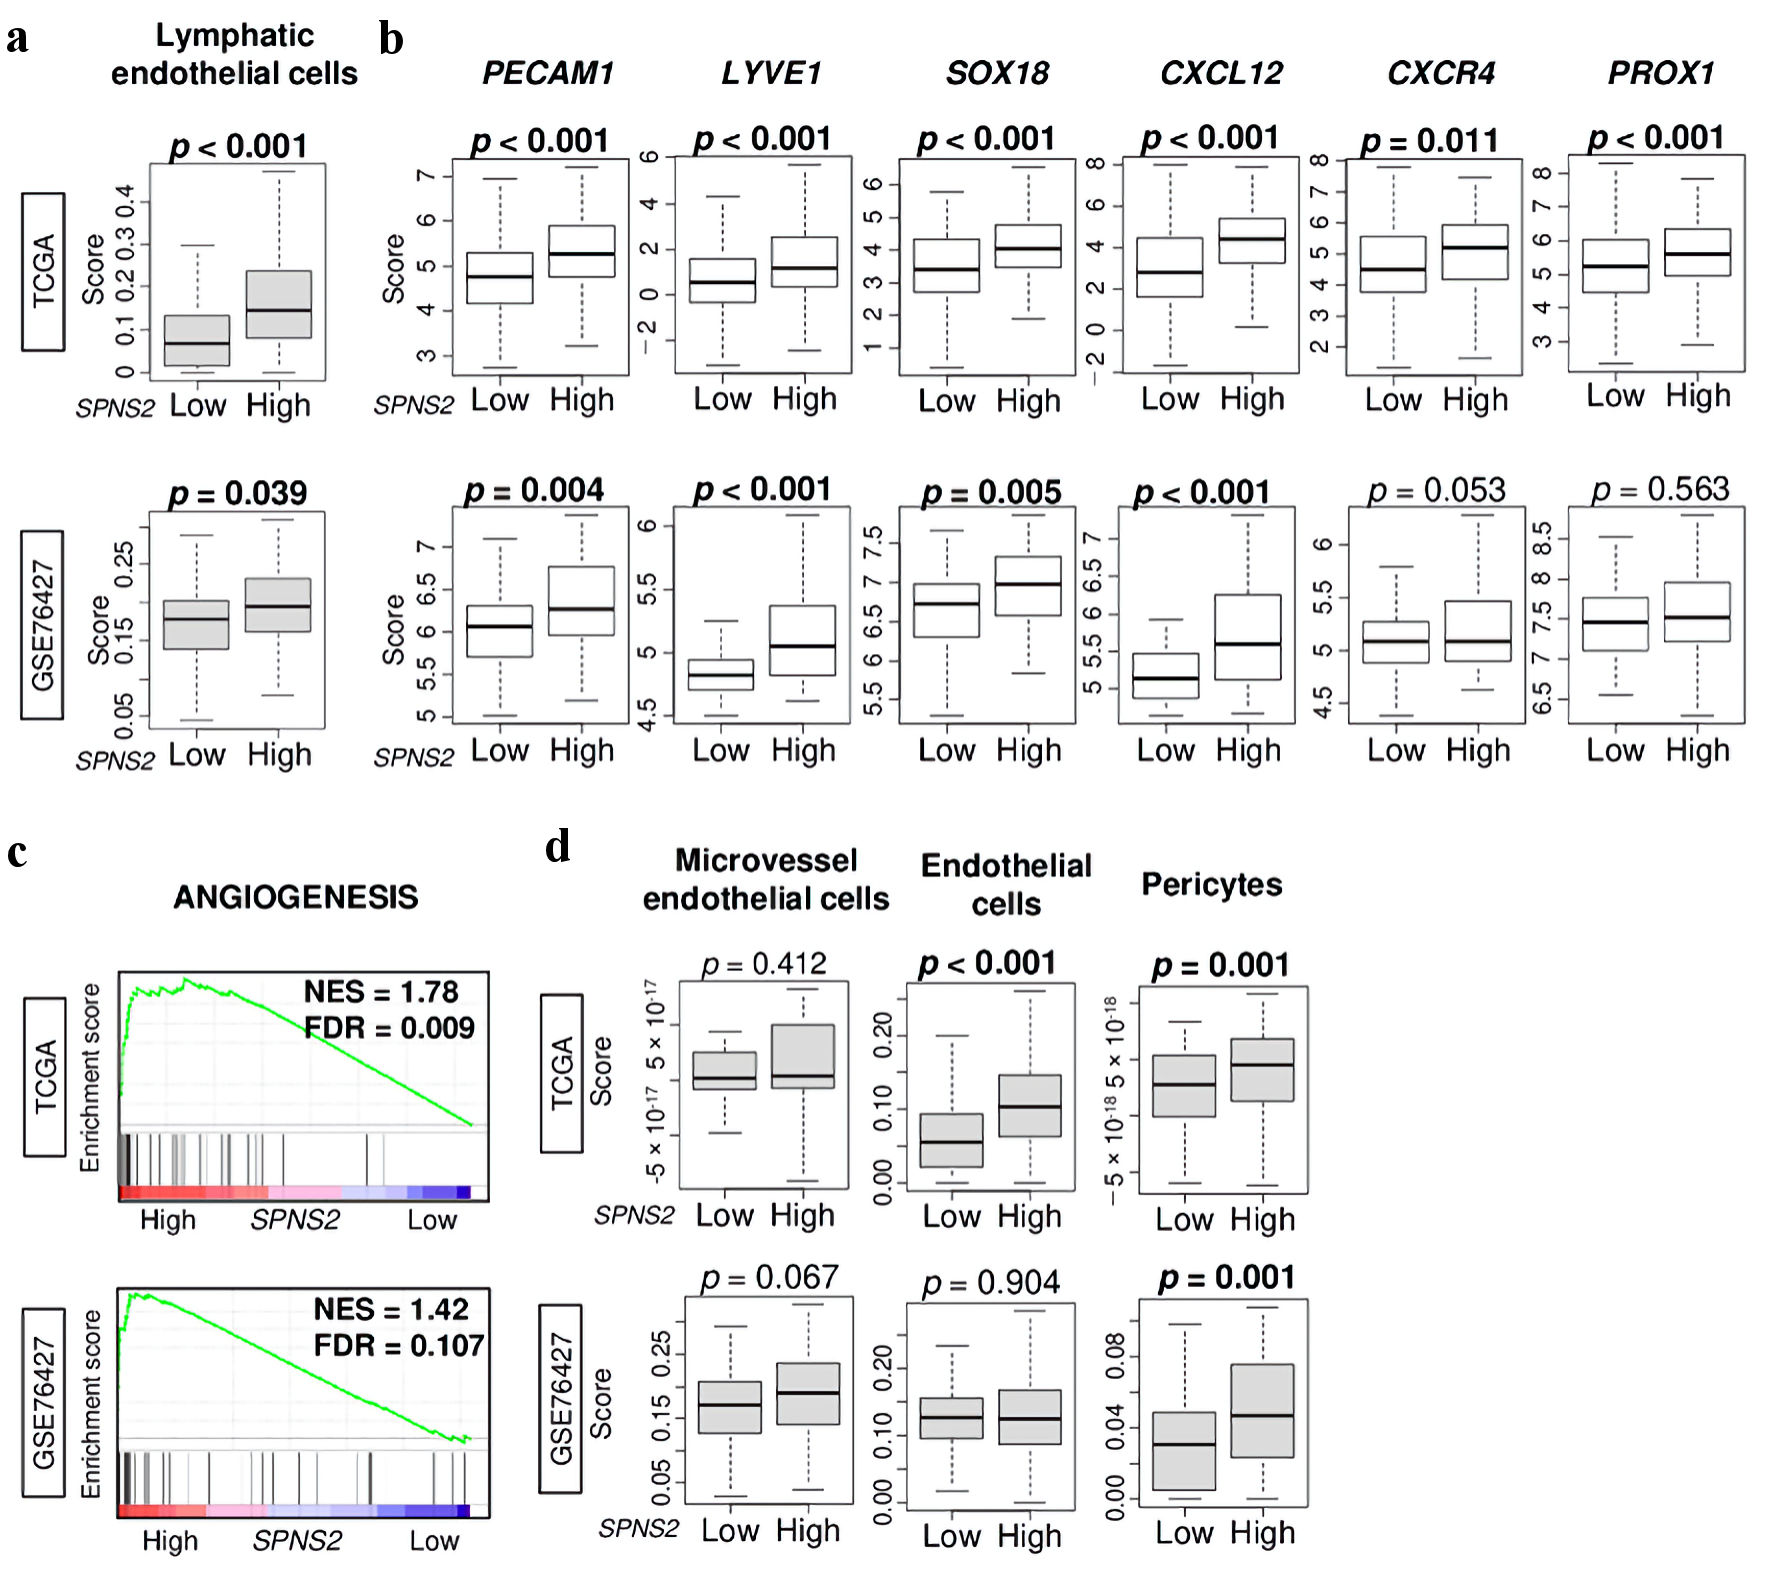
Figure 1. Lymphangiogenesis-related gene expressions by high vs. low SPNS2 expression in HCC of TCGA cohort. (a) Lymphatic endothelial cells estimated using xCell algorithm. (b) Gene expression levels of PECAM1, LYVE1, SOX18, CXCL12, CXCR4, and PROX1 in HCC of TCGA. (c) Gene set enrichment analysis (GSEA) of SPNS2 high HCC in two cohorts: angiogenesis-related pathway. The left side represents high expression, and the right side represents low expression of SPNS2. (d) Boxplots of microvascular endothelial cells, endothelial cells, and pericytes by low and high SPNS2 HCC estimated using xCell algorithm. CXCL: chemokine (C-X-C motif) ligand; CXCR: chemokine (C-X-C motif) receptor; HCC: hepatocellular carcinoma; PECAM: platelet endothelial cell adhesion molecule; PROX: Prospero homeobox; S1P: sphingosine-1-phosphate; SOX: Sry-type HMG box; SPNS2: spinster homologue 2; TCGA: The Cancer Genome Atlas.
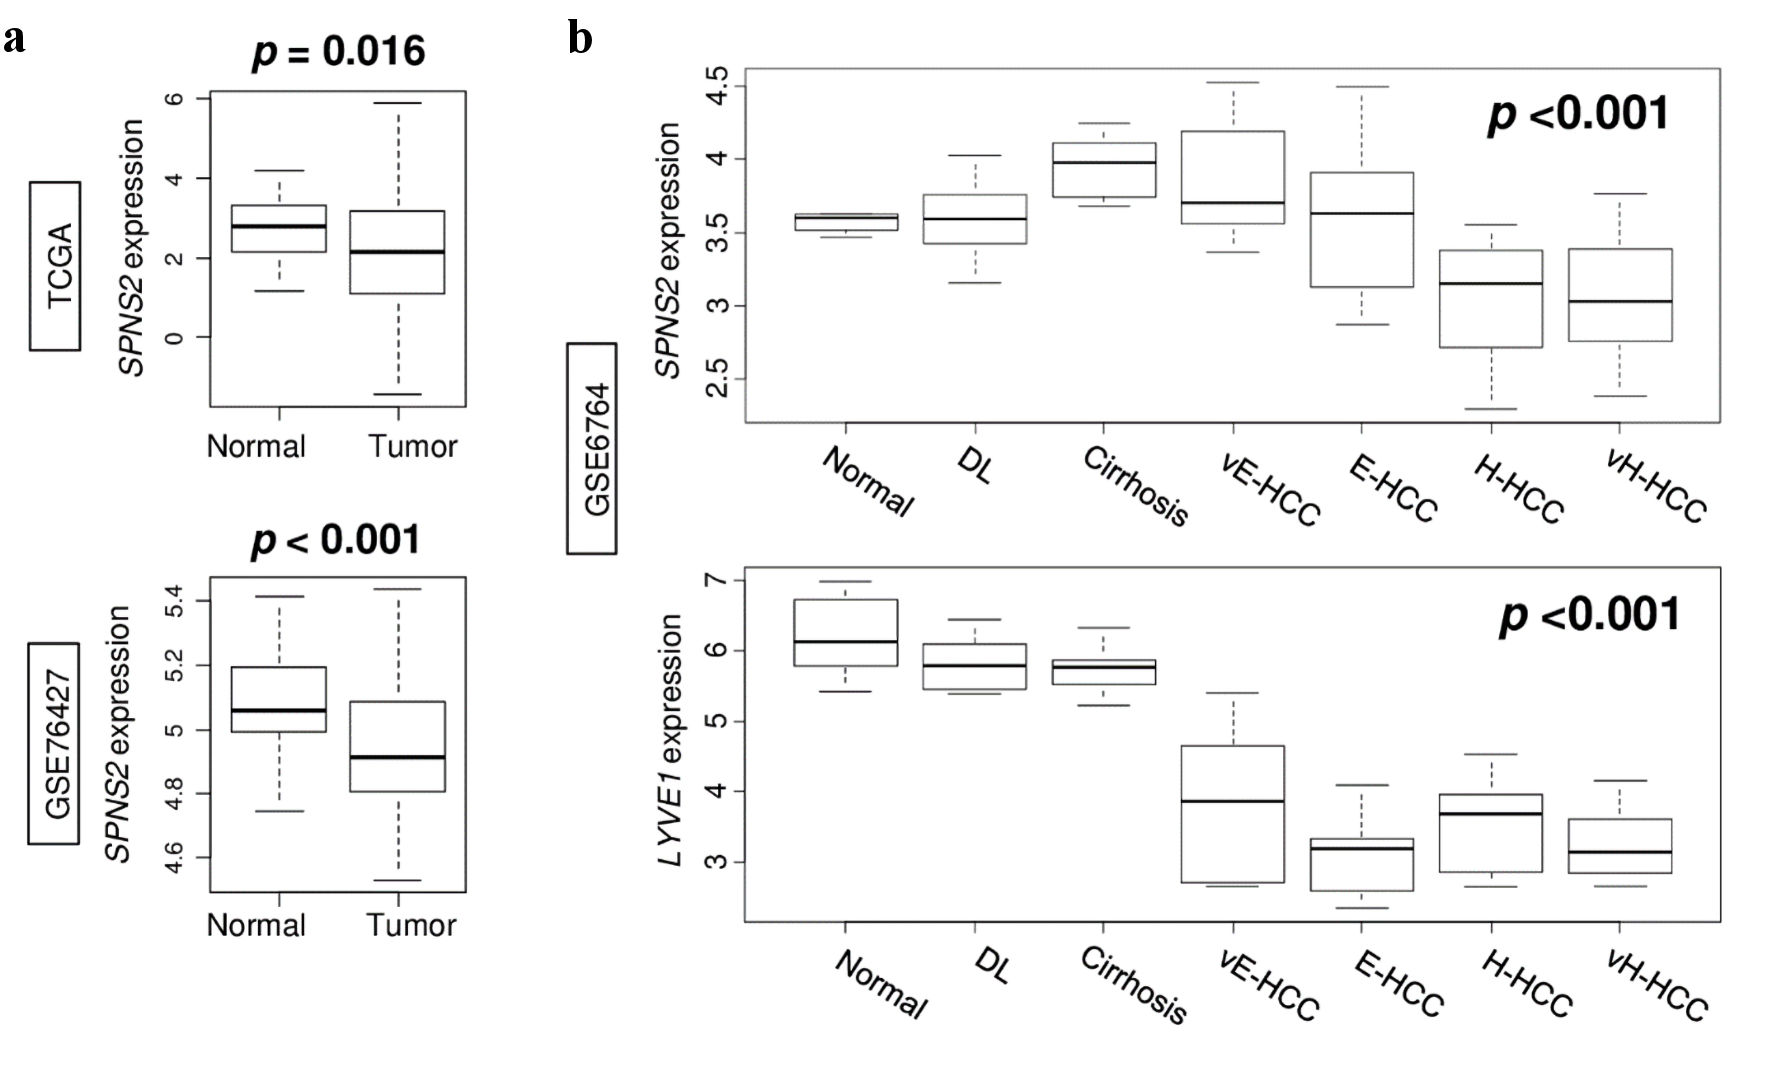
Figure 2. Gene expression in the spectrum of normal liver tissue to very advanced HCC. (a) SPNS2 expression in normal tissue compared to HCC tumors in TCGA and GSE76427 cohorts. (b) Expression of SPNS2 and lymphangiogenesis-related gene LYVE1 in GSE6764 cohort. vE-HCC: very early HCC; E-HCC: early HCC; H-HCC: advanced HCC; vH-HCC: very advanced HCC; HCC: hepatocellular carcinoma; TCGA: The Cancer Genome Atlas; SPNS2: spinster homologue 2; DL: dysplasia.
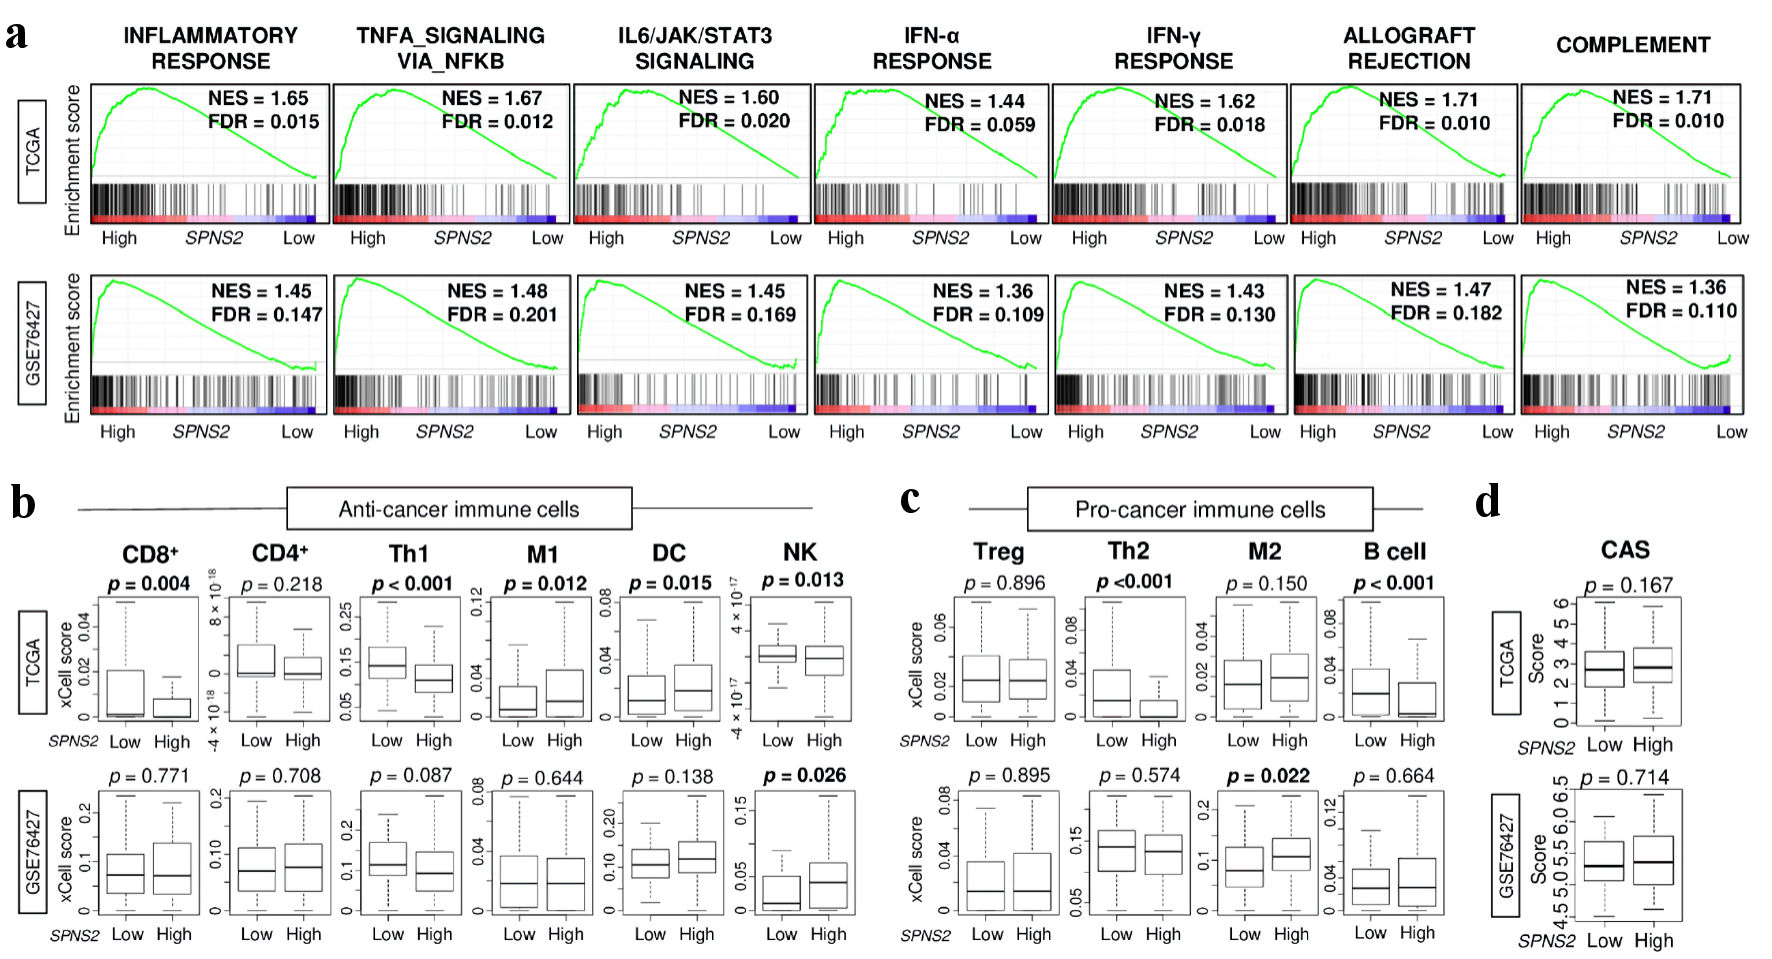
Figure 3. Immune response and immune cell infiltration in SPNS2-high HCC in two cohorts. (a) Gene set enrichment analysis (GSEA) of inflammation and immune response-related pathways: inflammatory response, TNF-α signaling, IL-6 signaling, IFN-α response, IFN-γ response, allograft rejection, and complement. The left side represents high expression, and the right side represents low expression of SPNS2. SPNS2 high and low expression groups were divided by median to perform the analysis. Normalized enrichment score (NES) and false discovery rate (FDR) of each analysis are shown in the graph. FDR of less than 0.25 were defined as statistically significant following the recommendation of the developer. (b) Estimated abundance of anti-cancer immune cells using xCell algorithm on each transcriptome (c) Estimated abundance of pro-cancer immune cells. (d) Cytolytic activity score (CAS). CD8: CD8 T cells; CD4: CD4 T cells; Th1: type 1 helper T cells; M1: M1 macrophage; DC: dendritic cells; NK: natural killer cells; Treg: regulatory T cells; Th2: type 2 helper T cells; M2: M2 macrophages; TNF: tumor necrosis factor; HCC: hepatocellular carcinoma; IFN: interferon; IL: interleukin; SPNS2: spinster homologue 2; TCGA: The Cancer Genome Atlas.
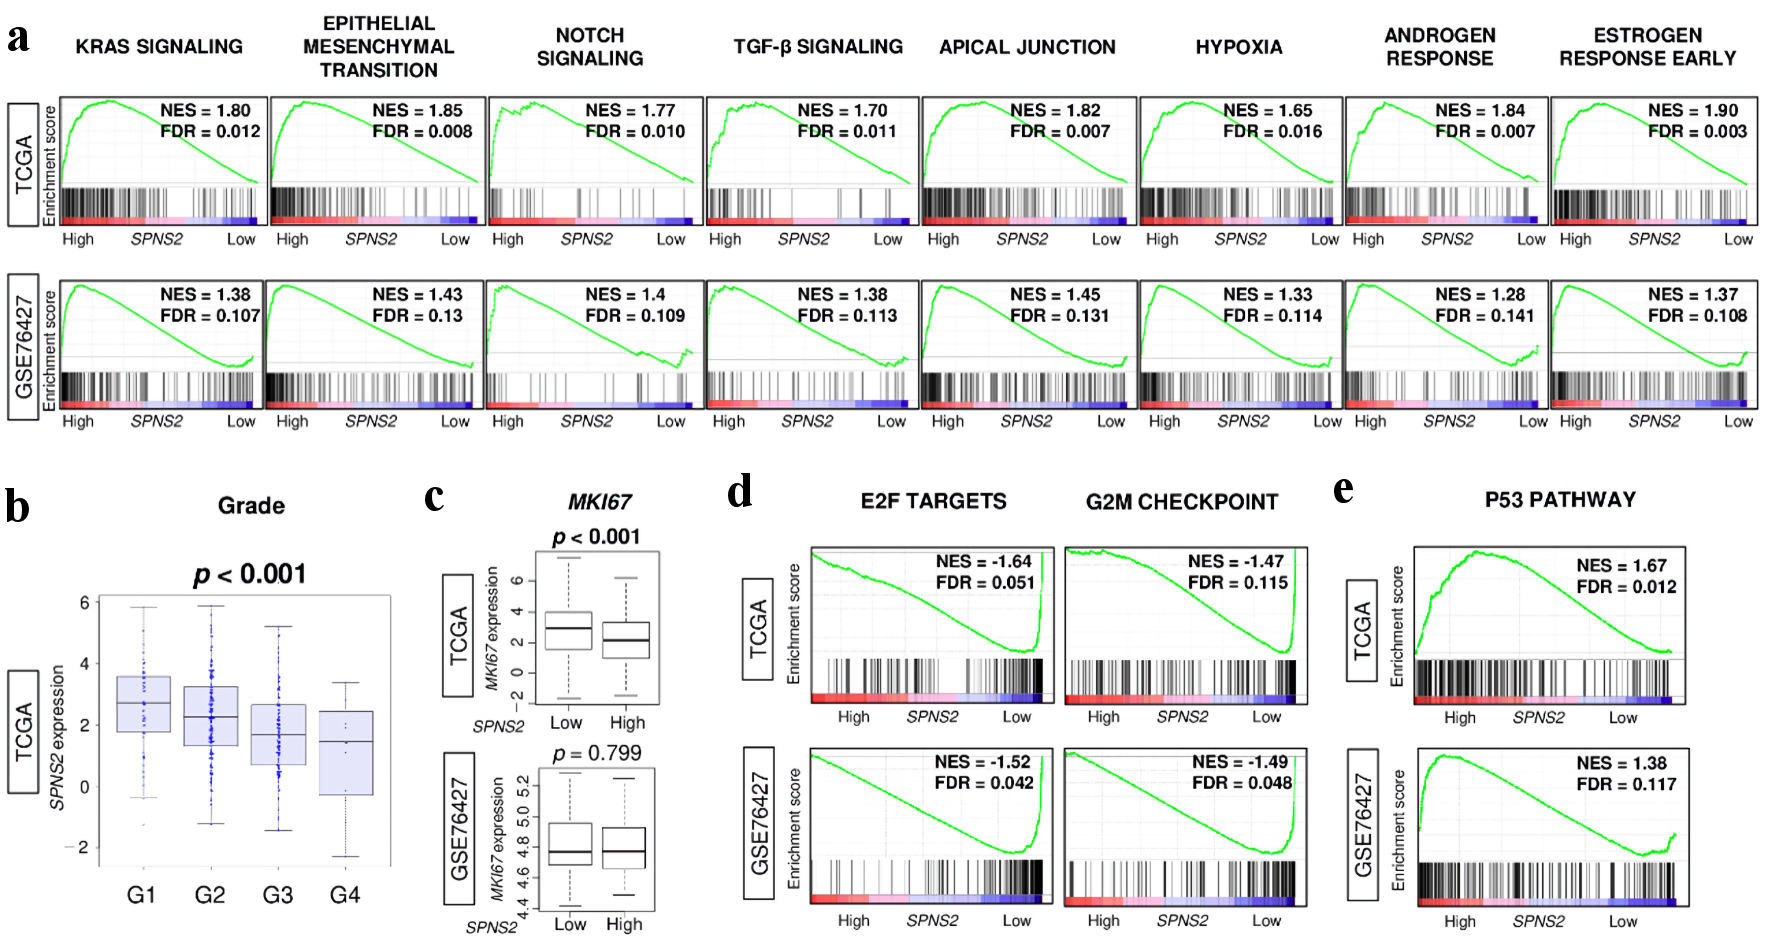
Figure 4. Tumor aggravating pathways were enriched to high SPNS2-expressing HCC, but it was associated with less cell proliferation. (a) Gene set enrichment analysis (GSEA) of tumor aggravating pathways in hallmark collection; KRAS signaling, epithelial mesenchymal transition (EMT), Notch signaling, TGF-β signaling, apical junction, hypoxia, androgen response, and estrogen response early. (b) SPNS2 gene expression levels by Nottingham histological grade in TCGA cohort. (c) Ki67 gene (MKI67) expression levels by high vs. low expression of SPNS2. GSEA of (d) cell proliferation-related gene sets in hallmark collection; E2F targets and G2M checkpoint, and (e) p53 pathway. FDR of less than 0.25 were defined as statistically significant following the recommendation by the Broad Institute. NES: normalized enrichment score; FDR: false discovery rate; E2F: cellular DNA binding activity regulating expression of E2 promoter; G2M: G2/M DNA damage checkpoint; HCC: hepatocellular carcinoma; KRAS: Kirsten rat sarcoma virus; MKI67: marker of proliferation Ki-67; SPNS2: spinster homologue 2; TCGA: The Cancer Genome Atlas; TGF: tumor growth factor.
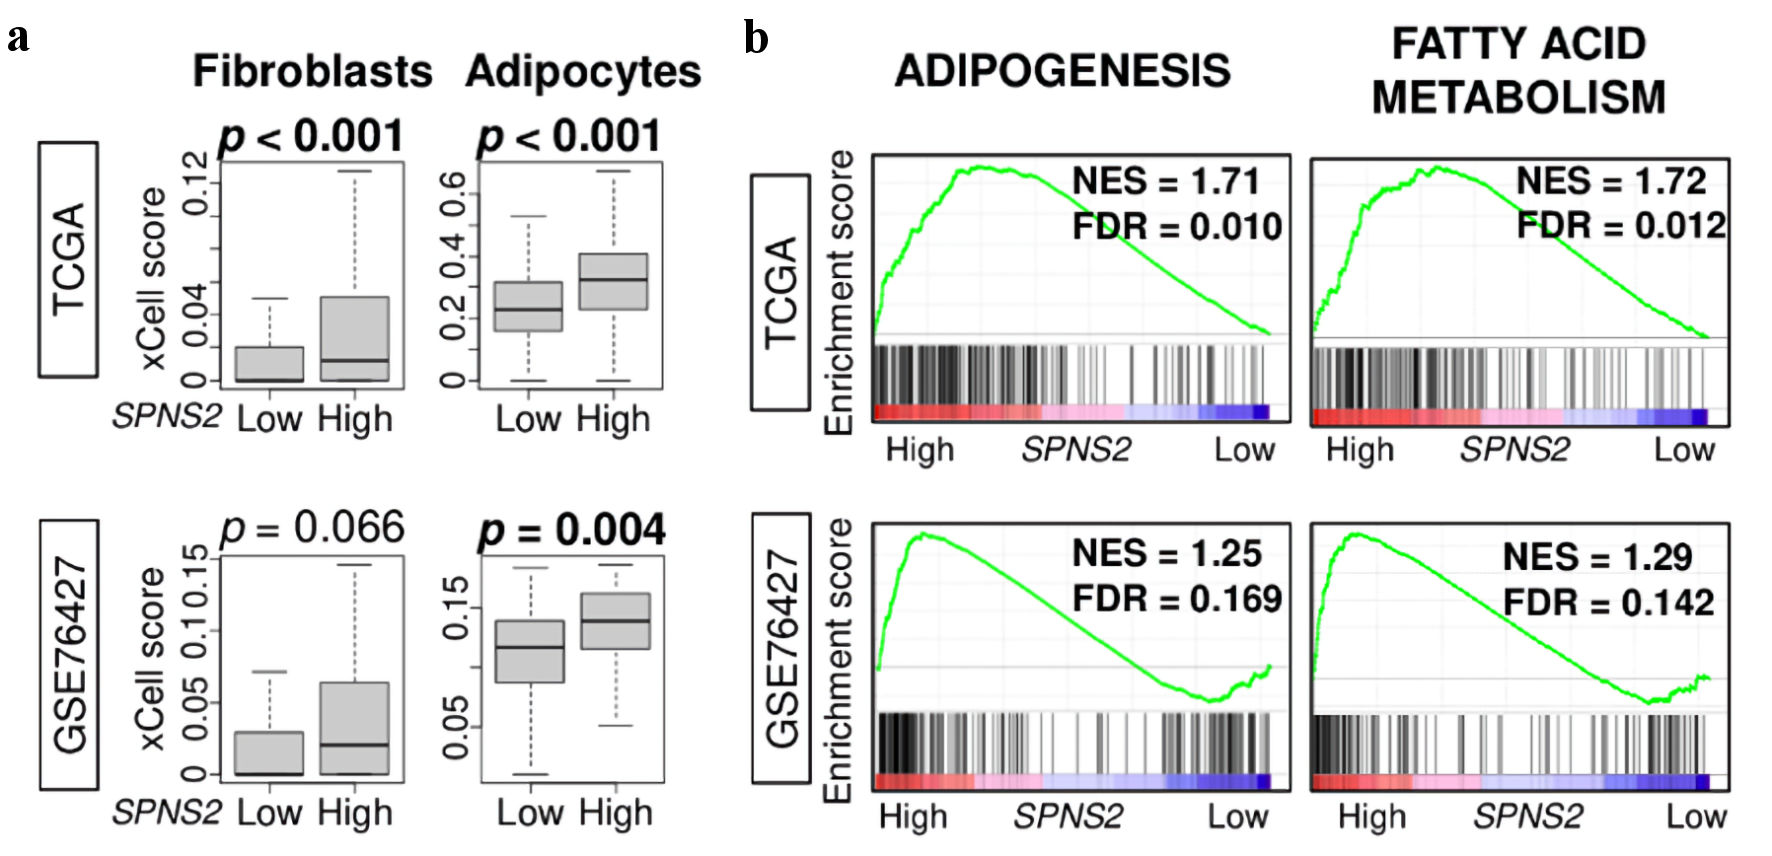
Figure 5. Stromal cell infiltration and metabolism related gene sets. (a) Estimated abundance of stromal cells using xCell algorithm. (b) Gene set enrichment analysis (GSEA) of metabolism-related pathways: adipogenesis, and fatty acid metabolism. The left side represents high expression, and the right side represents low expression of SPNS2. SPNS2 high and low expression groups were divided by median to perform the analysis. Normalized enrichment score (NES) and false discovery rate (FDR) of each analysis are shown in the graph. FDR of less than 0.25 were defined as statistically significant following the recommendation of the developer. SPNS2: spinster homologue 2; TCGA: The Cancer Genome Atlas.
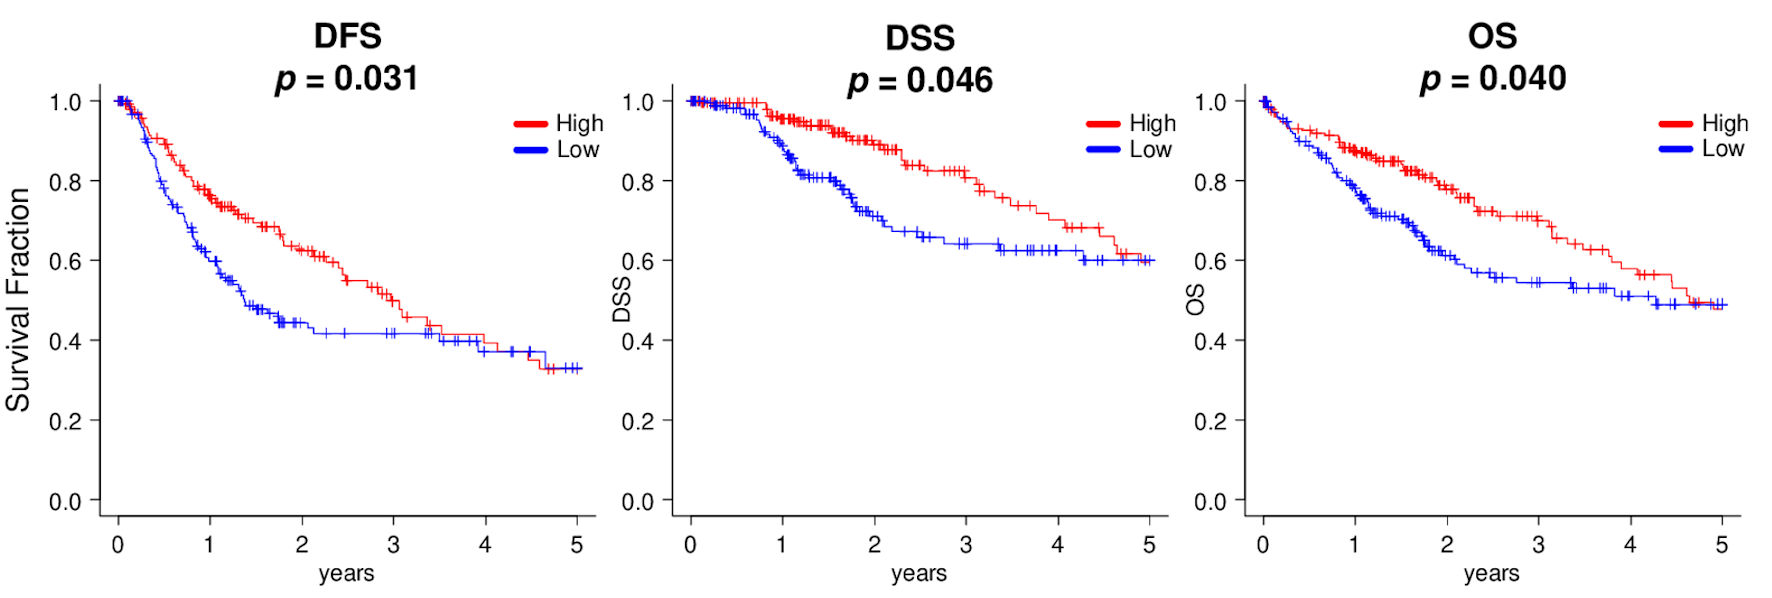
Figure 6. Kaplan-Meier survival analyses between high (red line) and low (blue line) expressions of SPNS2, divided by median cutoff in HCC patients of TCGA. DFS: disease-free survival; DSS: disease-specific survival; OS: overall survival.