Figures
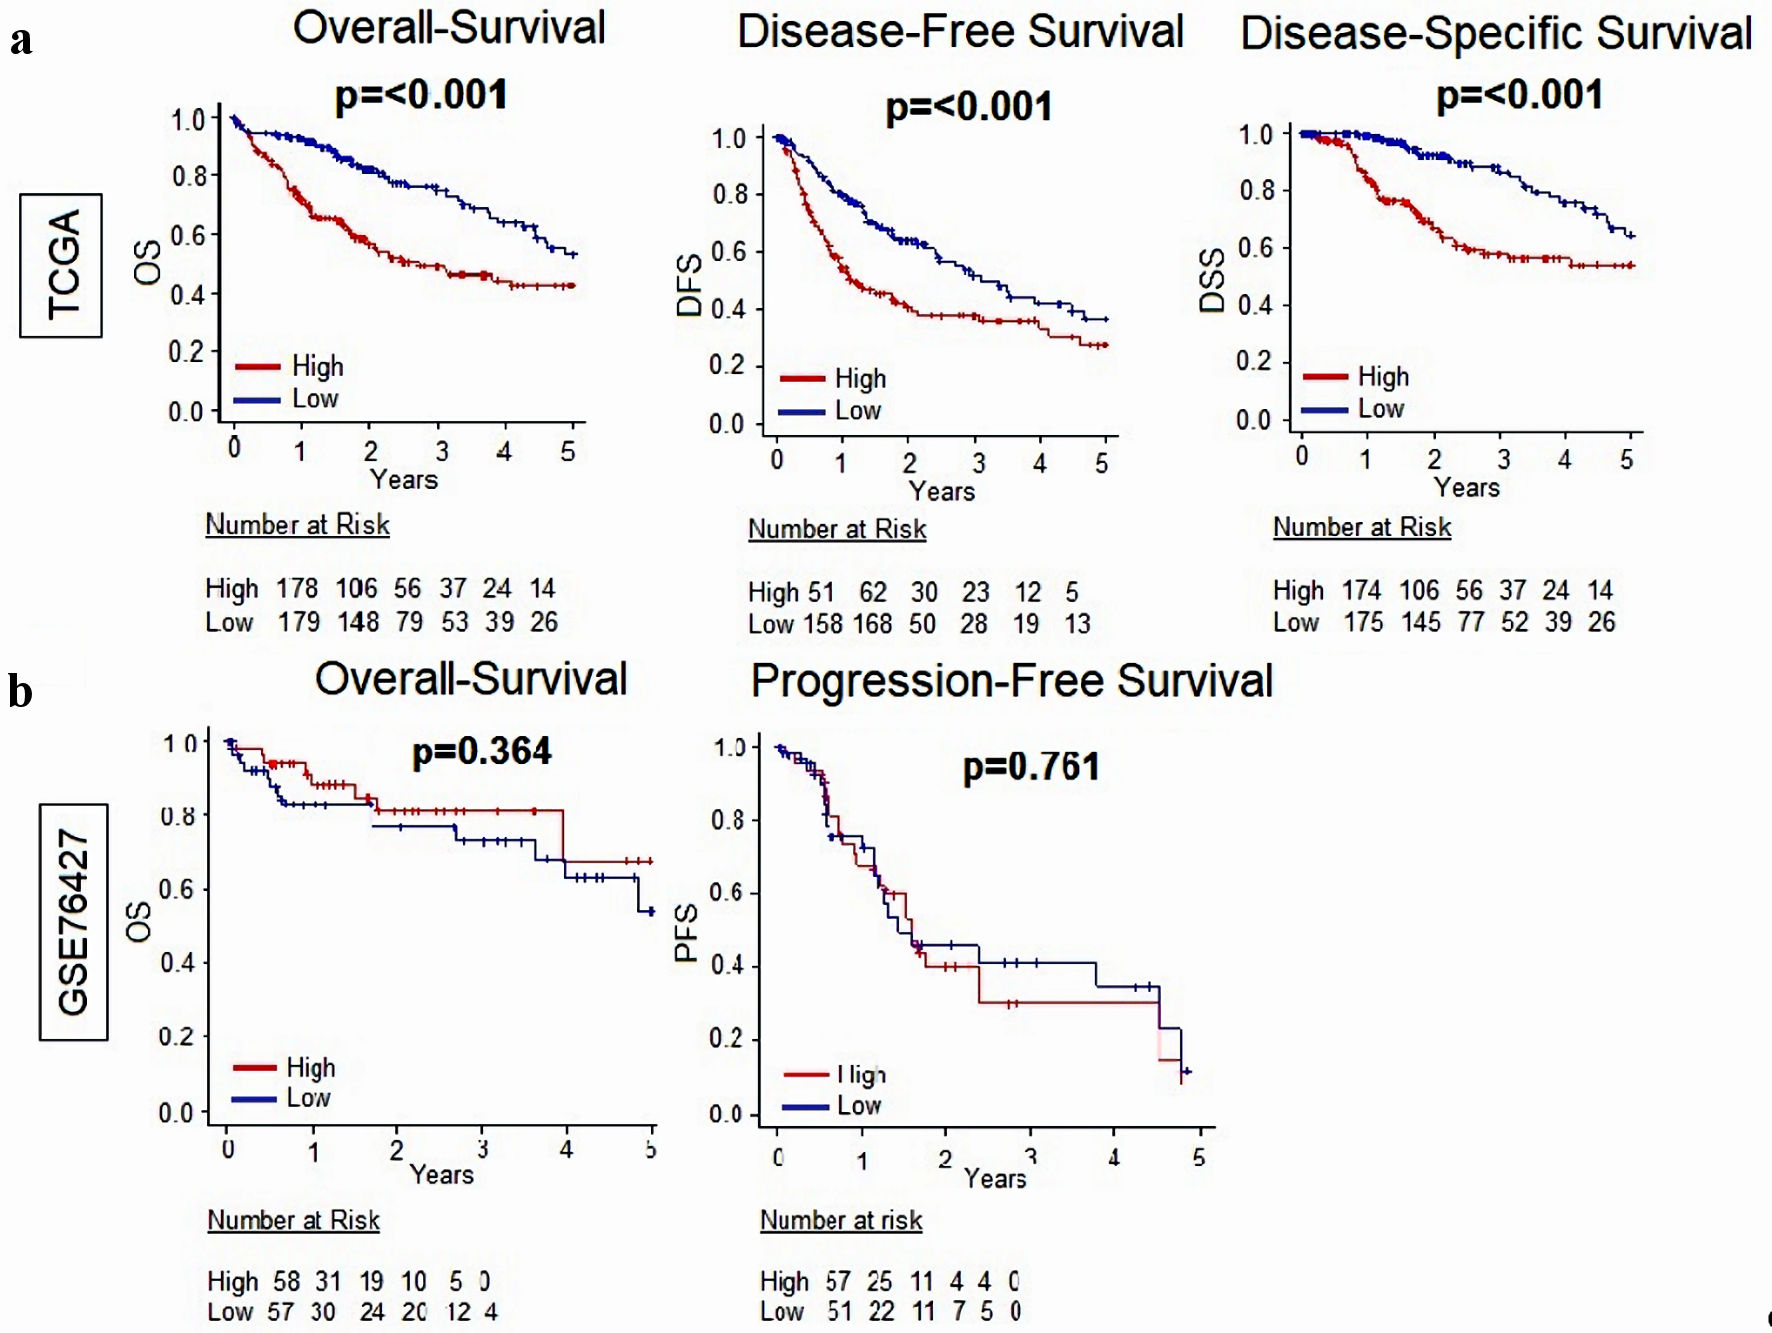
Figure 1. Relationship between MKi67 and survival outcomes in patients with HCC. (a) Kaplan-Meier survival curves comparing high- vs. low-MKi67 expression in HCC to determine disease-free survival (DFS), disease-specific survival (DSS), and overall survival (OS) in the TCGA (n = 358) cohort. (b) Kaplan-Meier survival curves comparing high- vs. low-MKi67 expression in HCC to determine overall survival and progression-free survival in the GSE76427 (n = 115) cohort. The P value was calculated using a log rank test. Significant P value < 0.05. HCC: hepatocellular carcinoma; TCGA: The Cancer Genome Atlas.
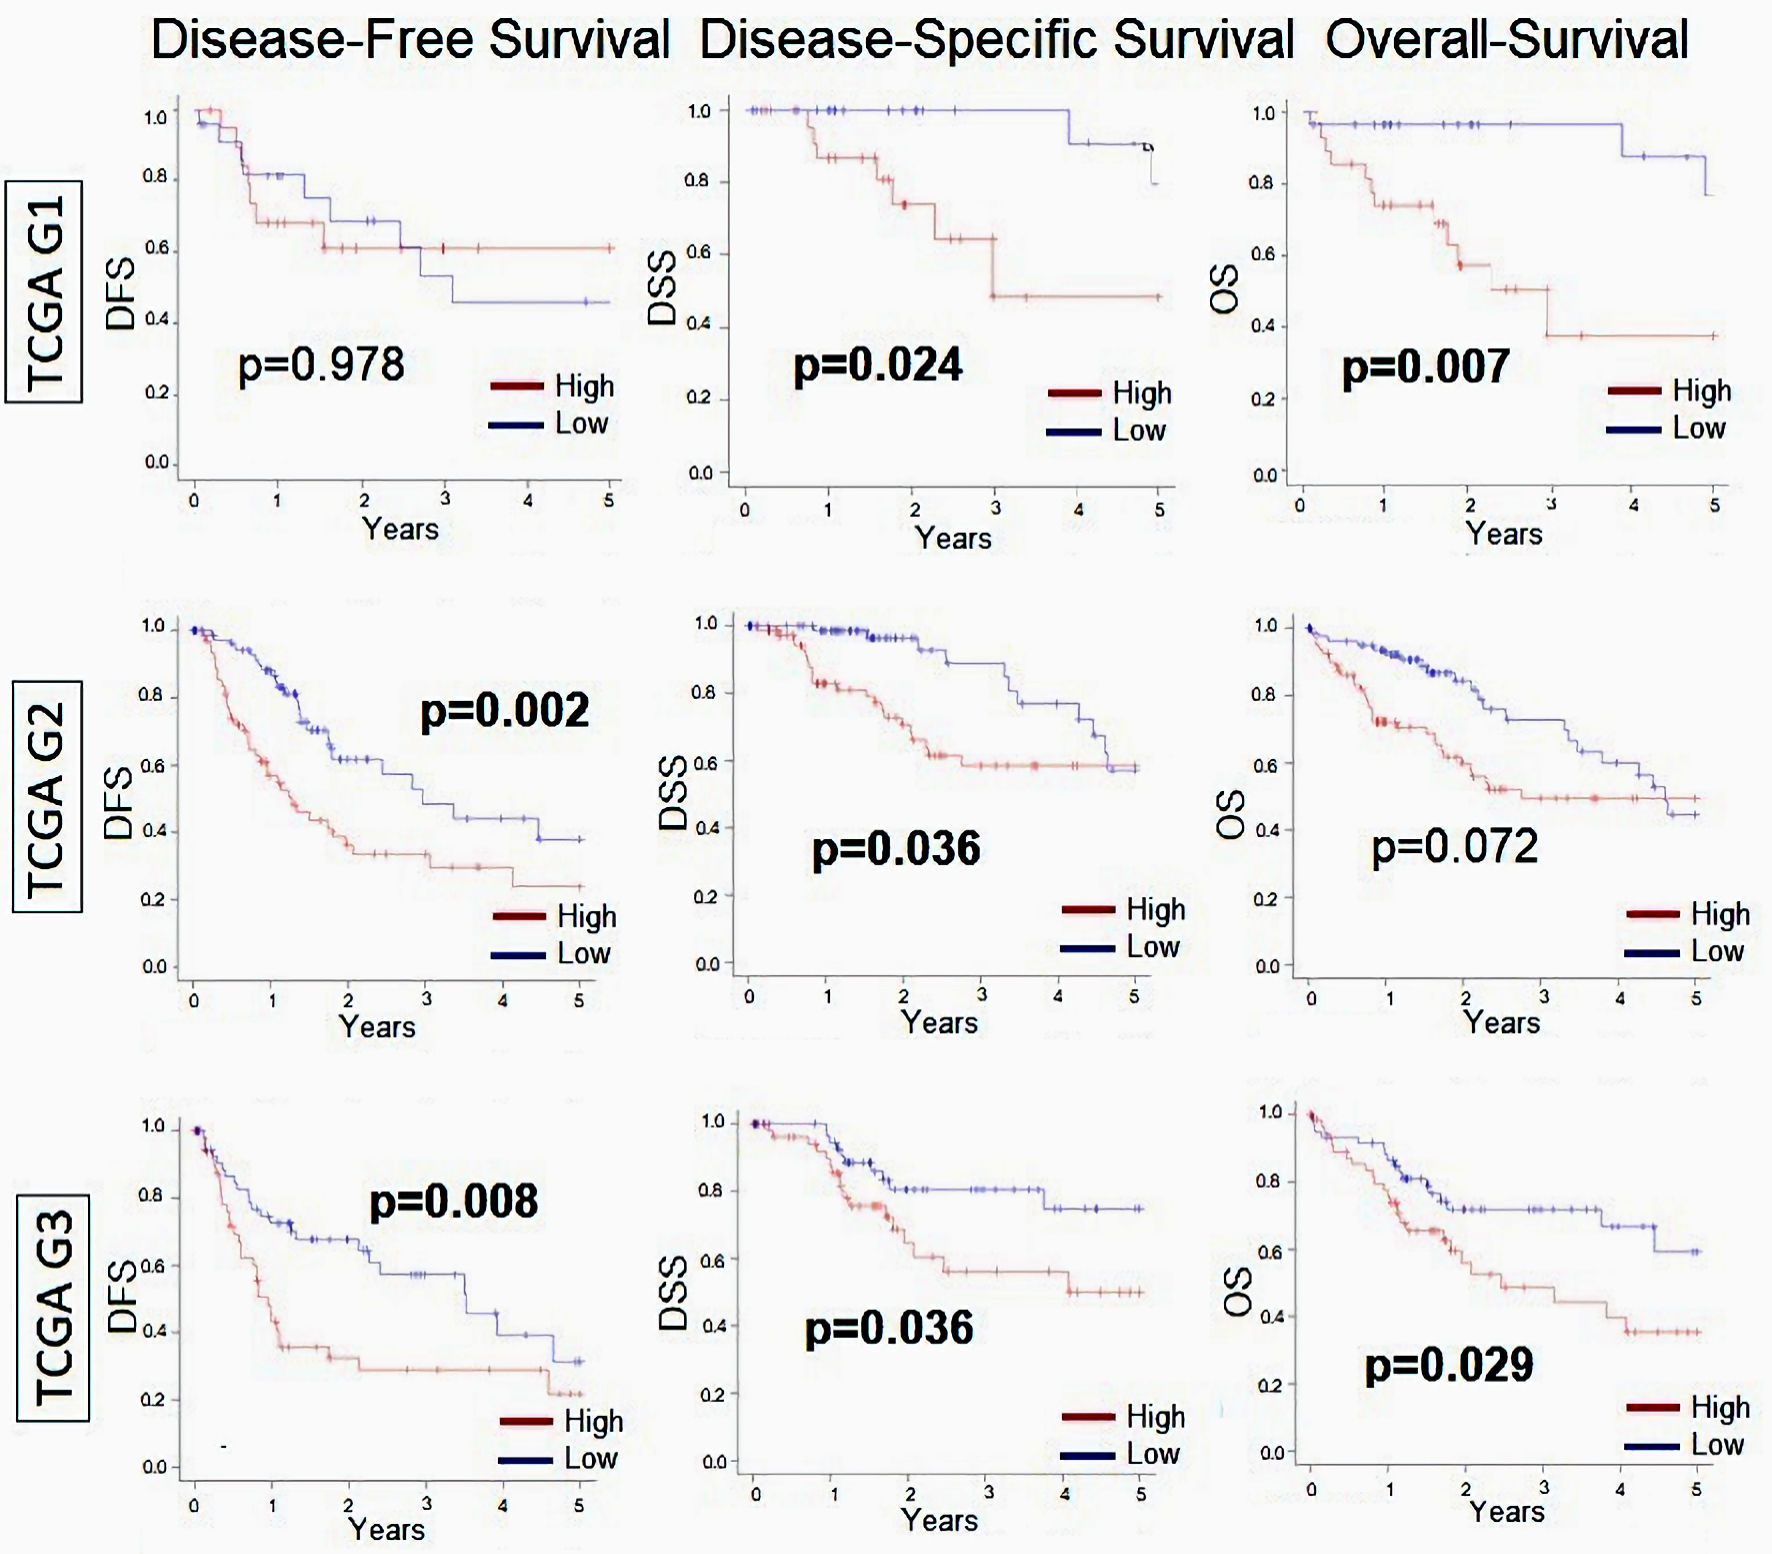
Figure 2. Relationship between MKi67 and survival outcomes in patients with HCC broken down by histological grade. Kaplan-Meier survival curves comparing high- vs. low-MKi67 expression in HCC to determine disease-free survival (DFS), disease-specific survival (DSS), and overall survival (OS) in grade 1 (n = 53), grade 2 (n = 168), and grade 3 (n = 121) from TCGA cohort. The P value was calculated using a log rank test. Significant P value < 0.05. HCC: hepatocellular carcinoma; TCGA: The Cancer Genome Atlas.
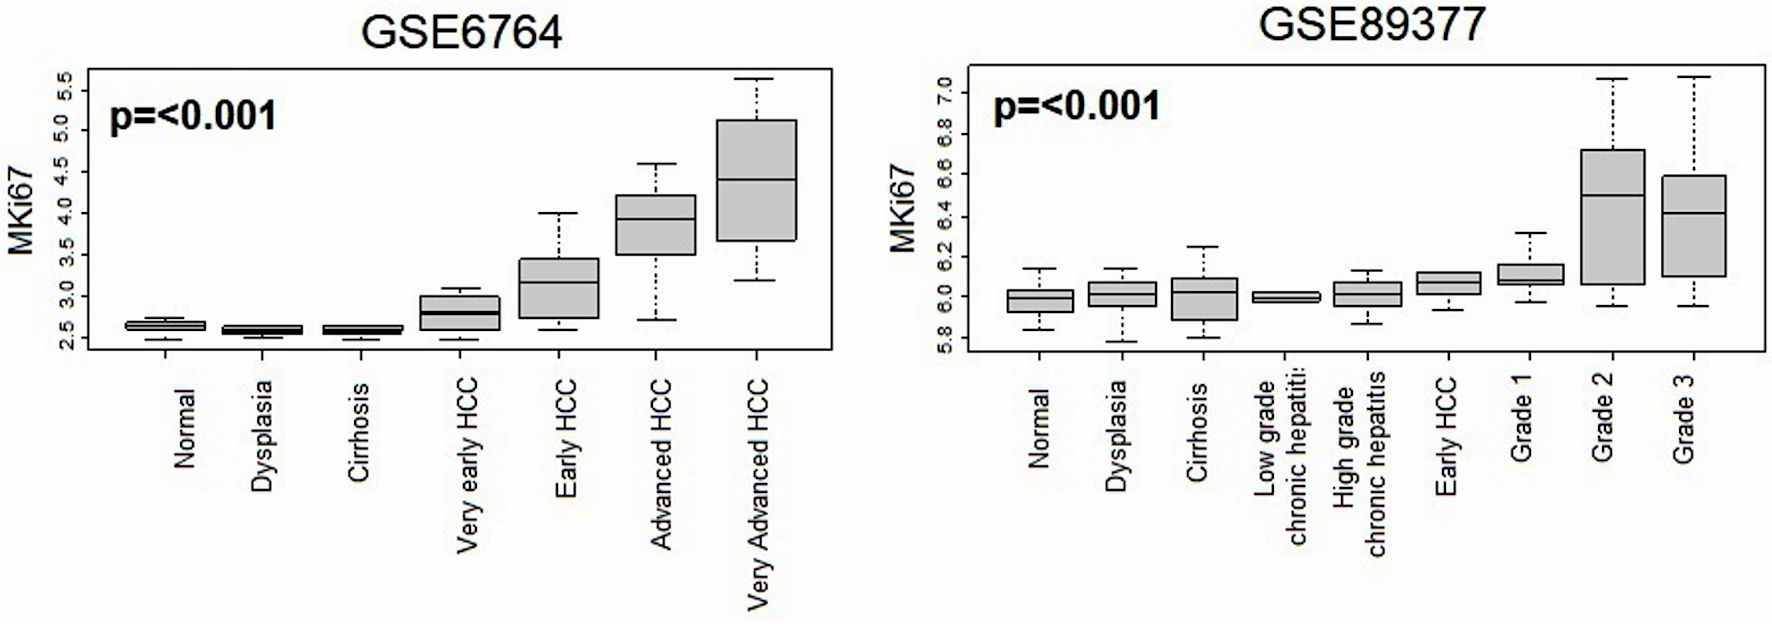
Figure 3. Relationship between MKi67 expression and histological progression of HCC. Boxplots of the MKi67 expression by multistep hepatocarcinogenesis, including normal liver tissue (n = 10), dysplasia (n = 17), cirrhosis (n = 13), very early HCC (n = 8), early HCC (n = 10), advanced HCC (n = 7), and very advanced HCC (n = 10) in the GSE6764 (n = 75), The P value was calculated using a Kruskal-Wallis test. HCC: hepatocellular carcinoma.
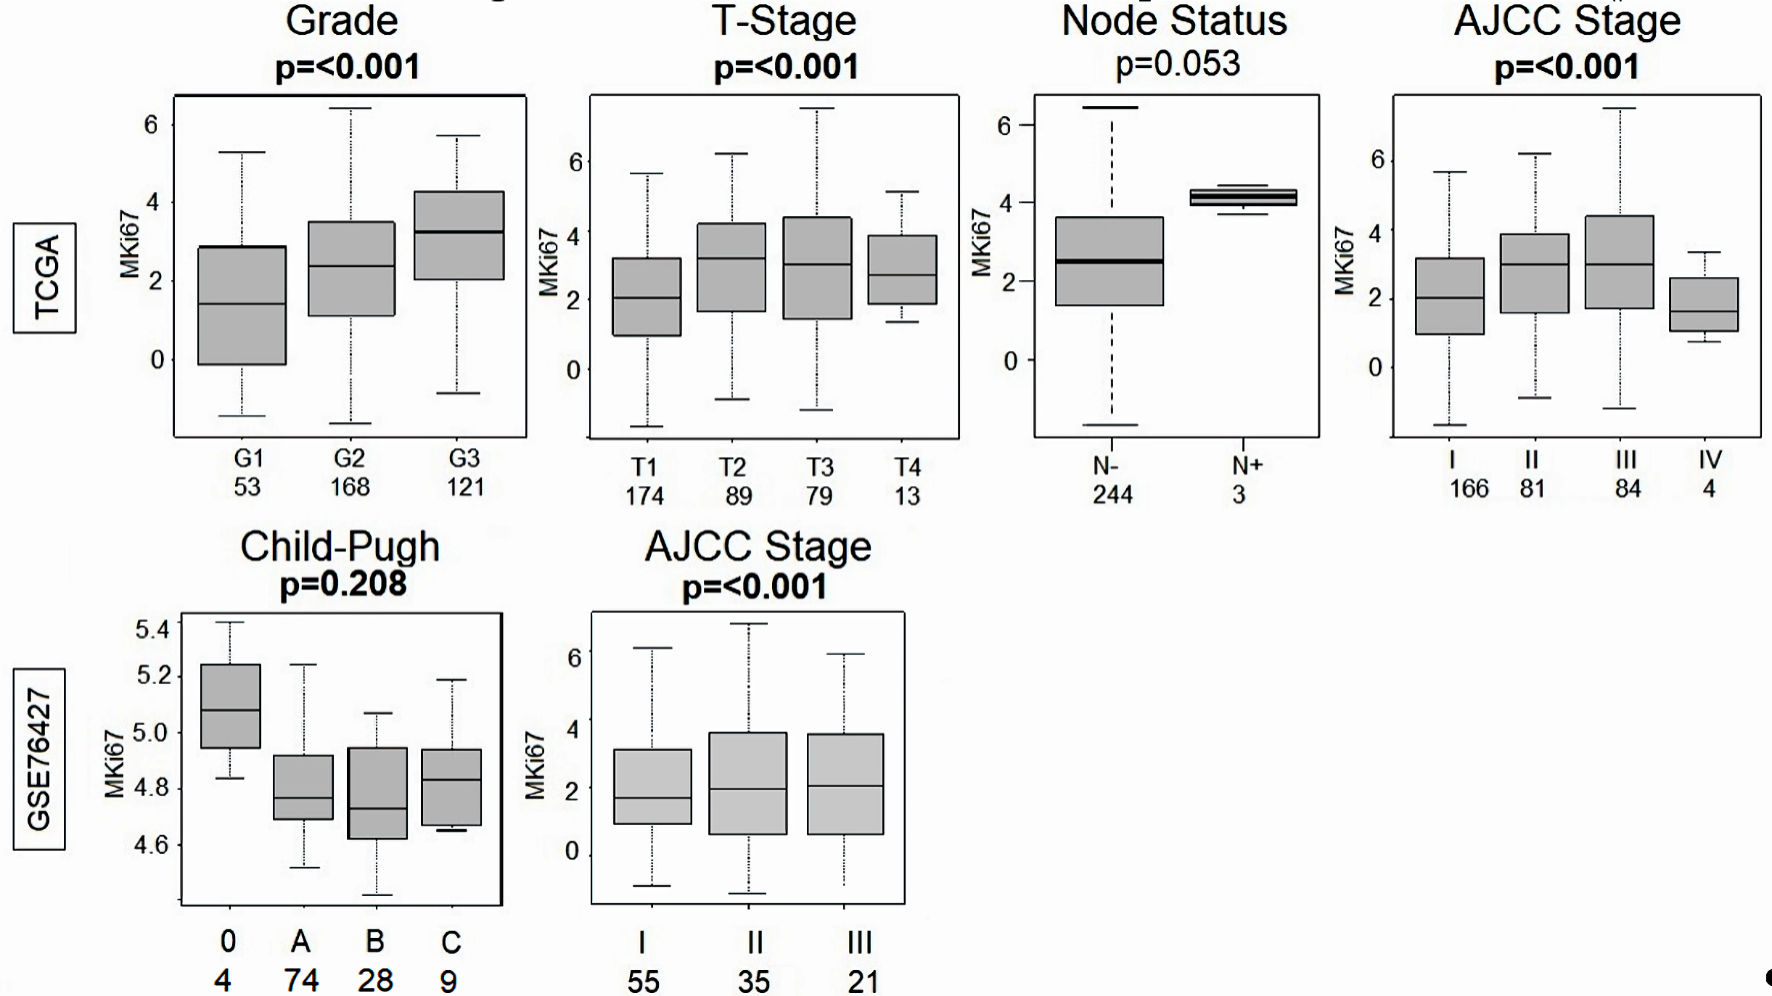
Figure 4. Comparison of the MKi67 expression and grade, T-stage, node status and AJCC stage in the TCGA (n = 358) cohort and MKi67 expression and Child-Pugh classification and AJCC stage in the GSE76427 (n = 115) cohort. P value < 0.05 was considered statistically significant. TCGA: The Cancer Genome Atlas; AJCC: American Joint Committee on Cancer.
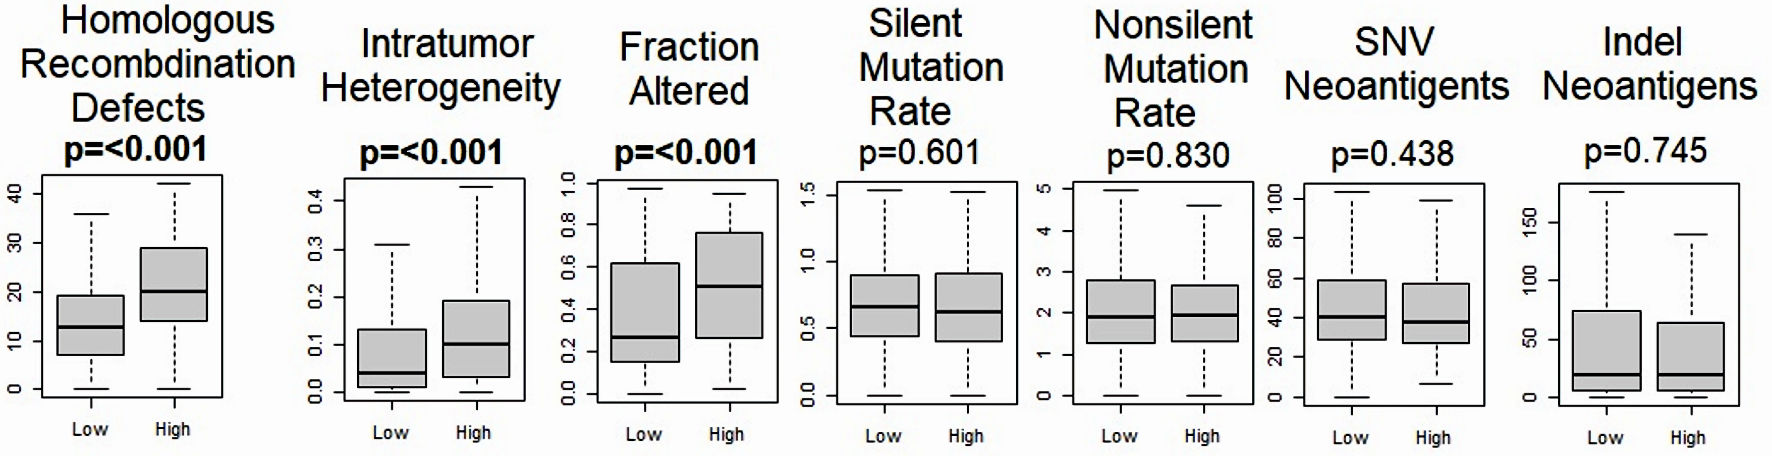
Figure 5. Relationship between MKi67 and mutation related scores. Boxplots of the comparison of the high- vs. low-MKi67 expression and homologous recombination deficiency, intratumor heterogeneity, fraction altered, Silent and non-silent mutation rates, single-nucleotide variant (SNV) neoantigens, and indel neoantigens. The P value was calculated using the Mann-Whitney U test. Significant P value < 0.05.
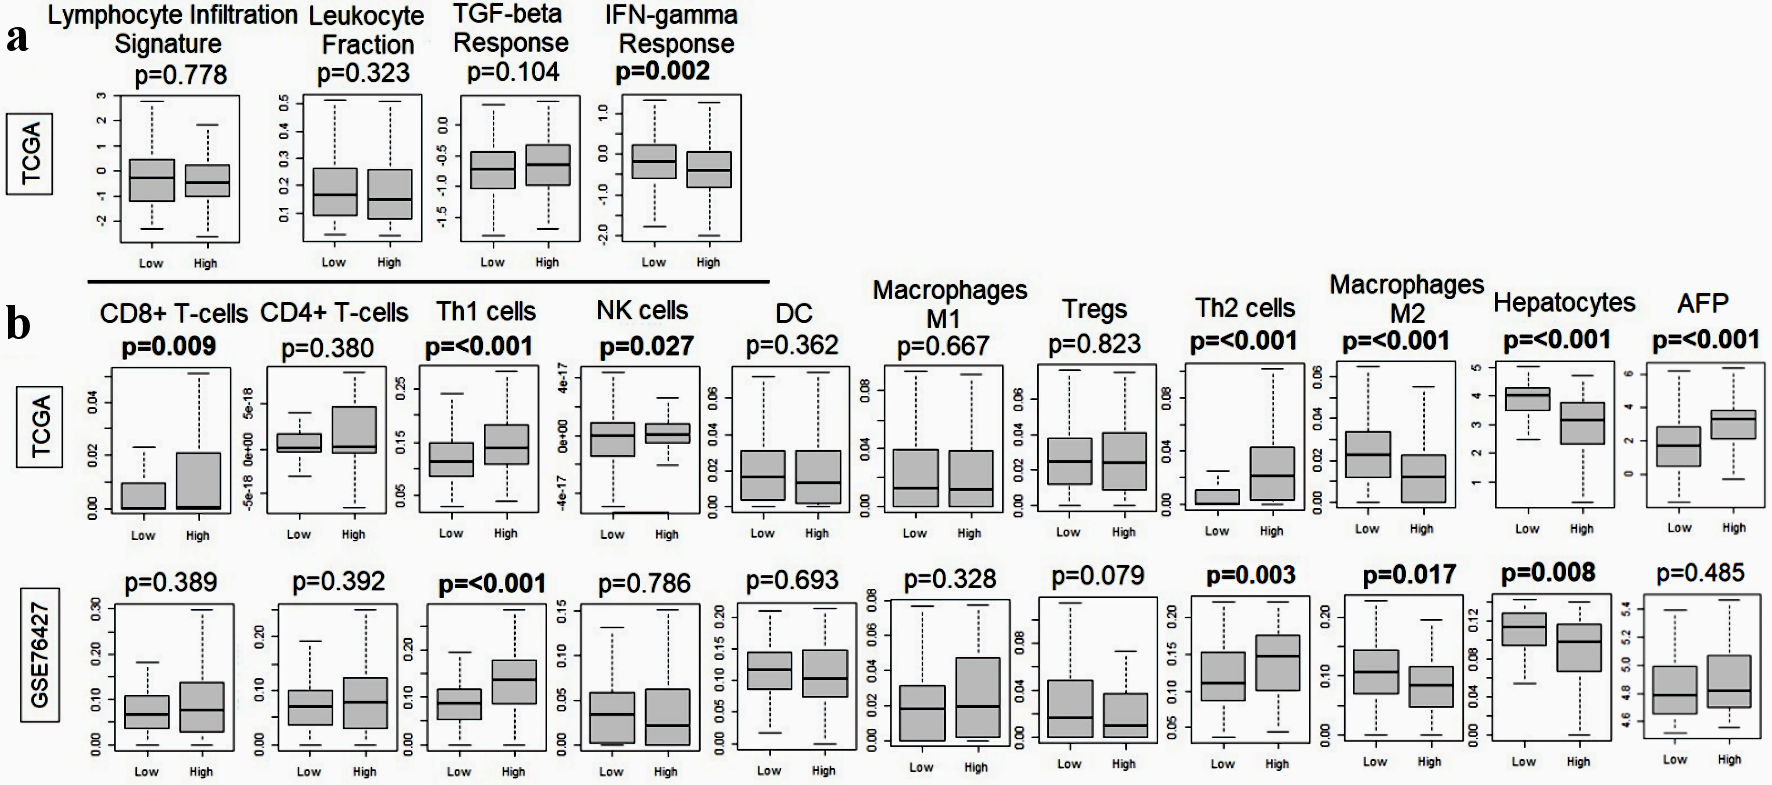
Figure 6. Relationship between MKi67 and immune response-related genes in the TCGA and GSE76427. (a) Boxplots of lymphocyte infiltration signature, leukocyte fraction, TGF-beta response, and IFN-gamma response. (b) Boxplots of anticancer immune cells: CD8+ T cell, CD4+ T cell, T helper type 1 (Th1) cells, M1 macrophages and dendritic cells and pro-cancer immune cells including regulatory T cells (Treg), T helper type 2 (Th2) cells, M2 macrophages, hepatocytes and alpha-fetoprotein (AFP). The P value was calculated using the Mann-Whitney U test. Significant P value < 0.05. TGF: transforming growth factor; IFN: interferon; TCGA: The Cancer Genome Atlas; NK: natural killer; DC: dendritic cell.
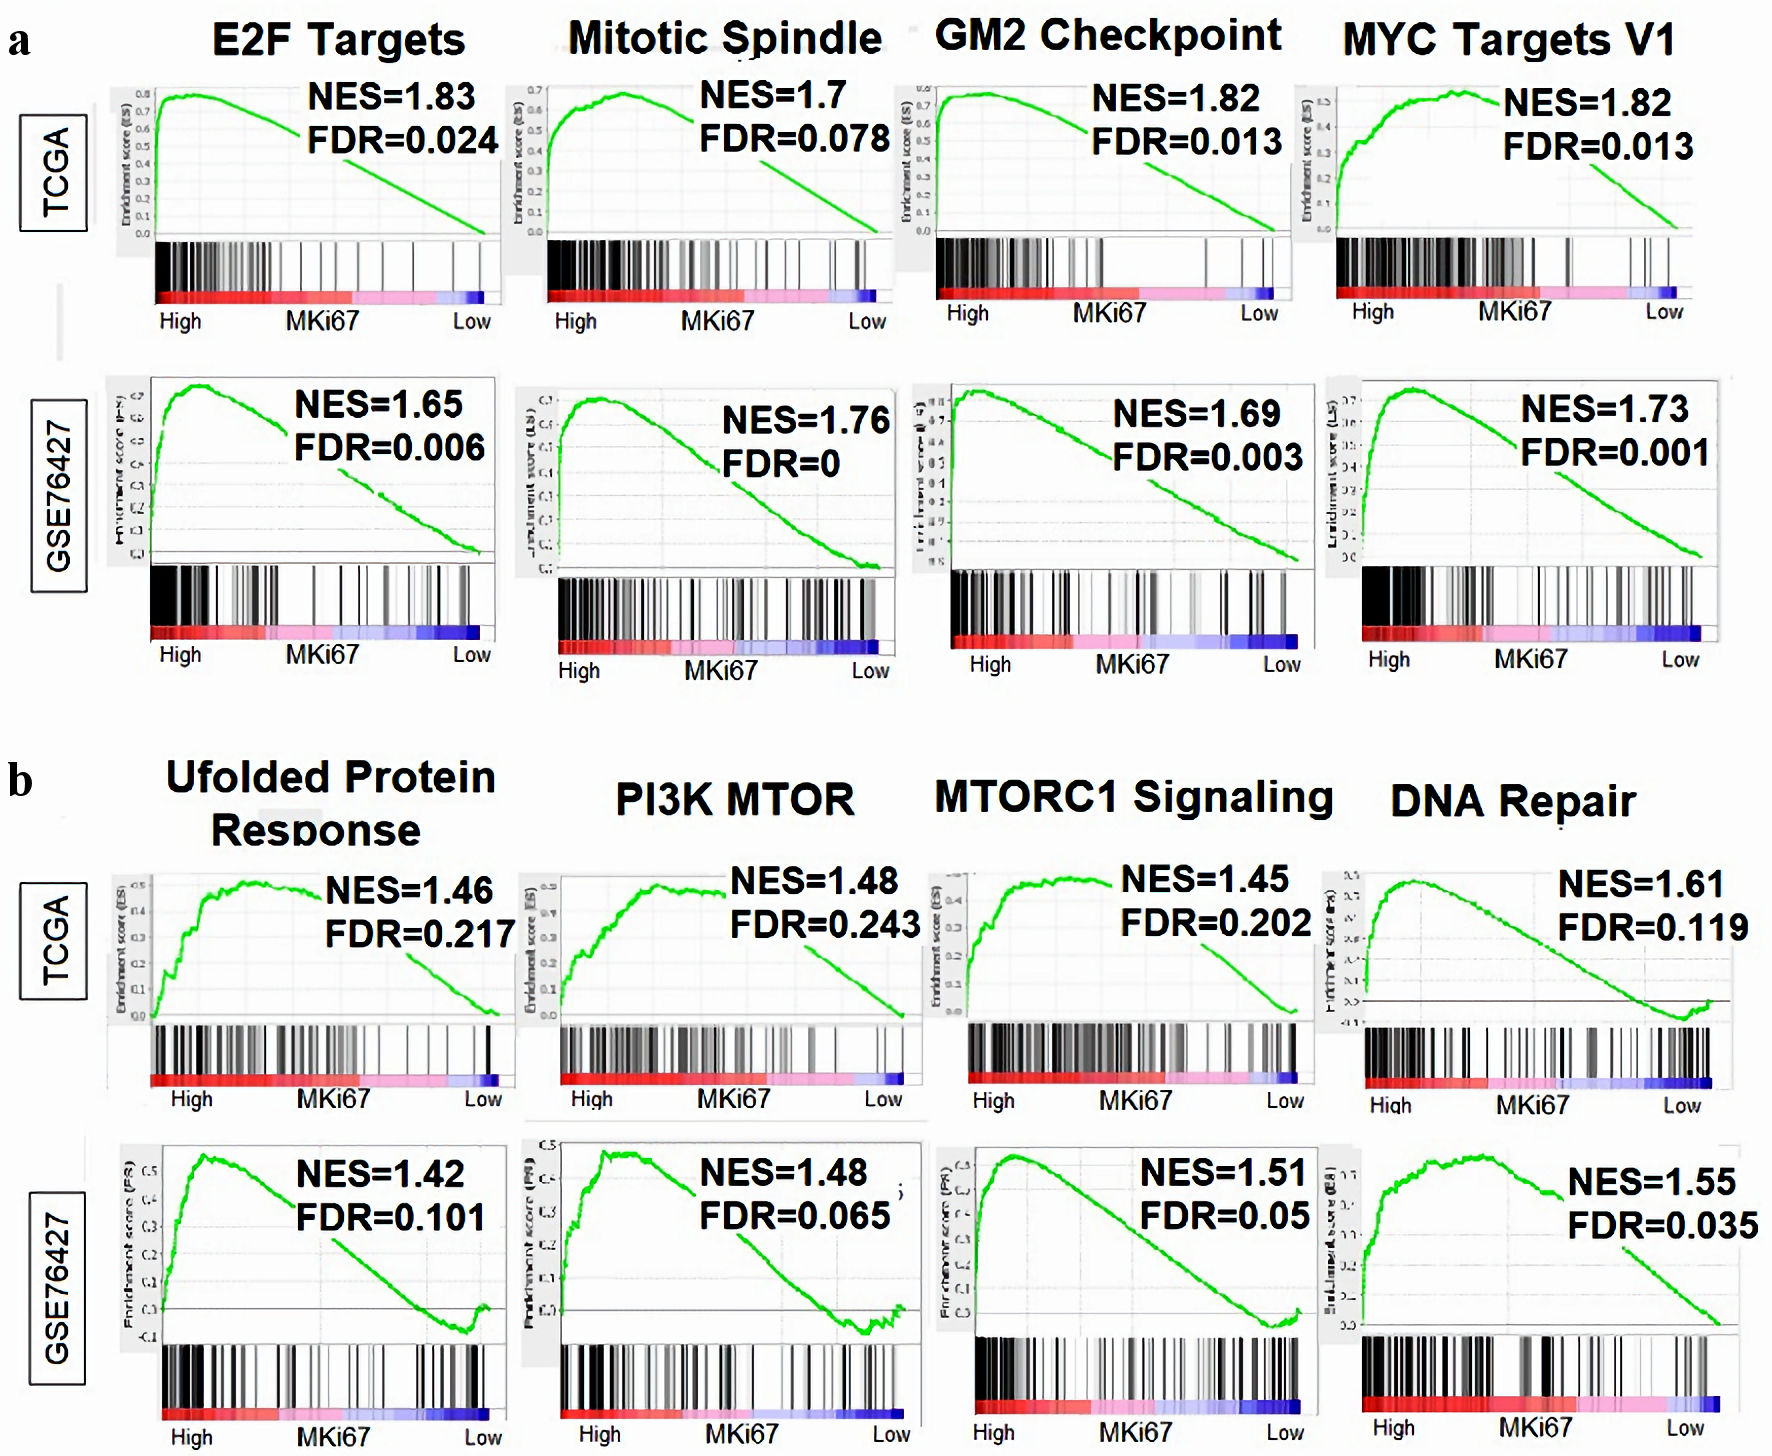
Figure 7. Relationship between MKi67 expression and cell proliferation-related gene sets. Gene Set Enrichment Analysis (GSEA) was performed on the Hallmark gene sets, comparing MKi67-high vs. low scores in HCC across the TCGA and GSE76427 cohorts Enrichment plots was generated displaying the normalized enrichment score (NES) and false discovery rate (FDR) for proliferation-related gene sets. An FDR of 0.25 was determined statistically significant as recommended by the GSEA software. (a) Cell proliferation-related gene sets in the Hallmark collection. (b) Genes related to aggressive tumor biology. HCC: hepatocellular carcinoma; TCGA: The Cancer Genome Atlas.