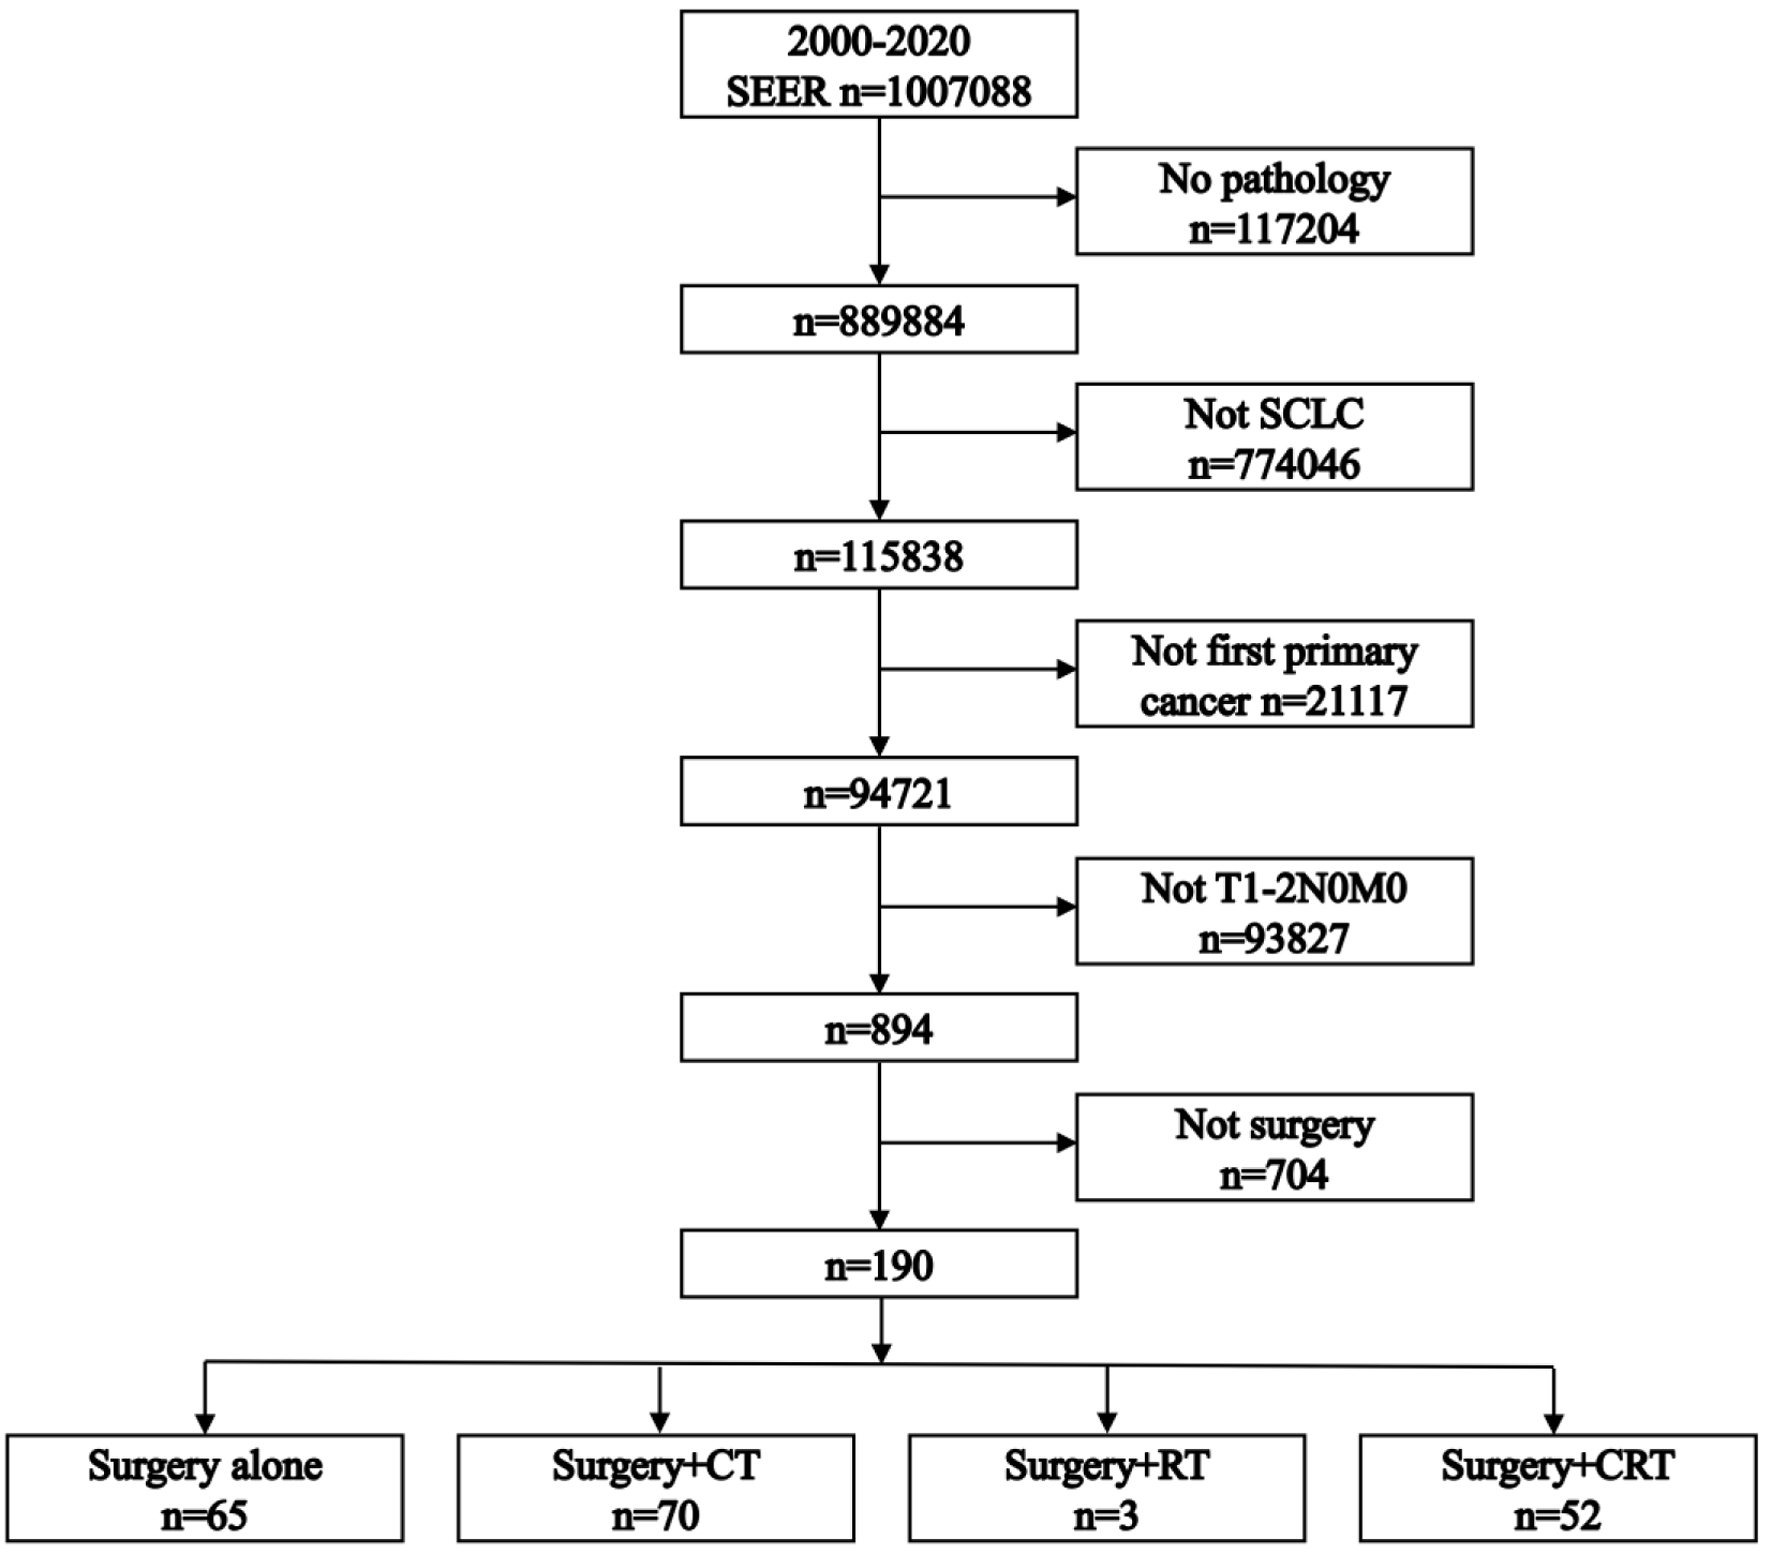
Figure 1. Flowchart illustrating the patient selection process. CRT: chemoradiotherapy; CT: chemotherapy; RT: radiotherapy; SCLC: small cell lung cancer.
| World Journal of Oncology, ISSN 1920-4531 print, 1920-454X online, Open Access |
| Article copyright, the authors; Journal compilation copyright, World J Oncol and Elmer Press Inc |
| Journal website https://www.wjon.org |
Original Article
Volume 15, Number 1, February 2024, pages 126-135
Treatment Patterns and Survival Outcomes in Patients With Stage T1-2N0M0 Small Cell Lung Cancer Undergoing Surgery: A Retrospective Cohort Study
Figures
Tables
| Surgery alone (n = 65) | Surgery + CT (n = 70) | Surgery + CRT (n = 52) | P | |
|---|---|---|---|---|
| CRT: chemoradiotherapy; CT: chemotherapy. | ||||
| Age | 0.532 | |||
| < 67 | 36 (55.4%) | 32 (45.7%) | 26 (50.0%) | |
| ≥ 67 | 29 (44.6%) | 38 (54.3%) | 26 (50.0%) | |
| Sex | 0.673 | |||
| Female | 41 (63.1%) | 39 (55.7%) | 30 (57.7%) | |
| Male | 24 (36.9%) | 31 (44.3%) | 22 (42.3%) | |
| Race | 0.423 | |||
| White | 61 (93.8%) | 68 (97.1%) | 49 (94.2%) | |
| Black | 3 (4.7%) | 0 (0.0%) | 2 (3.9%) | |
| Others | 1 (1.5%) | 2 (2.9%) | 1 (1.9%) | |
| Site | 0.575 | |||
| Upper lobe | 45 (69.2%) | 44 (62.9%) | 28 (53.8%) | |
| Middle lobe | 4 (6.2%) | 5 (7.1%) | 3 (5.8%) | |
| Lower lobe | 15 (23.1%) | 20 (28.6%) | 18 (34.6%) | |
| Others | 1 (1.5%) | 1 (1.4%) | 3 (5.8%) | |
| Laterality | 0.516 | |||
| Left | 30 (46.2%) | 29 (41.4%) | 27 (51.9%) | |
| Right | 35 (53.8%) | 41 (58.6%) | 25 (48.1%) | |
| Grade | 0.124 | |||
| III/IV | 45 (69.2%) | 37 (52.9%) | 34 (65.4%) | |
| I/II/unknown | 20 (30.8%) | 33 (47.1%) | 18 (34.6%) | |
| T stage | 0.363 | |||
| T1N0M0 | 38 (58.5%) | 48 (68.6%) | 36 (69.2%) | |
| T2N0M0 | 27 (41.5%) | 22 (31.4%) | 16 (30.8%) | |
| Cancer-specific survival | Overall survival | |||||
|---|---|---|---|---|---|---|
| HR | 95% CI | P | HR | 95% CI | P | |
| CI: confidence interval; CRT: chemoradiotherapy; CT: chemotherapy; HR: hazard ratio. | ||||||
| Age | ||||||
| < 67 | Reference | Reference | ||||
| ≥ 67 | 1.82 | 1.13 - 2.93 | 0.014 | 1.74 | 1.19 - 2.55 | 0.004 |
| Sex | ||||||
| Female | Reference | Reference | ||||
| Male | 1.13 | 0.71 - 1.82 | 0.600 | 1.15 | 0.79 - 1.69 | 0.455 |
| Race | ||||||
| White | Reference | Reference | ||||
| Black | 2.41 | 0.76 - 7.69 | 0.137 | 1.48 | 0.47 - 4.67 | 0.506 |
| Others | 1.52 | 0.37 - 6.22 | 0.559 | 1.55 | 0.49 - 4.89 | 0.458 |
| Site | ||||||
| Upper lobe | Reference | Reference | ||||
| Middle lobe | 0.78 | 0.31 - 1.98 | 0.604 | 0.45 | 0.18 - 1.12 | 0.085 |
| Lower lobe | 0.80 | 0.47 - 1.38 | 0.427 | 0.69 | 0.45 - 1.07 | 0.100 |
| Others | 1.56 | 0.48 - 5.01 | 0.459 | 0.91 | 0.29 - 2.88 | 0.870 |
| Laterality | ||||||
| Left | Reference | Reference | ||||
| Right | 0.67 | 0.42 - 1.07 | 0.093 | 0.68 | 0.47 - 0.99 | 0.047 |
| Grade | ||||||
| III/IV | Reference | Reference | ||||
| I/II/unknown | 0.91 | 0.56 - 1.47 | 0.698 | 0.85 | 0.58 - 1.25 | 0.413 |
| T stage | ||||||
| T1N0M0 | Reference | Reference | ||||
| T2N0M0 | 1.20 | 0.74 - 1.94 | 0.450 | 1.10 | 0.74 - 1.62 | 0.641 |
| Treatment | ||||||
| Surgery alone | Reference | Reference | ||||
| Surgery + CT | 0.87 | 0.50 - 1.51 | 0.612 | 0.62 | 0.40 - 0.97 | 0.036 |
| Surgery + CRT | 0.94 | 0.52 - 1.70 | 0.839 | 0.76 | 0.48 - 1.21 | 0.253 |