Figures
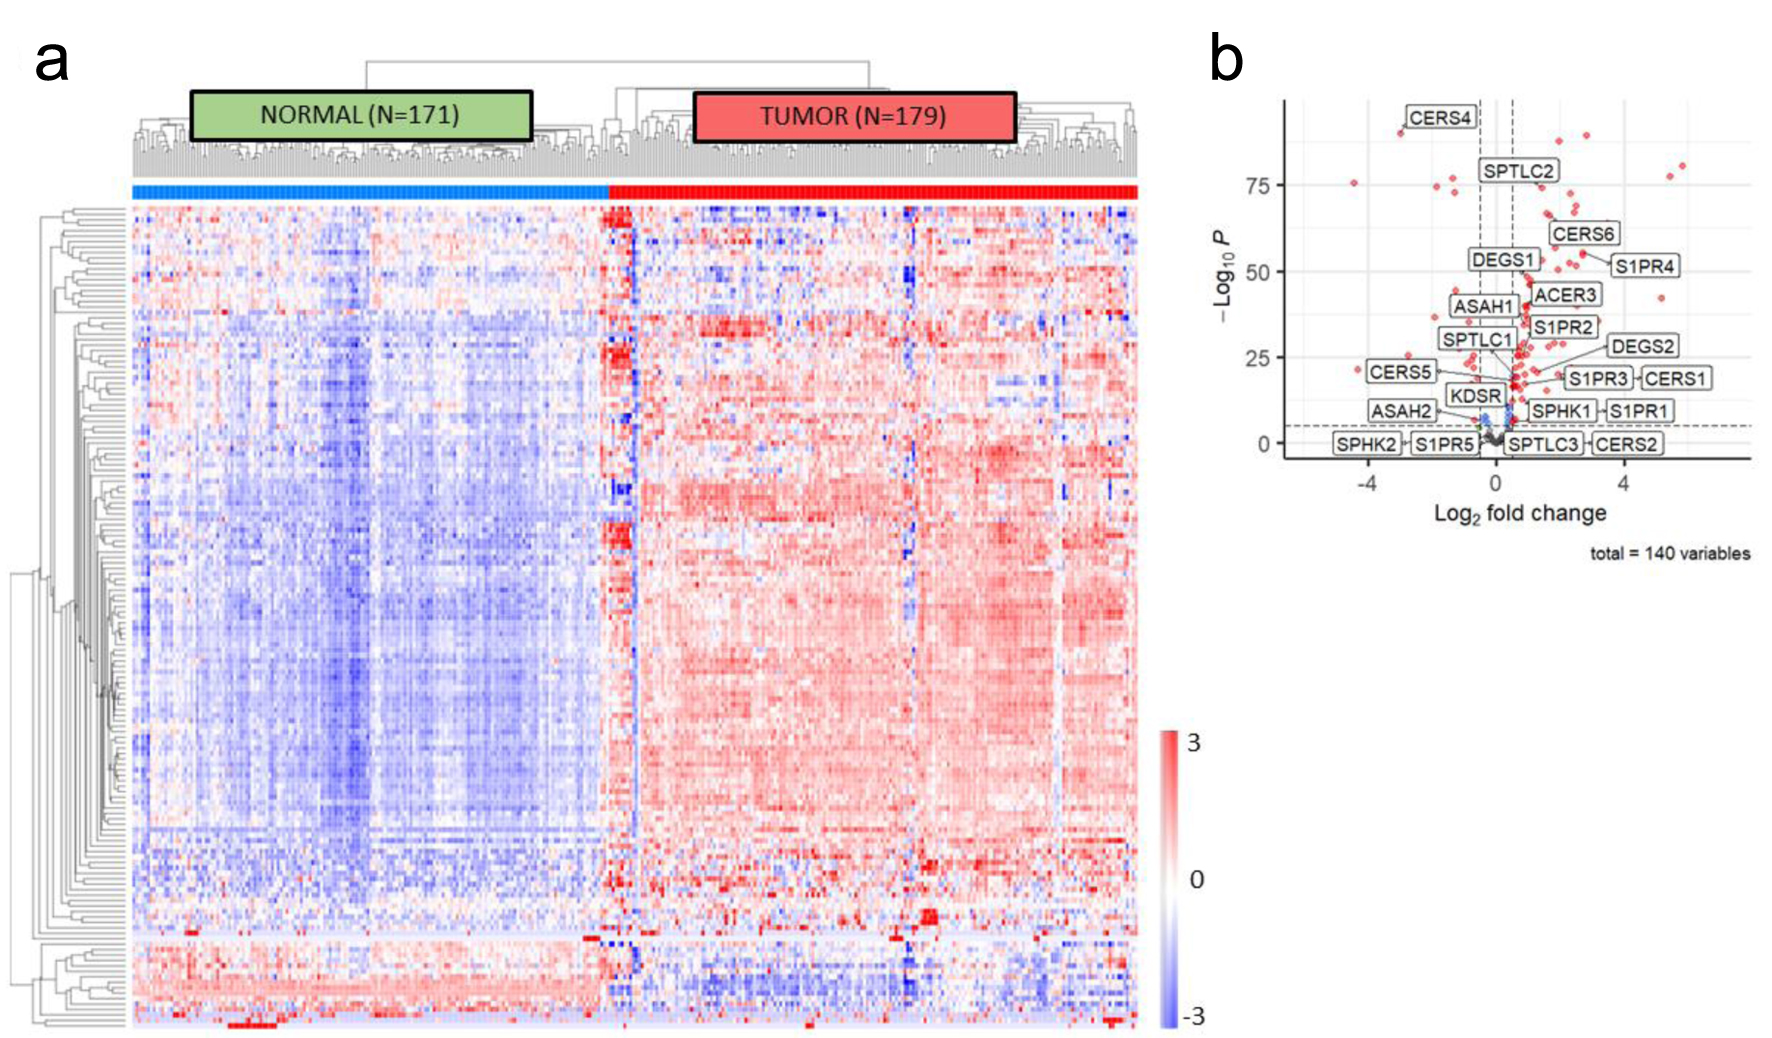
Figure 1. In silico sphingolipid profiling in PDAC. (a) Unsupervised clustering of genes included in the sphingolipid metabolic annotation (GO: 0006665) demonstrates accurate discrimination of normal pancreas tissue from pancreatic tumor tissue using samples from GTEx and TCGA. (b) Volcano plot of differentially expressed genes in the sphingolipid metabolic annotation, with S1P biosynthetic pathway members identified. PDAC: pancreatic ductal adenocarcinoma; S1P: sphingosine-1-phosphate.
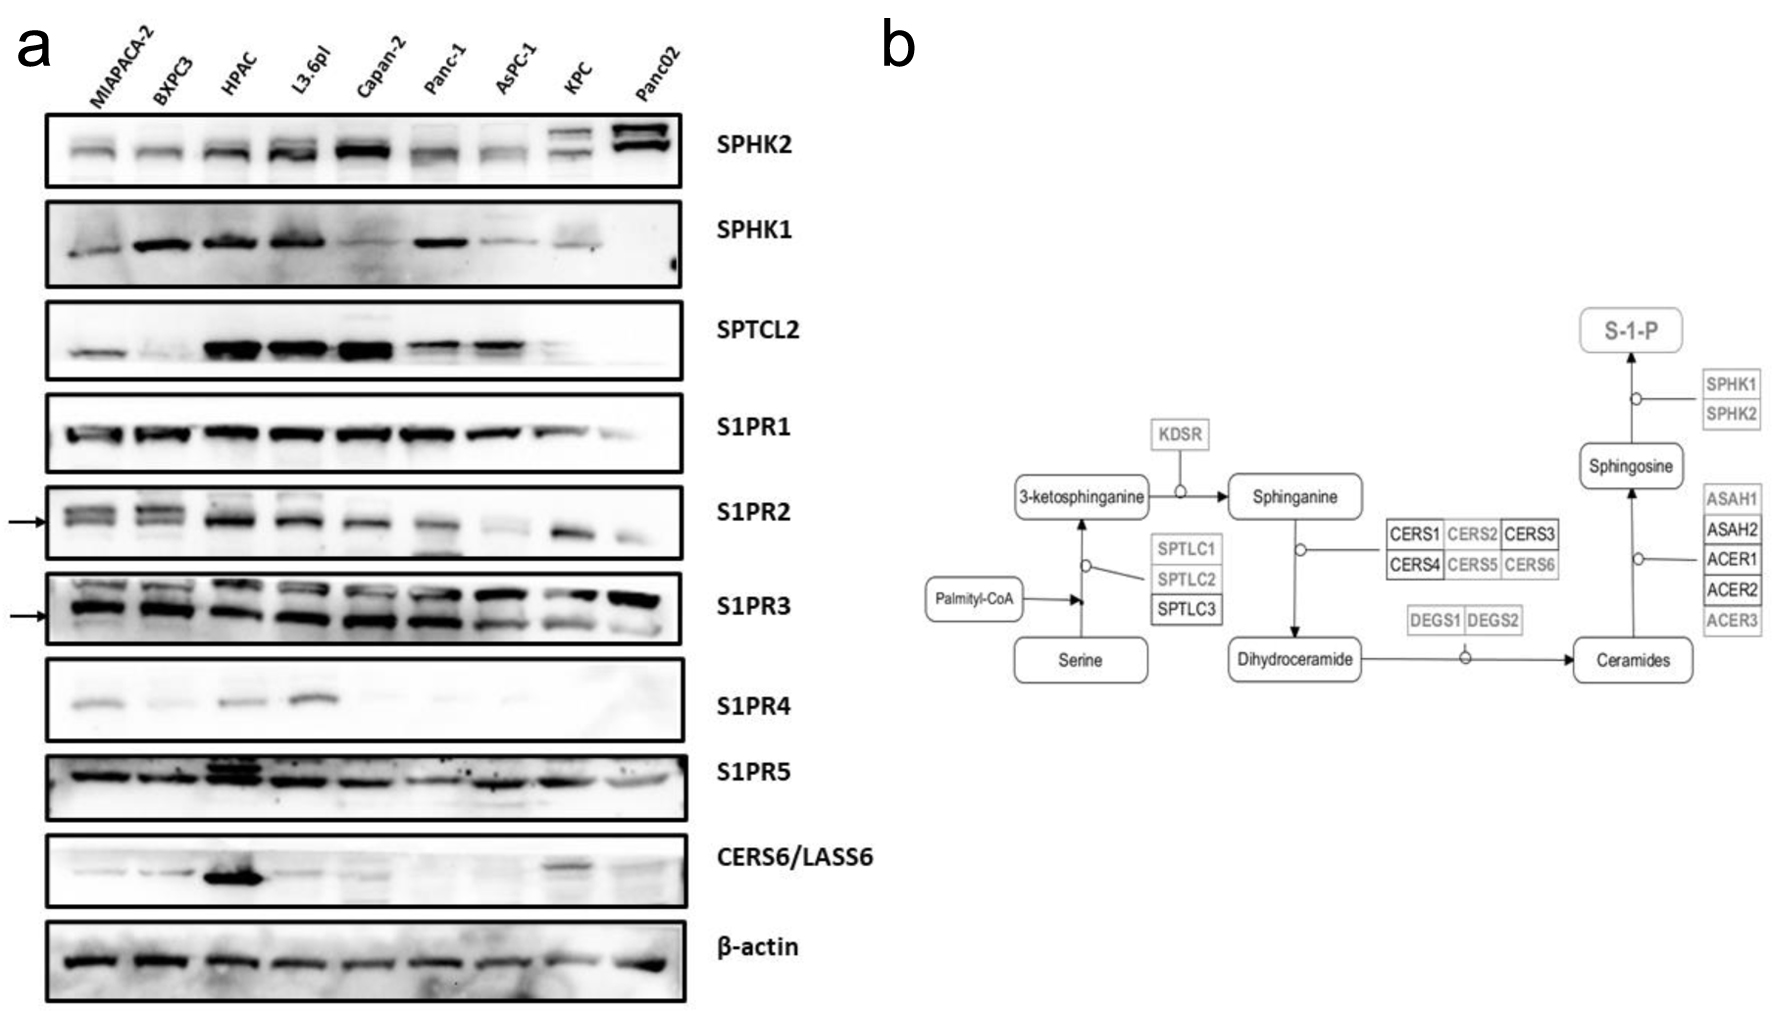
Figure 2. Sphingolipid mediator profiling across human and murine PDAC cell lines. (a) Western blot profiling of upstream and downstream mediators of S1P signaling. (b) Diagram of the biosynthetic pathway of S1P synthesis, with significantly differentially expressed members highlighted. PDAC: pancreatic ductal adenocarcinoma; S1P: sphingosine-1-phosphate.
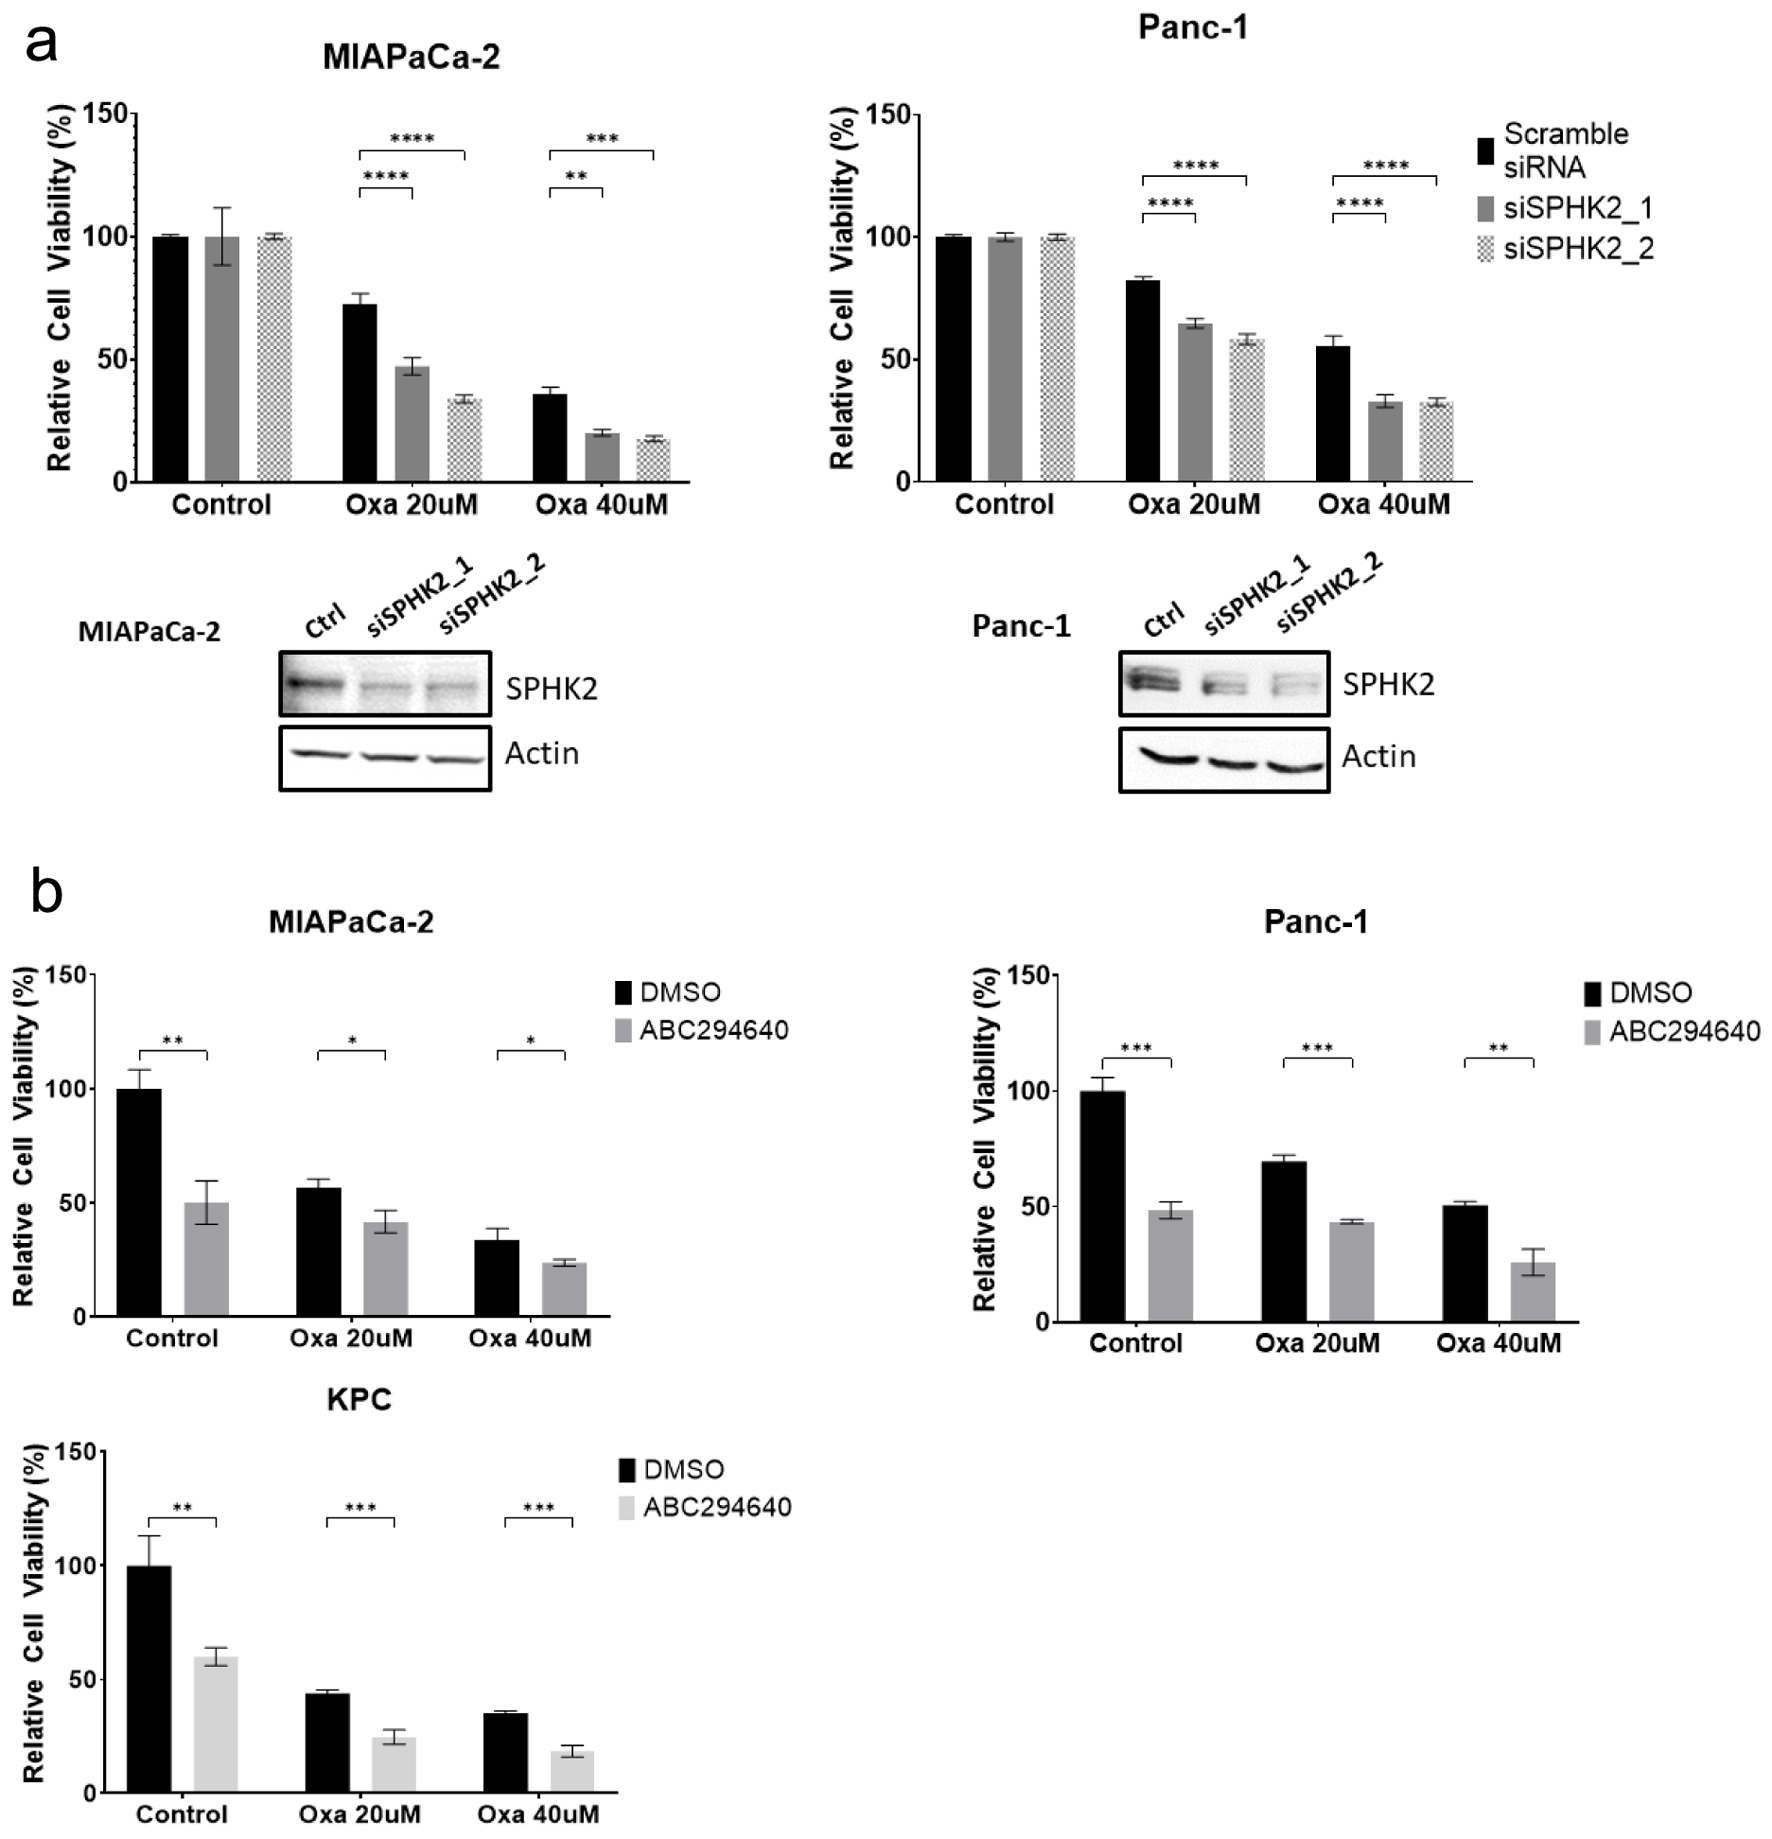
Figure 3. SPHK2 inhibition enhances cytotoxicity of Oxa in PDAC cell lines. (a) After transfection with either siSPHK2 (black bars) or scramble control (gray bars), MiaPaCa-2 and Panc-1 cells were treated with Oxa for 48 h and tested for cell viability based on MTT assay. Western blots confirming effective knockdown of SPHK2 using siRNA clones are displayed below. (b) PDAC cell lines were treated with combination of 20 µM ABC and Oxa for 48 h. Cell viability was assessed by MTT assay. For cell viability assay, data shown represent at least three biological replicates (*P < 0.05, **P < 0.01, ***P < 0.001, ****P < 0.0001). Oxa: oxaliplatin; PDAC: pancreatic ductal adenocarcinoma; S1P: sphingosine-1-phosphate; SPHK2: sphingosine kinase 2.
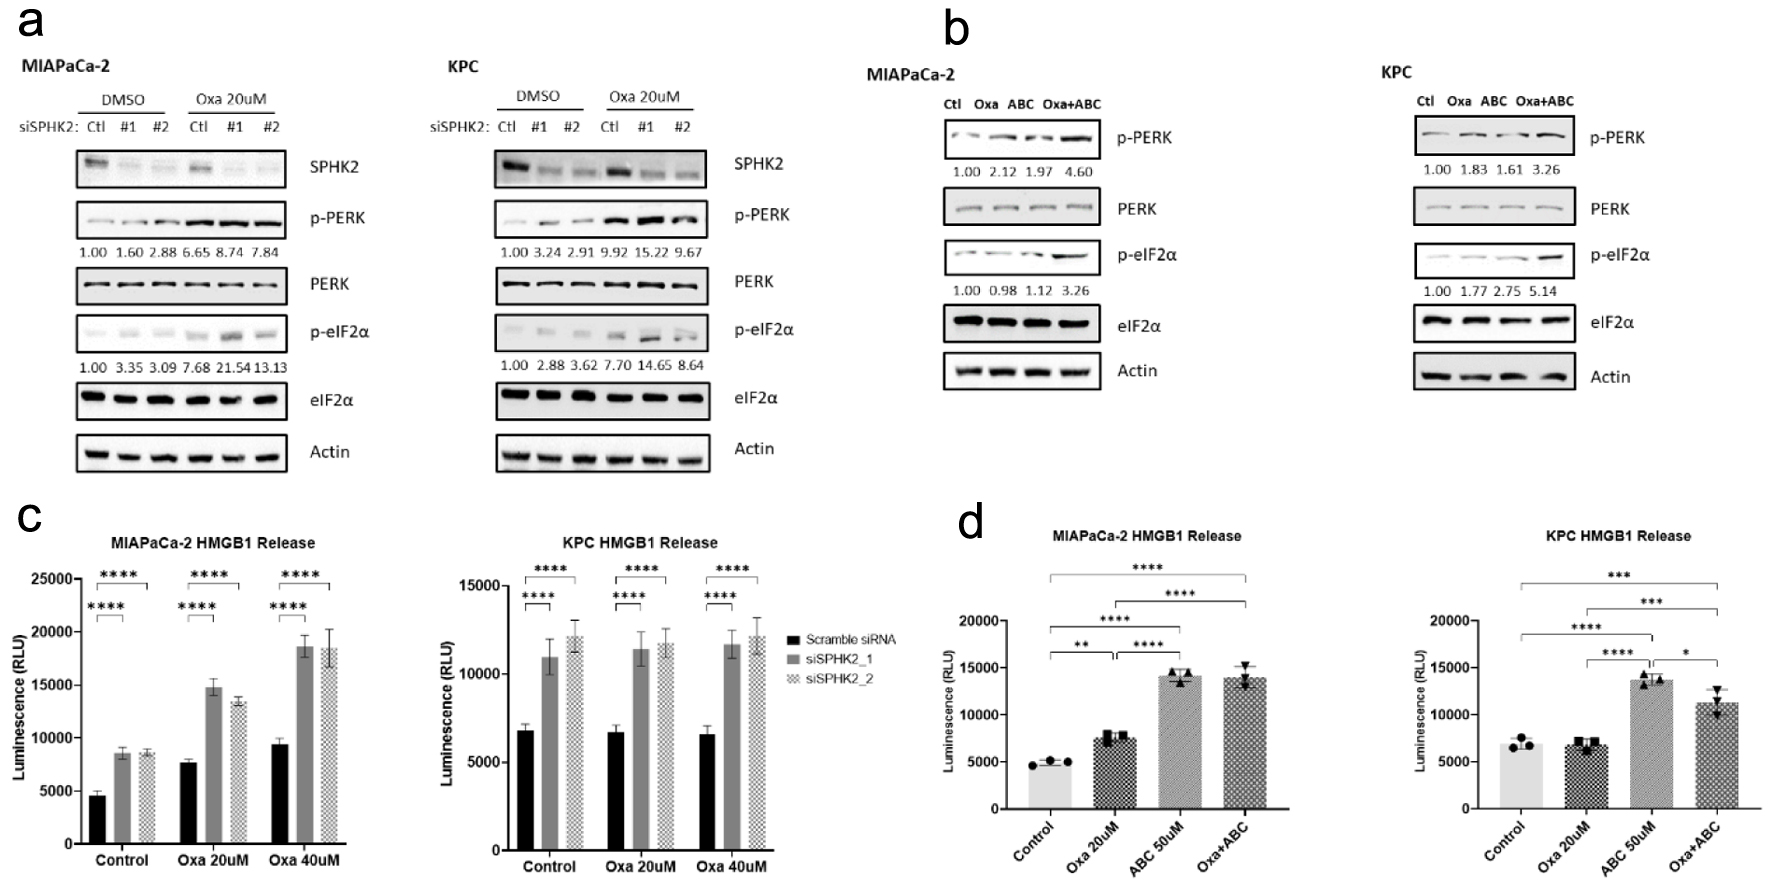
Figure 4. SPHK2 inhibition enhances oxaliplatin-induced ER stress in PDAC cell lines. (a) Loss of SPHK2 increases ER stress through eIF2α and PERK phosphorylation in human and murine cell lines. OD values for p-PERK and p-eIF2α are displayed below the relevant bands. (b) The S1P inhibitor ABC increases ER stress through eIF2α and PERK phosphorylation in human and murine cell lines. OD values for p-PERK and p-eIF2α are displayed below the relevant bands. (c) Loss of SPHK2 and (d) ABC administration increase extracellular HMGB1 release compared to control or Oxa, suggestive of increased ICD induction (*P < 0.05, **P < 0.01, ***P < 0.001, ****P < 0.0001). ABC: ABC294640; ER: endoplasmic reticulum; OD: optical density; Oxa: oxaliplatin; PDAC: pancreatic ductal adenocarcinoma; S1P: sphingosine-1-phosphate; SPHK2: sphingosine kinase 2.
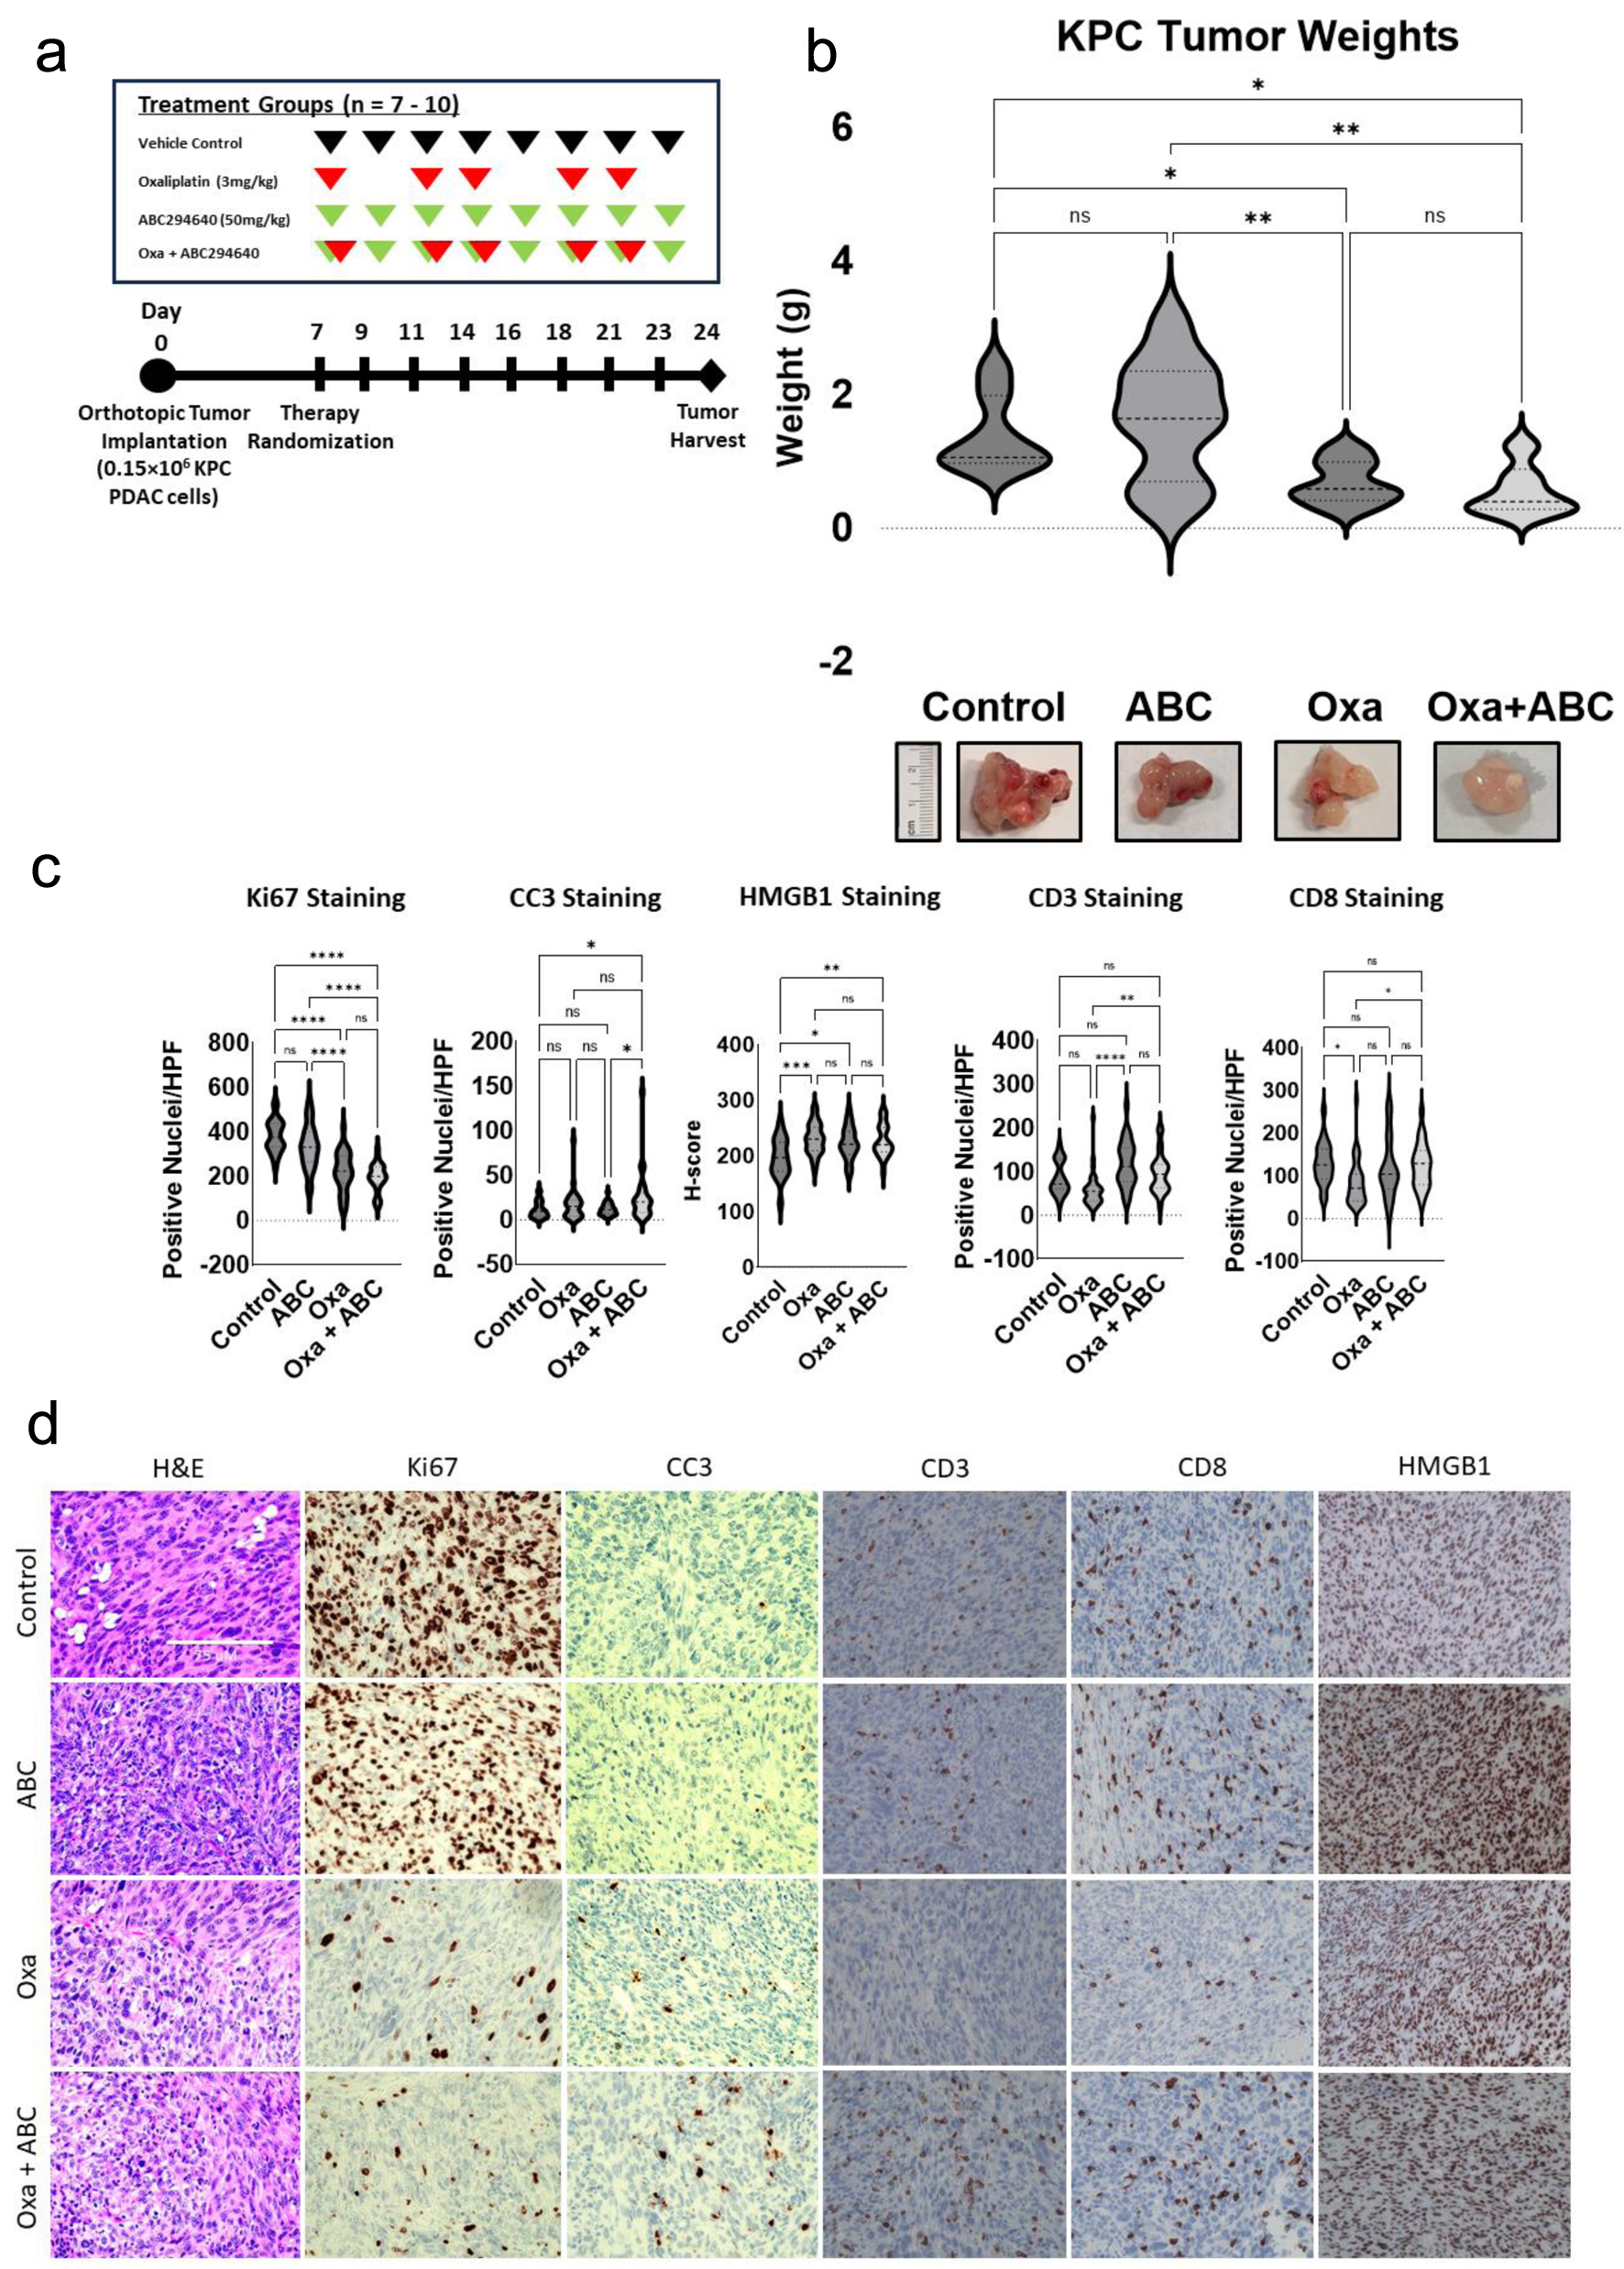
Figure 5. SPHK2-S1P inhibition enhances antitumor activity of Oxa in an orthotopic KPC model. Following treatment for 21 days, orthotopic tumors were harvested and analyzed. (a) In vivo experimental schema. After orthotopic injection of KPC cells, mice were randomized to four treatment groups of 7 - 10 mice each, starting 7 days post-operatively. Oxa at 3 mg/kg (red arrows) was intraperitoneally injected twice weekly and 50 mg/kg of ABC (green arrows) was administrated by oral gavage three times per week. Tumors were harvested 3 weeks after tumor implantation. (b) Analysis of harvested tumor weights by treatment group (*P < 0.05, **P < 0.01). (c) Analysis of IHC stained tumor samples of positively stained nuclei/HPF for Ki67, CC3, CD3, and CD8 between treatment groups. Intensity of HMGB1 staining was quantified by calculating an H-score (*P < 0.05, **P < 0.01). (d) Representative images of IHC stained images of tumors in different treatment groups. ABC: ABC294640; HPF: high power field; IHC: immunohistochemical; Oxa: oxaliplatin; S1P: sphingosine-1-phosphate; SPHK2: sphingosine kinase 2.