World Journal of Oncology, ISSN 1920-4531 print, 1920-454X online, Open Access
Article copyright, the authors; Journal compilation copyright, World J Oncol and Elmer Press Inc
Journal website https://www.wjon.org

Original Article

Volume 15, Number 2, April 2024, pages 192-208


The Combination of Afatinib With Dasatinib or Miransertib Results in Synergistic Growth Inhibition of Stomach Cancer Cells

Figures

Figure 1.
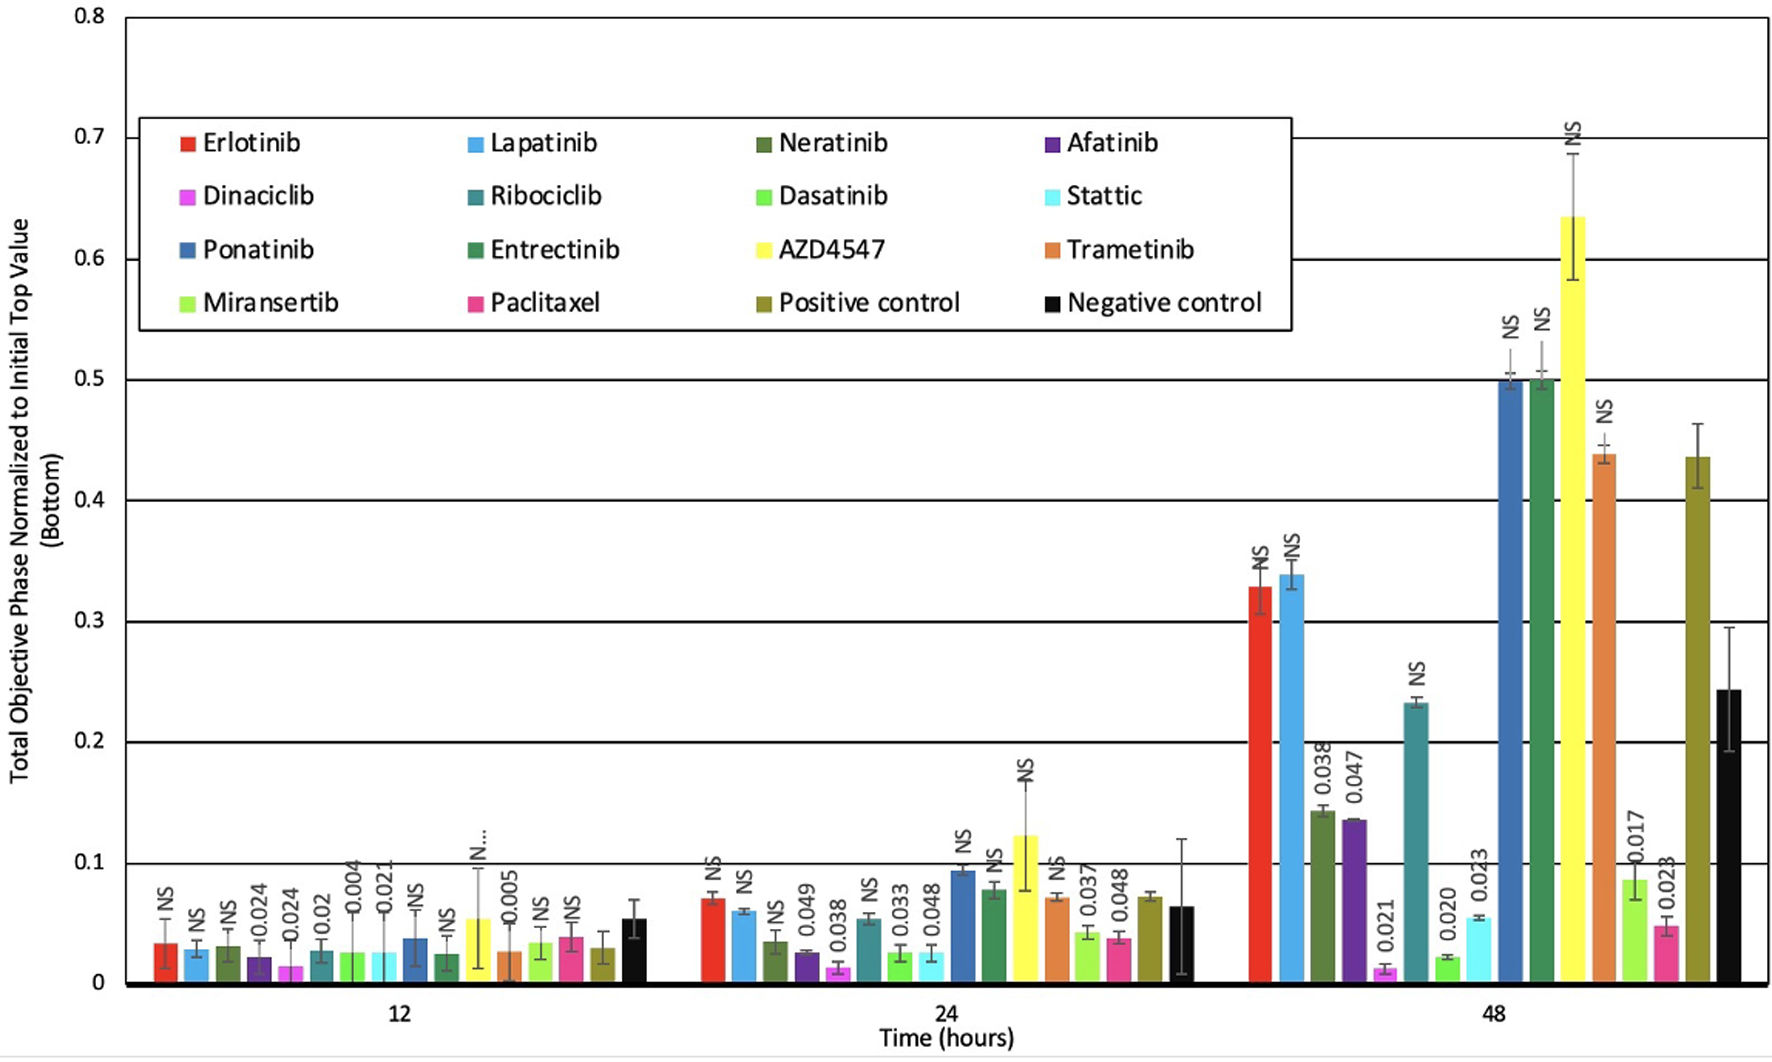
Figure 1. The membrane bound expression level of various growth factor receptors determined by flow cytometry in human stomach cancer cell lines and represented as histograms. EGFR: epidermal growth factor receptor; HER: human epidermal growth factor receptor; c-MET: mesenchymal-epithelial transition factor; ALK: anaplastic lymphoma kinase; CD44: cluster differentiation 44; CD133: cluster differentiation 133; FITC: fluorescein isothiocyanate.
Figure 2.
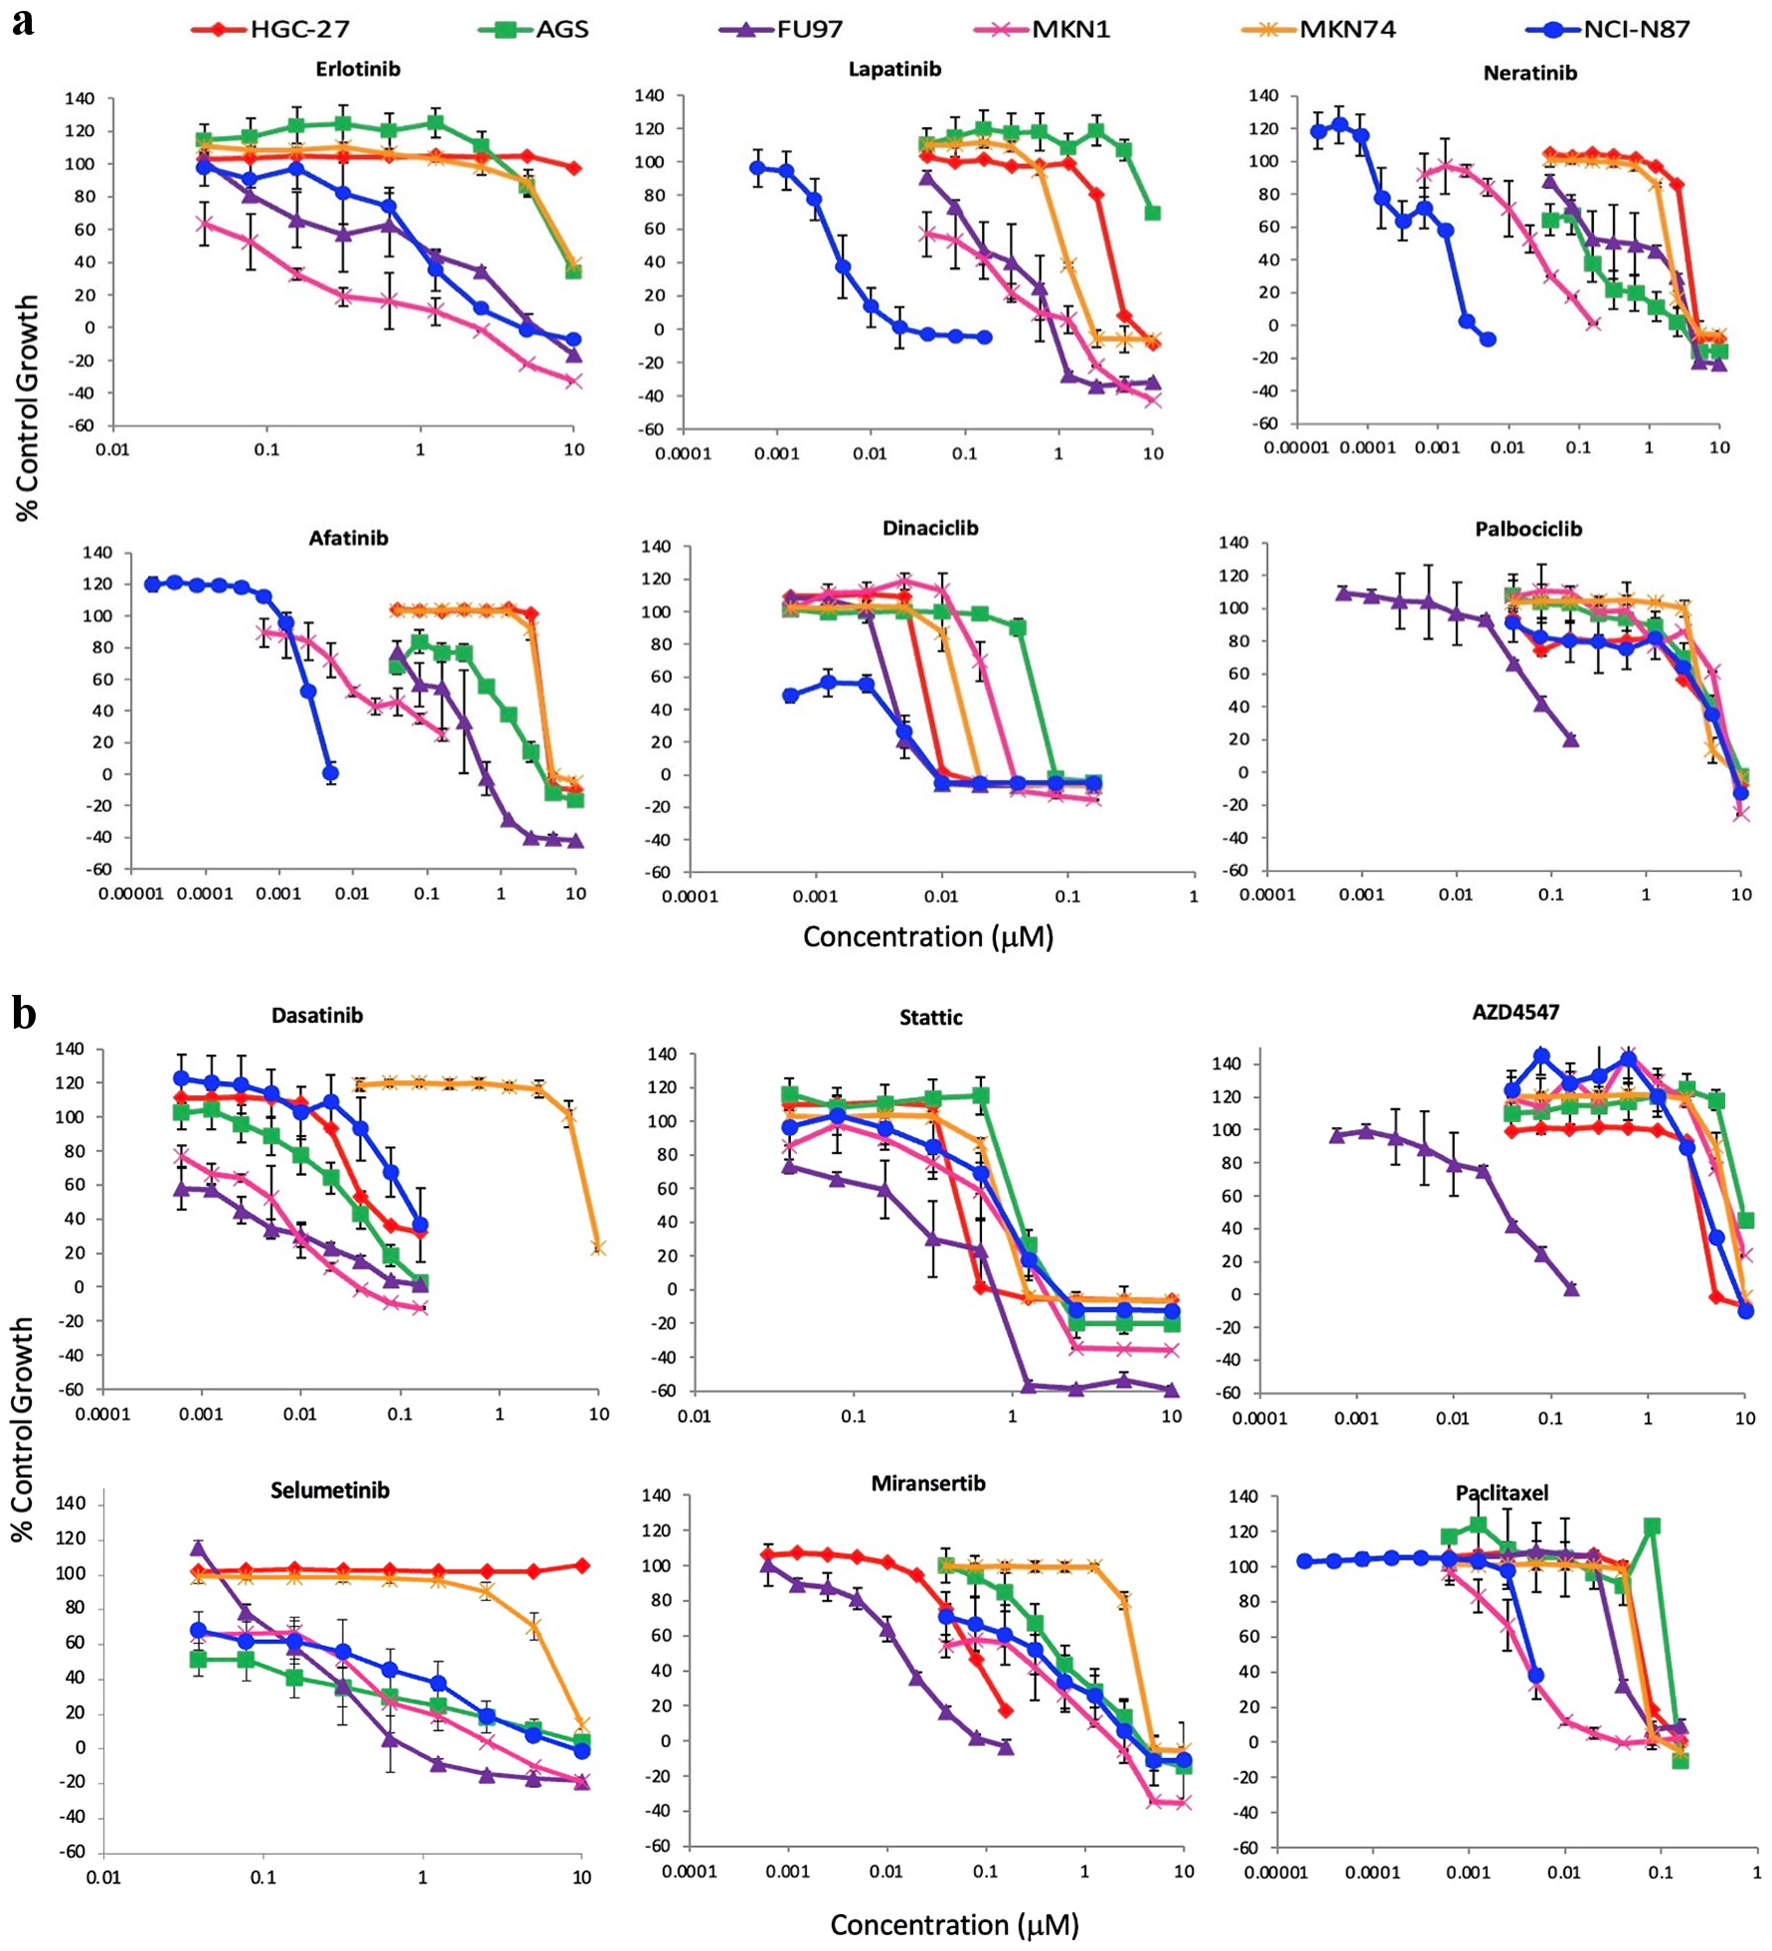
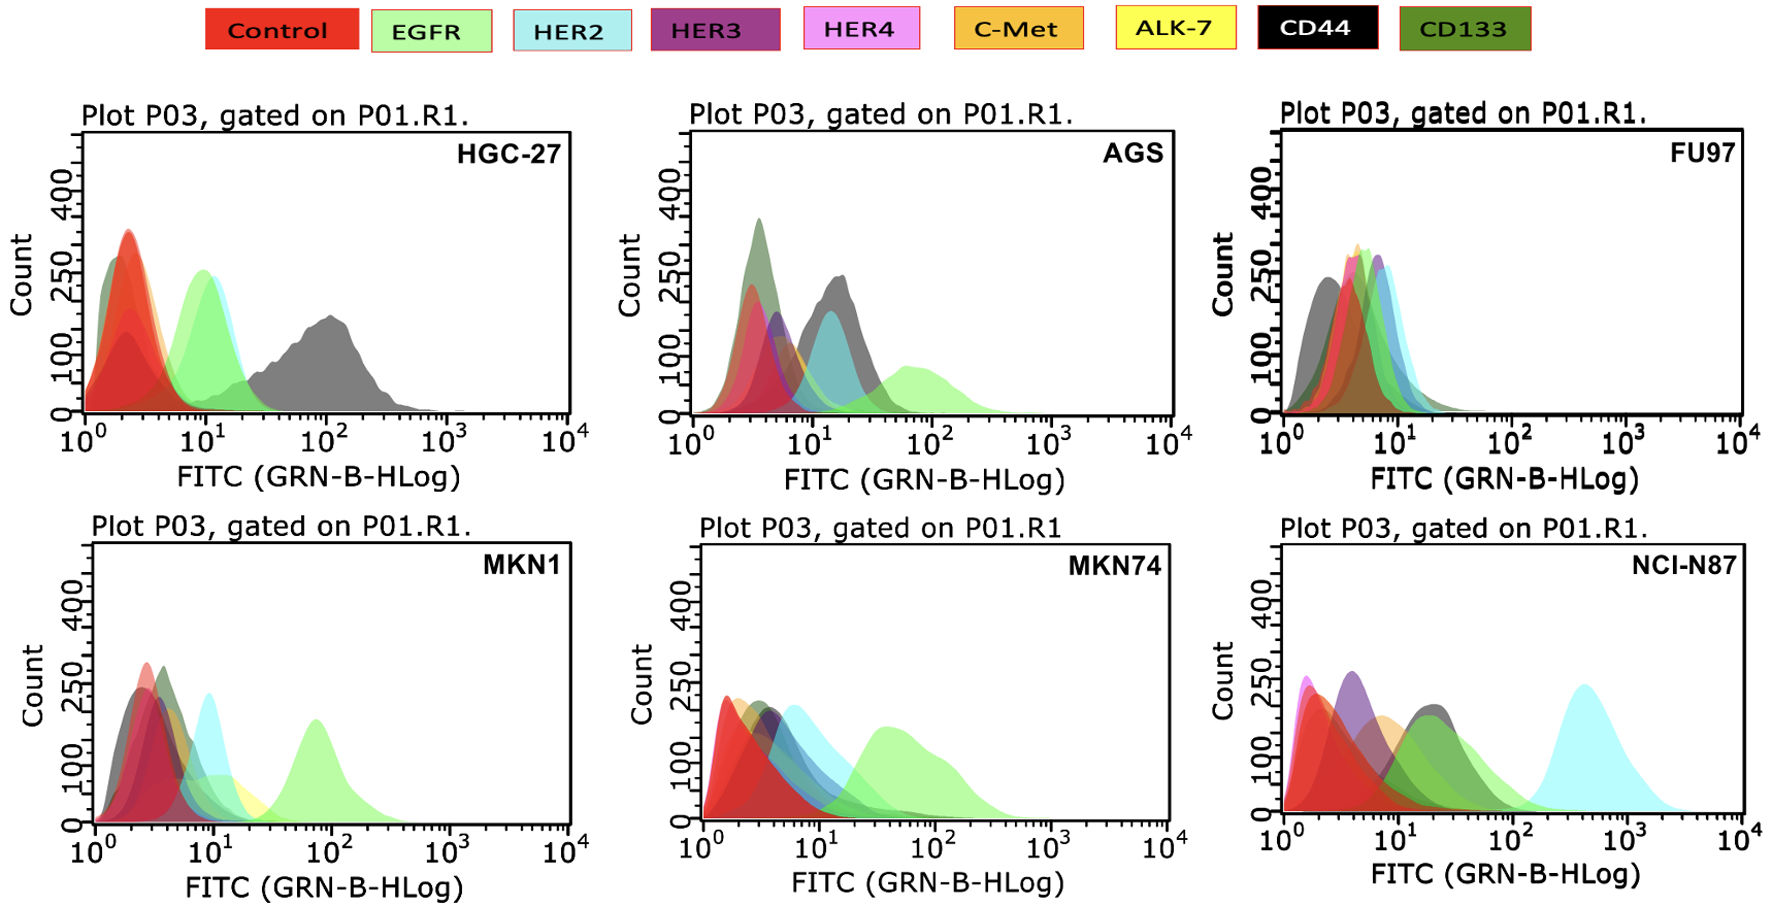
Figure 2. Effect of doubling dilutions of TKIs on the growth inhibition of stomach cancer cell lines. (a) Effect of doubling dilutions of TKI targeting HER family members and CDK inhibitors. (b) Effect of doubling dilutions of TKI targeting downstream signaling pathway inhibitors and cytotoxic agent. Cells were grown in 2% FBS growth medium with or without drugs until control cells (only medium) were confluent. Each point represents the mean ± SD of the triplicate sample. FBS: fetal bovine serum; TKI: tyrosine kinase inhibitor; CDK: cyclin dependent kinase; SD: standard deviation.
Figure 3.
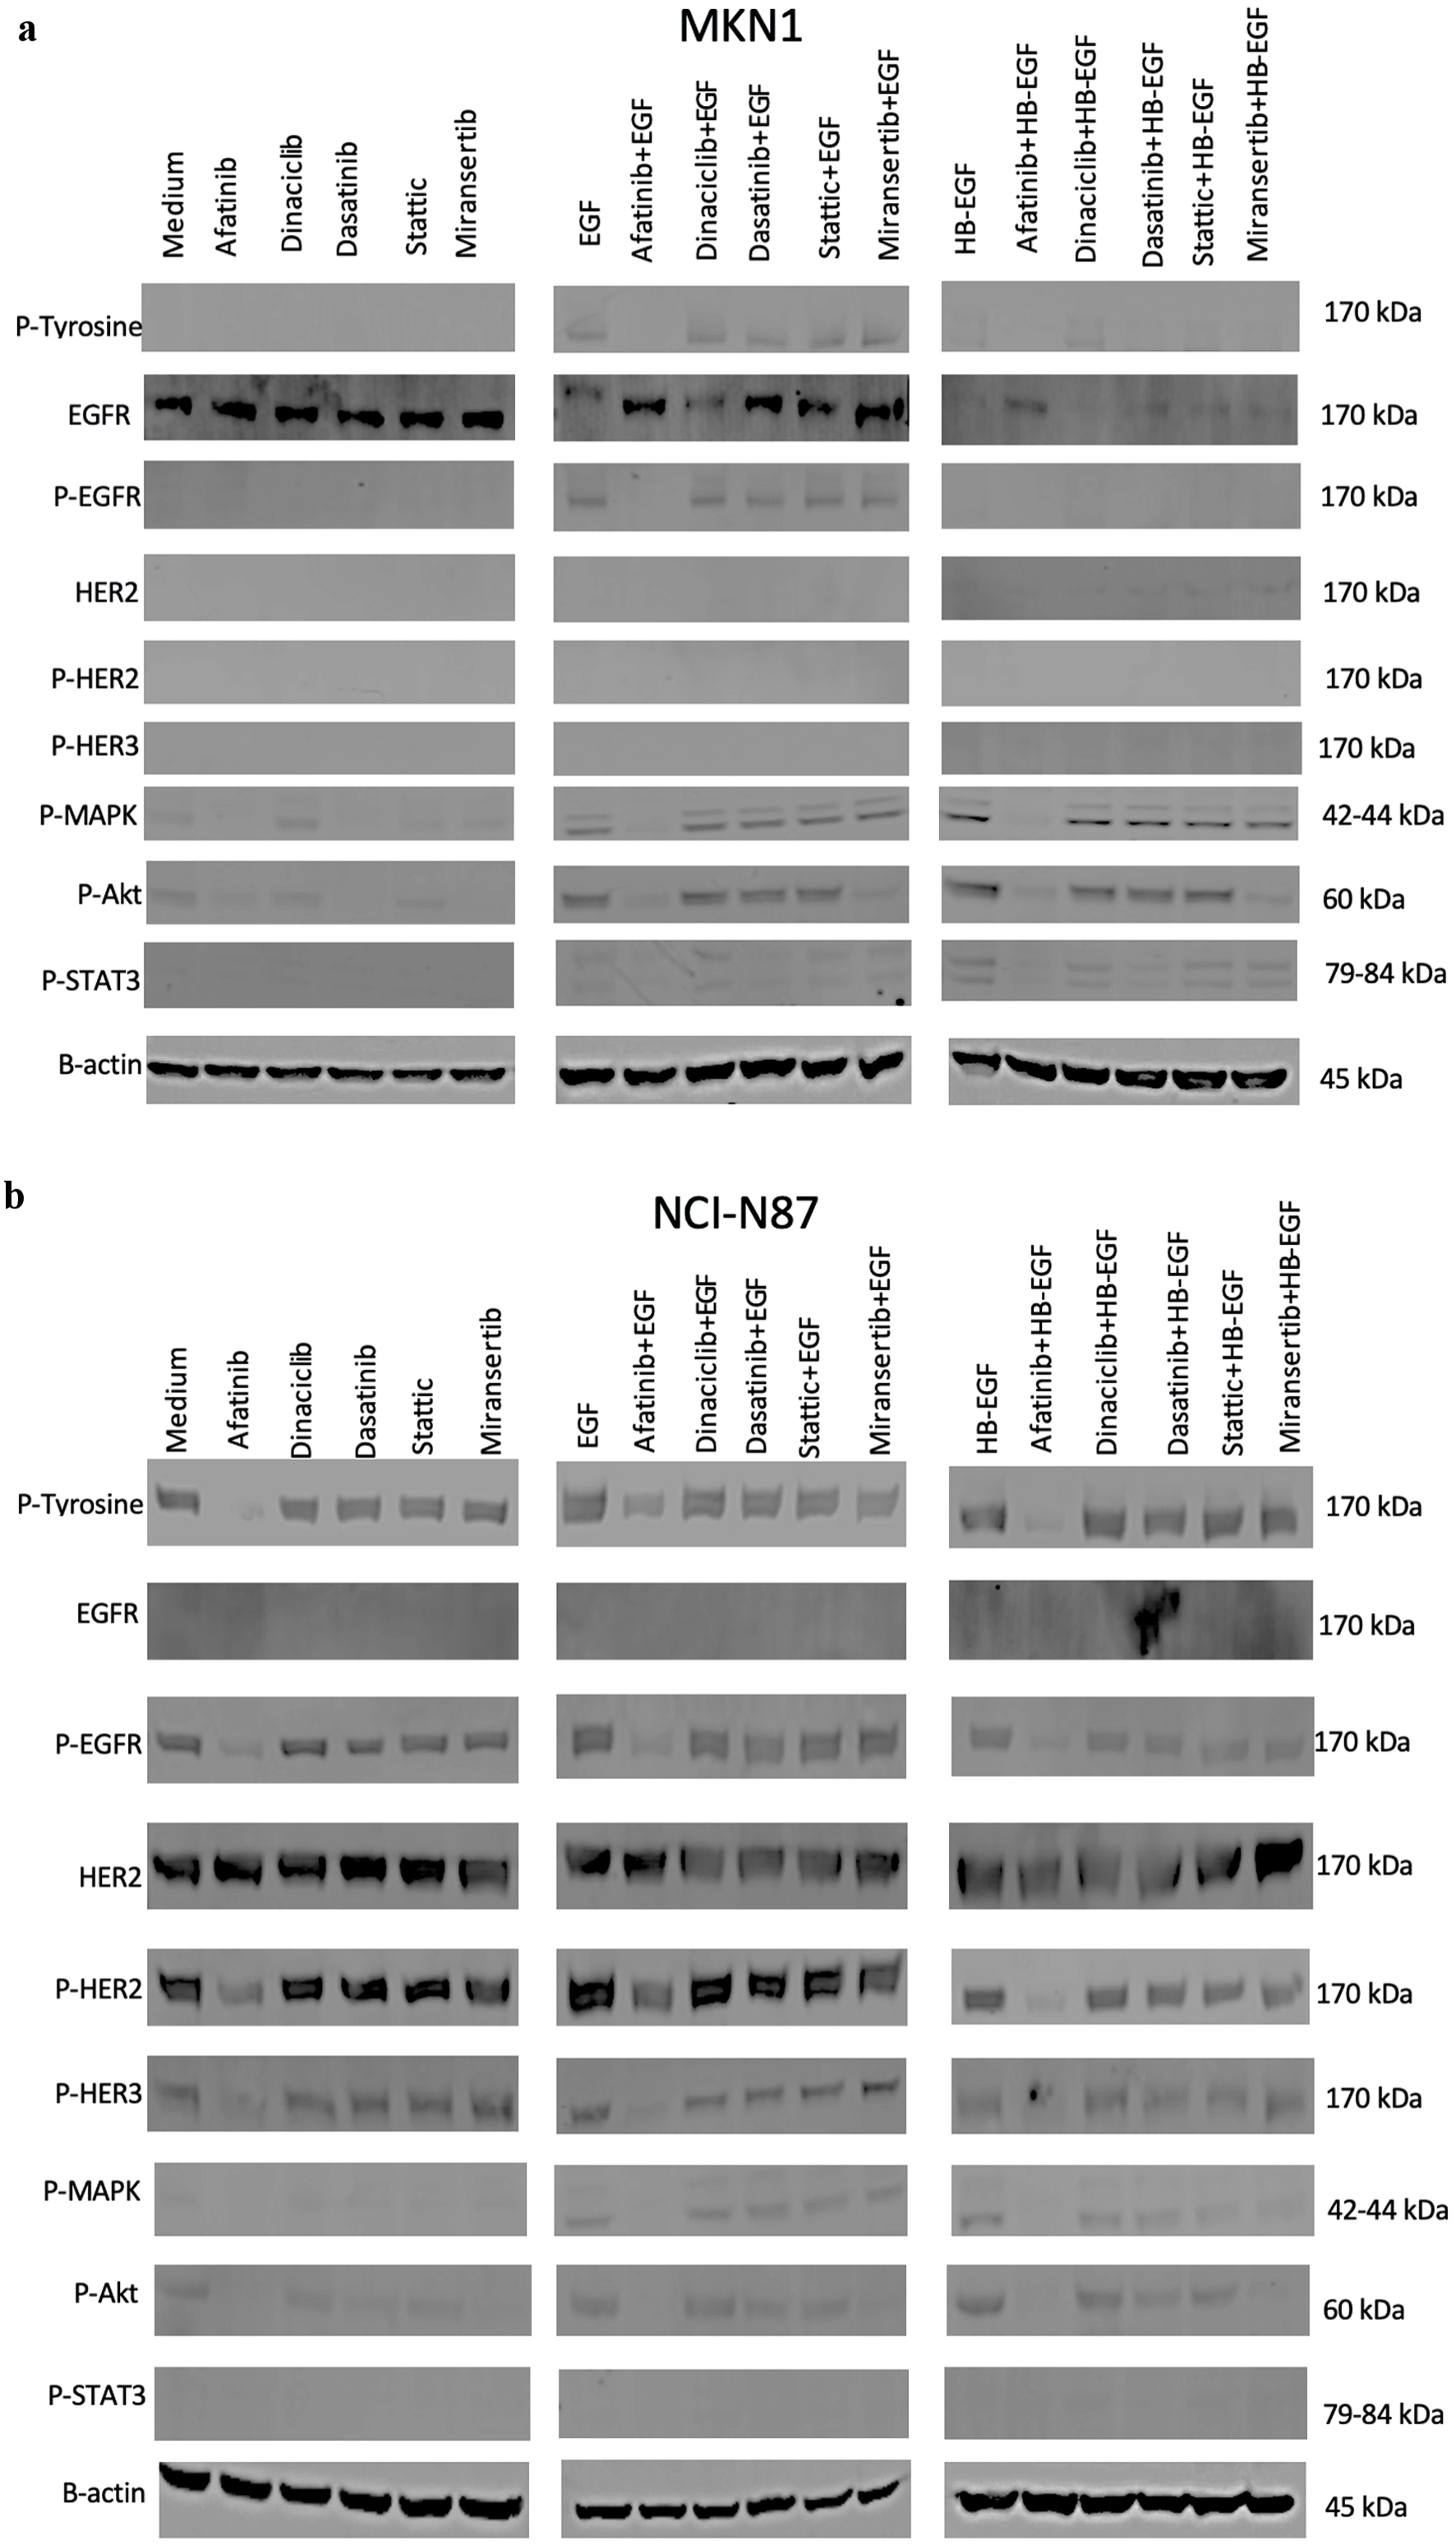
Figure 3. Effect of afatinib, dinaciclib, dasatinib, stattic and miransertib with or without ligands (EGF, HB-EGF) on the phosphorylation of EGFR and downstream cell signaling molecules including MAPK, AKT, STAT3, SRC in MKN1 (a) and NCI-N87 (b) cells. The cells were cultured in 10% FBS RPMI-1640 medium to near confluency. Cells were washed once with 0.5% FBS RPMI-1640 medium and incubated with selected agents (400 nM) for 1 h and then stimulated with 30 nM ligands (EGF, HB-EGF and IGF-II) for 15 min. Cells were then lysed, separated using SDS-PAGE, transferred onto PDVF membranes, probed with the antibody of interest and visualized using LI-COR software. FBS: FBS: fetal bovine serum; RPMI-1640: Roswell Park Memorial Institute-1640 medium; EGF: epidermal growth factor; HB-EGF: heparin-binding EGF-like growth factor; IGF: insulin-like growth factor; EGFR: epidermal growth factor receptor; MAPK: mitogen-activated protein kinase; AKT: protein kinase B or PKB; STAT3: signal transducer and activator of transcription 3; SRC: proto-oncogene tyrosine kinase SRC; SDS-PAGE: sodium dodecyl sulphate-polyacrylamide gel electrophoresis.
Figure 4.
Figure 4. Effect of selected agents on the migration of human stomach cancer cell lines at different time intervals. P < 0.05 was considered significant. NS: not significant.

Tables

Table 1. The Cell Surface Expression of HER Family Members, c-MET, ALK7 and Cancer Stem Cell Markers Measured by FACS Analysis in Human Stomach Cancer Cell Lines
 
Mean fluorescence intensity (MFI)
ControlEGFRHER-2HER-3HER-4c-MetALK7CD44CD133
The data are presented as MFI. HN5, SKBR3 and CaCo2 were used as positive controls. c-MET: hepatocyte growth factor receptor; EGFR: epidermal growth factor receptor; HER: human epidermal growth factor receptor; ALK: anaplastic lymphoma kinase; N/A: not available.
Cell line
  HGC-27 (lymph node metastasis)3.112.514.33.33.43.73.267.12.2
  AGS (primary tumor)3.372.314.25.63.86.85.815.83.2
  FU97 (primary tumor3.85.27.66.64.34.34.23.23.1
  MKN1 (lymph node metastasis)2.980.59.13.73.04.58.02281.84.8
  MKN74 (liver metastasis)3.6104.715.39.54.25.66.55.13.8
  NCI-N87 (liver metastasis)3.246.6595.97.93.113.24.818.52.6
Controls
  HN53.1641.3N/AN/AN/AN/AN/AN/AN/A
  SKBR34.0N/A226N/AN/AN/AN/AN/AN/A
  Caco-22.2N/AN/AN/AN/AN/AN/A47.388.2


Table 2. IC50 Values for Various Types of HER TKIs, CDK, C-MET, SRC and STAT3 Inhibitors
 
IC50 value (µM)
Erlotinib (reversible EGFR inhibitor)Lapatinib (reversible EGFR/HER2 inhibitor)Neratinib (irreversible EGFR/HER2 inhibitor)Afatinib (irreversible EGFR/HER2/HER4 inhibitor)Palbociclib (CDK4/CDK6 inhibitor)Dinaciclib (CDK1/CDK2/ CDK5/CDK9 inhibitor)Ribociclib (CDK4/CDK6 inhibitor)Capmatinib (c-MET inhibitor)Dasatinib (Abl/Src/c-Kit inhibitor)Stattic (STAT3 inhibitor)
FBS 2%FBS 10%FBS 2%FBS 10%FBS 2%FBS 10%FBS 2%FBS 10%FBS 2%FBS 10%FBS 2%FBS 10%FBS 2%FBS 10%FBS 2%FBS 10%FBS 2%FBS 10%FBS 2%FBS 10%
HER: human epidermal growth factor receptor family; CDK: cyclin dependent kinase; TKI: tyrosine kinase inhibitor; FBS: fetal bovine serum; IC50: 50% inhibitory concentration; EGFR: epidermal growth factor receptor; c-MET: hepatocyte growth factor receptor; STAT3: signal transducer and activator of transcription 3.
HGC-27> 10.00> 10.003.35 ± 0.15> 10.002.4 ± 0.532.71 ± 0.693.05 ± 0.343.26 ± 0.152.21 ± 1.553.73 ± 1.180.009 ± 0.0010.01 ± 0> 10.00> 10.00> 10.00> 10.000.04 ± 0.0014.89 ± 1.721.67 ± 0.171.69 ± 0.18
AGS7.22 ± 0.88> 10.00> 10.00> 10.000.17 ± 0.082.43 ± 1.030.96 ± 0.083.97 ± 0.754.52 ± 1.12> 10.000.009 ± 0.0000.009 ± 0.001> 10.00> 10.00> 10.00> 10.000.03 ± 0.0010.24 ± 0.311.23 ± 0.012.29 ± 0.18
FU971.48 ± 0.602.95 ± 0.840.48 ± 0.272.48 ± 0.760.46 ± 0.120.04 ± 0.020.26 ± 0.070.66 ± 0.130.007 ± 0.010.05 ± 0.030.004 ± 0.000.005 ± 0.00> 10.00> 10.00> 10.00> 10.000.002 ± 0.000.12 ± 0.0080.38 ± 0.090.83 ± 0.28
MKN10.06 ± 0.024.19 ± 2.720.15 ± 0.063.98 ± 0.670.03 ± 0.0080.13 ± 0.060.015 ± 0.0010.86 ± 0.105.36 ± 0.81> 10.000.023 ± 0.0010.003 ± 0.001> 10.00> 10.00> 10.00> 10.000.004 ± 0.0010.015 ± 0.0040.77 ± 0.111.67 ± 0.22
MKN748.87 ± 1.08> 10.001.22 ± 0.228.39 ± 0.042.06 ± 0.212.57 ± 0.183.33 ± 0.104.32 ± 0.204.03 ± 0.133.94 ± 0.220.011 ± 0.0010.014 ± 0.001> 10.00> 10.00> 10.00> 10.008.34 ± 0.77> 10.002.21 ± 0.042.42 ± 0.46
NCI-N870.89 ± 0.170.23 ± 0.170.004 ± 0.0010.013 ± 0.0010.001 ± 0.170.001 ± 0.0010.002 ± 0.190.003 ± 0.002.90 ± 2.017.64 ± 0.170.008 ± 0.0010.001 ± 0.001> 10.00> 10.00> 10.00> 10.000.12 ± 0.0010.19 ± 0.070.87 ± 0.111.39 ± 0.05


Table 3. IC50 Values for Growth Factor Receptor Inhibitors, Downstream Signaling Molecules Inhibitors and Cytotoxic Agents
 
IC50 value (µM)
Ponatinib (Abl/ PDGFRa/VEGFR2/FGFR1 inhibitor)Entrectinib (TrkA/B/C/ROS/ALK inhibitor)AZD4547 (FGFR 1/2/3 inhibitor)Trametinib (MEK 1/2 inhibitor)Selumetinib (MEK/ERK1/ERK2 inhibitor)Miransertib (AKT1/2/3 inhibitor)Lorlatinib (ALK/Ros1 inhibitor)Docetaxel (inhibits of depolymerization of microtubules)Paclitaxel (microtubule polymer stabilizer)
TKI: tyrosine kinase inhibitor; FBS: fetal bovine serum; IC50: 50% inhibitory concentration; EGFR: epidermal growth factor receptor; ALK anaplastic lymphoma kinase; CDK: cyclin dependent kinase; PDGFR: platelet-derived growth factor receptor; VEGFR: vascular endothelial growth factor receptor; FGFR: fibroblast growth factor receptor.
FBS 2%FBS 10%FBS 2%FBS 10%FBS 2%FBS 10%FBS 2%FBS 10%FBS 2%FBS 10%FBS 2%FBS 10%FBS 2%FBS 10%FBS 2%FBS 10%FBS 2%FBS 10%
HGC-270.37 ± 0.031.02 ± 0.180.71 ± 0.032.46 ± 0.542.90 ± 0.45> 10.008.13 ± 1.63> 10.00> 10.00> 10.000.08 ± 0.0010.81 ± 0.55> 10.00> 10.000.0001 ± 0.050.003 ± 0.250.07 ± 0.0060.08 ± 0.004
AGS0.39 ± 0.030.85 ± 0.011.05 ± 0.172.73 ± 0.168.53 ± 2.57> 10.000.005 ± 0.0010.002 ± 0.000.05 ± 0.011.53 ± 2.470.60 ± 0.060.39 ± 0.128.34 ± 4.79> 10.000.0001 ± 0.010.003 ± 0.060.15 ± 0.0010.12 ± 0.02
FU970.015 ± 0.0020.05 ± 0.0030.06 ± 0.020.26 ± 0.090.04 ± 0.0070.08 ± 0.0020.03 ± 0.0060.005 ± 0.0010.16 ± 0.030.30 ± 0.030.017 ± 0.0040.07 ± 0.0054.56 ± 2.30> 10.000.009 ± 0.360.002 ± 0.110.04 ± 0.0040.06 ± 0.003
MKN10.09 ± 0.040.74 ± 0.070.62 ± 0.114.18 ± 0.474.20 ± 2.91> 10.000.006 ± 0.0010.014 ± 0.0010.07 ± 0.081.99 ± 0.520.15 ± 0.030.75 ± 0.75> 10.00> 10.000.001 ± 0.0010.002 ± 0.480.004 ± 0.120.007 ± 0.001
MKN741.02 ± 0.202.12 ± 0.031.24 ± 0.062.55 ± 0.316.07 ± 0.64> 10.000.008 ± 0.0081.35 ± 1.066.80 ± 0.16> 10.003.51 ± 0.737.27 ± 0.96> 10.00> 10.000.0001 ± 0.0010.0004 ± 0.0010.06 ± 0.0010.07 ± 0.001
NCI-N870.34 ± 0.061.03 ± 0.020.39 ± 0.182.11 ± 0.203.40 ± 1.227.27 ± 1.840.003 ± 0.0010.03 ± 0.0030.52 ± 0.030.47 ± 0.200.30 ± 0.051.69 ± 0.35> 10.00> 10.000.008 ± 0.190.001 ± 0.0010.005 ± 0.260.001 ± 0.001


Table 4. Effect of Various Agents on the Cell Cycle Distribution of Human Stomach Cancer Cell Lines
 
Cell line/treatmentSub G1G0/G1SG2/M
Each value is expressed as mean ± SD. SD: standard deviation.
HGC-27
  Control0.17 ± 0.0565.49 ± 2.2410.50 ± 4.3118.87 ± 6.49
  Afatinib1.71 ± 1.8445.86 ± 12.5614.32 ± 2.8435.53 ± 16.45
  Dinaciclib34.36 ± 9.4425.12 ± 2.9830.05 ± 10.775.33 ± 0.15
  Dasatinib0.37 ± 0.2058.19 ± 8.7510.13 ± 0.8829.02 ± 8.82
  Stattic0.70 ± 0.7046.01 ± 0.9812.77 ± 0.7836.58 ± 1.99
  Paclitaxel31.20 ± 15.2224.62 ± 1.2116.47 ± 3.5923.18 ± 10.97
AGS
  Control3.77 ± 0.2849.68 ± 1.3316.90 ± 0.4223.89 ± 0.25
  Afatinib18.65 ± 6.1251.16 ± 5.6610.22 ± 2.7316.97 ± 3.42
  Dinaciclib36.70 ± 1.0228.18 ± 0.5016.21 ± 0.0116.47 ± 0.93
  Dasatinib33.98 ± 6.6830.27 ± 3.5911.87 ± 1.5914.79 ± 2.02
  Stattic31.62 ± 1.4135.20 ± 4.8515.27 ± 2.2715.09 ± 0.68
  Paclitaxel53.82 ± 3.2420.95 ± 9.7212.94 ± 4.6217.49 ± 0.45
FU97
  Control1.79 ± 0.6780.85 ± 4.696.64 ± 2.099.38 ± 2.90
  Afatinib3.31 ± 2.4382.15 ± 4.907.30 ± 3.275.87 ± 3.68
  Dinaciclib53.01 ± 2.8835.57 ± 3.566.03 ± 0.113.27 ± 0.14
  Dasatinib6.29 ± 4.4484.68 ± 3.342.07 ± 0.515.03 ± 0.06
  Stattic5.62 ± 4.1381.35 ± 1.134.79 ± 2.786.43 ± 1.50
  Paclitaxel55.28 ± 0.6917.79 ± 0.994.38 ± 0.8121.13 ± 1.25
MKN1
  Control1.51 ± 0.6872.33 ± 6.878.41 ± 1.2214.65 ± 3.56
  Afatinib1.82 ± 0.4978.58 ± 1.477.76 ± 1.538.63 ± 0.52
  Dinaciclib18.12 ±2.735.19 ± 2.5771.36 ± 4.974.11 ± 0.06
  Dasatinib2.33 ± 0.3775.78 ± 0.758.01 ± 1.2810.23 ± 1.43
  Stattic2.29 ± 0.0483.23 ± 1.266.03 ± 0.246.40 ± 0.18
  Paclitaxel10.32 ± 0.3452.10 ± 2.1513.67 ± 0.2021.73 ± 1.59
MKN74
  Control4.99 ± 0.6953.79 ± 2.4113.88 ± 3.0425.20 ± 0.54
  Afatinib8.54 ± 1.7863.30 ± 1.2911.16 ± 1.7515.88 ± 0.86
  Dinaciclib26.75 ± 4.0047.79 ± 3.207.85 ± 2.7415.11 ± 2.60
  Dasatinib4.52 ± 0.0464.39 ± 4.0013.56 ± 0.4715.43 ± 3.83
  Stattic16.56 ± 1.6152.37 ± 1.3011.94 ± 0.5316.83 ± 2.67
  Paclitaxel50.35 ± 1.6313.35 ± 0.0513.31 ± 1.8718.07 ± 1.24
NCI-N87
  Control2.09 ± 0.1656.23 ± 2.7515.71 ± 3.4022.41 ± 1.63
  Afatinib8.15 ± 1.9756.54 ± 3.9510.66 ± 3.8118.63 ± 0.11
  Dinaciclib52.70 ± 4.7437.20 ± 2.652.72 ± 0.134.35 ± 0.70
  Dasatinib8.10 ± 3.7862.53 ± 4.487.28 ± 0.8614.91 ± 1.27
  Stattic11.95 ± 5.0855.87 ± 7.3310.33 ± 5.0817.04 ± 8.41
  Paclitaxel39.35 ± 7.0121.15 ± 7.6013.28 ± 3.0017.64 ± 9.47


Table 5. Combination Index Values of Afatinib When Combined With Palbociclib, Dinaciclib, Capmatinib, Dasatinib, Stattic, Ponatinib, AZD4547, Trametinib, Miransertib, Paclitaxel in Human Stomach Cancer Cell Lines
 
Combination index (CI)
AGSMKN1NCI-N87
TKI: tyrosine kinase inhibitor; FBS: fetal bovine serum.
TKI combinationFBS 2%FBS 10%FBS 2%FBS 10%FBS 2%FBS 10%
Afatinib + palbociclib0.361.020.381.891.071.31
Afatinib + dinaciclib0.951.080.420.531.582.23
Afatinib + capmatinib0.620.850.240.481.551.28
Afatinib+ dasatinib0.480.460.370.231.020.90
Afatinib + stattic0.870.860.870.681.062.60
Afatinib+ ponatinib2.511.230.450.432.631.19
Afatinib + AZD45471.321.600.201.141.691.14
Afatinib+ trametinib0.371.110.401.161.220.8
Afatinib + miransertib0.600.820.260.160.760.71
Afatinib + paclitaxel0.071.201.330.411.642.04


Table 6. Linear Regression Analysis of the Expression of Various Receptors Against the Sensitivity of Human Stomach Cancer Cell Lines to Treatment With Various TKIs, CDK Inhibitors, STAT3 Inhibitor and a Cytotoxic Agent
 
Drugs/cell surface markers2%10%
EGFRHER2CD44EGFRHER2CD44
R2 (P value)R2 (P value)R2 (P value)R2 (P value)R2 (P value)R2 (P value)
TKI: tyrosine kinase inhibitor; EGFR: epidermal growth factor receptor; CDK: cyclin dependent kinase; HER: human epidermal growth factor receptor; STAT3: signal transducer and activator of transcription 3.
Erlotinib0.013 (0.830)0.173 (0.412)0.258 (0.303)0.089 (0.566)0.448 (0.146)0.050 (0.671)
Lapatinib0.015 (0.929)0.099 (0.544)0.90 (0.564)0.052 (0.663)0.436 (0.153)0.041 (0.701)
Neratinib0.003 (0.916)0.142 (0.461)0.130 (0.483)0.074 (0.602)0.206 (0.366)0.170 (0.417)
Afatinib0.028 (0.753)0.157 (0.537)0.154 (0.442)0.166 (0.422)0.308 (0.253)0.115 (0.511)
Palbociclib0.737 (0.029)0.004 (0.905)0.311 (0.250)0.330 (0.233)0.048 (0.678)0.255 (0.307)
Dinaciclib0.347 (0.218)0.038 (0.710)0.877 (0.006)0.098 (0.545)0.355 (0.212)0.161 (0.431)
Dasatinib0.399 (0.179)0.019 (0.797)0.051 (0.667)0.143 (0.460)0.076 (0.596)0.092 (0.558)
Stattic0.234 (0.331)0.050 (0.671)0.092 (0.560)0.631 (0.059)0.068 (0.618)0.001 (0.943)
Ponatinib0.384 (0.190)0.001 (0.952)0.153 (0.443)0.490 (0.121)0.003 (0.918)0.028 (0.752)
Entrectinib0.585 (0.076)0.101 (0.540)0.004 (0.900)0.448 (0.146)0.010 (0.850)0.495 (0.119)
AZD45470.661 (0.066)0.057 (0.649)0.307 (0.254)0.413 (0.169)0.004 (0.901)0.072 (0.607)
Trametinib0.259 (0.302)0.038 (0.710)0.031 (0.737)0.185 (0.394)0.050 (0.671)0.043 (0.693)
Selumetinib0.006 (0.883)0.093 (0.557)0.86 (0.574)0.032 (0.734)0.135 (0.473)0.042 (0.697)
Miransertib0.490 (0.121)0.027 (0.754)0.056 (0.651)0.001 (0.966)0.722 (0.032)0.231 (0.335)
Docetaxel0.008 (0.965)0.980 (< 0.001)0.16 (0.812)0.182 (0.399)0.549 (0.092)0.007 (0.915)
Paclitaxel0.014 (0.821)0.182 (0.399)0.219 (0.349)0.000 (0.995)0.333 (0.230)0.266 (0.295)