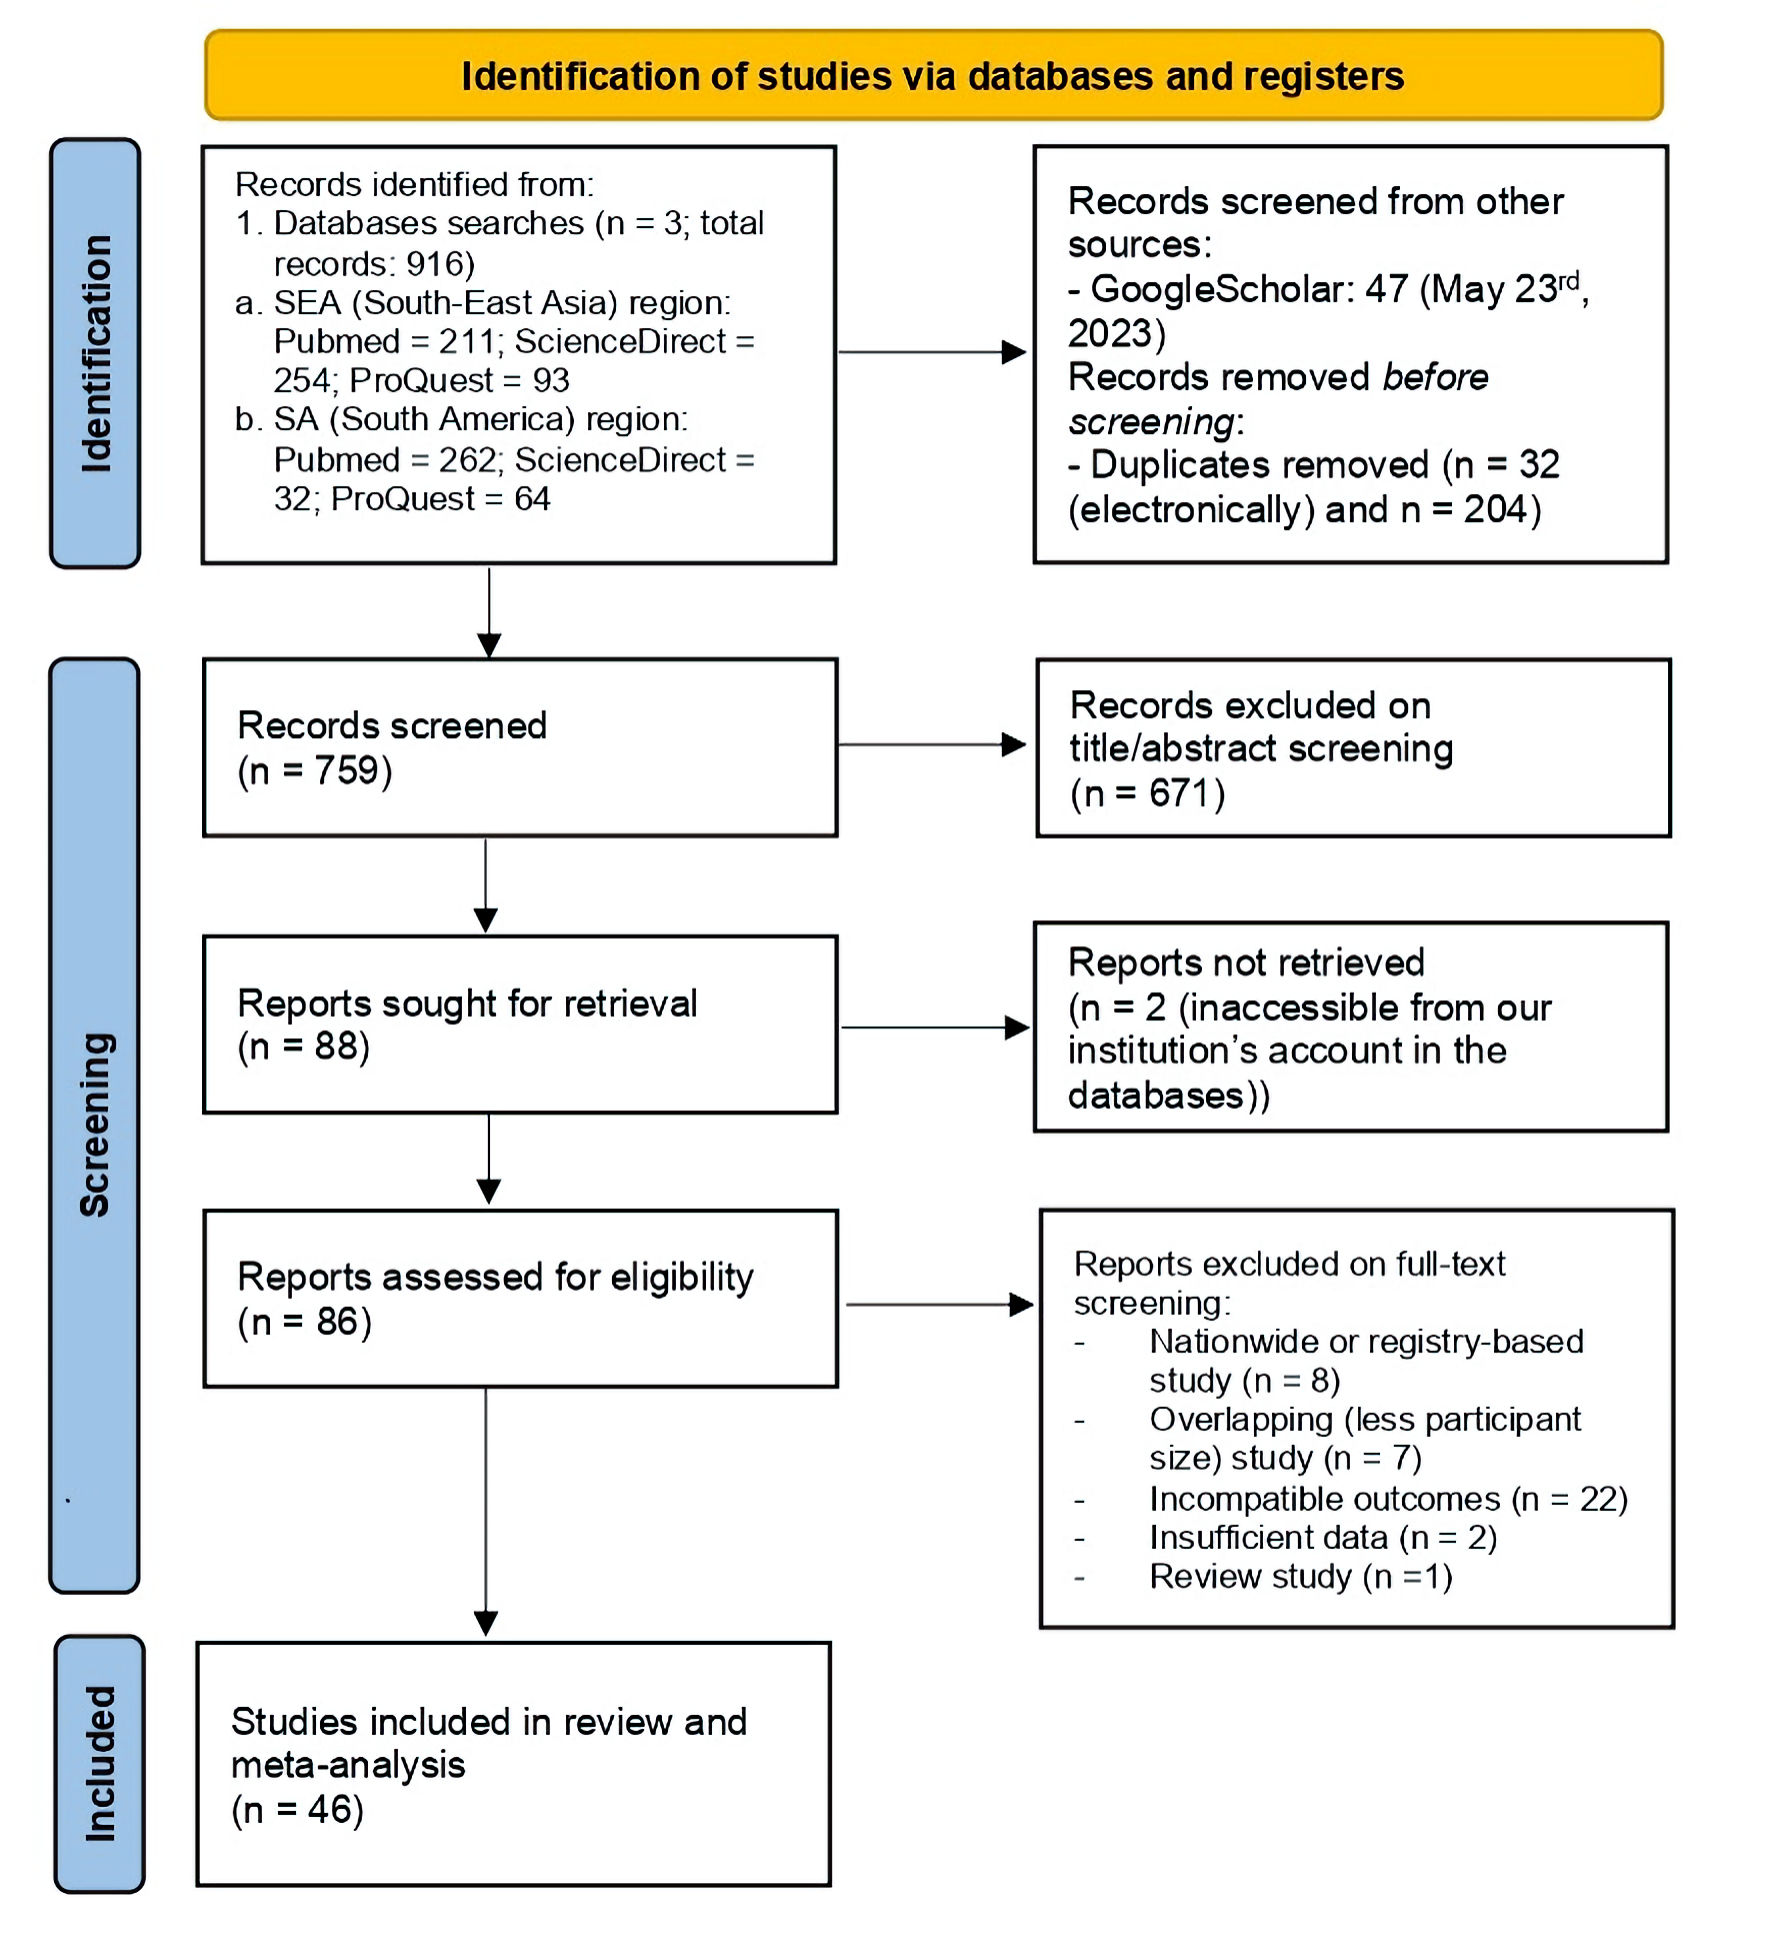
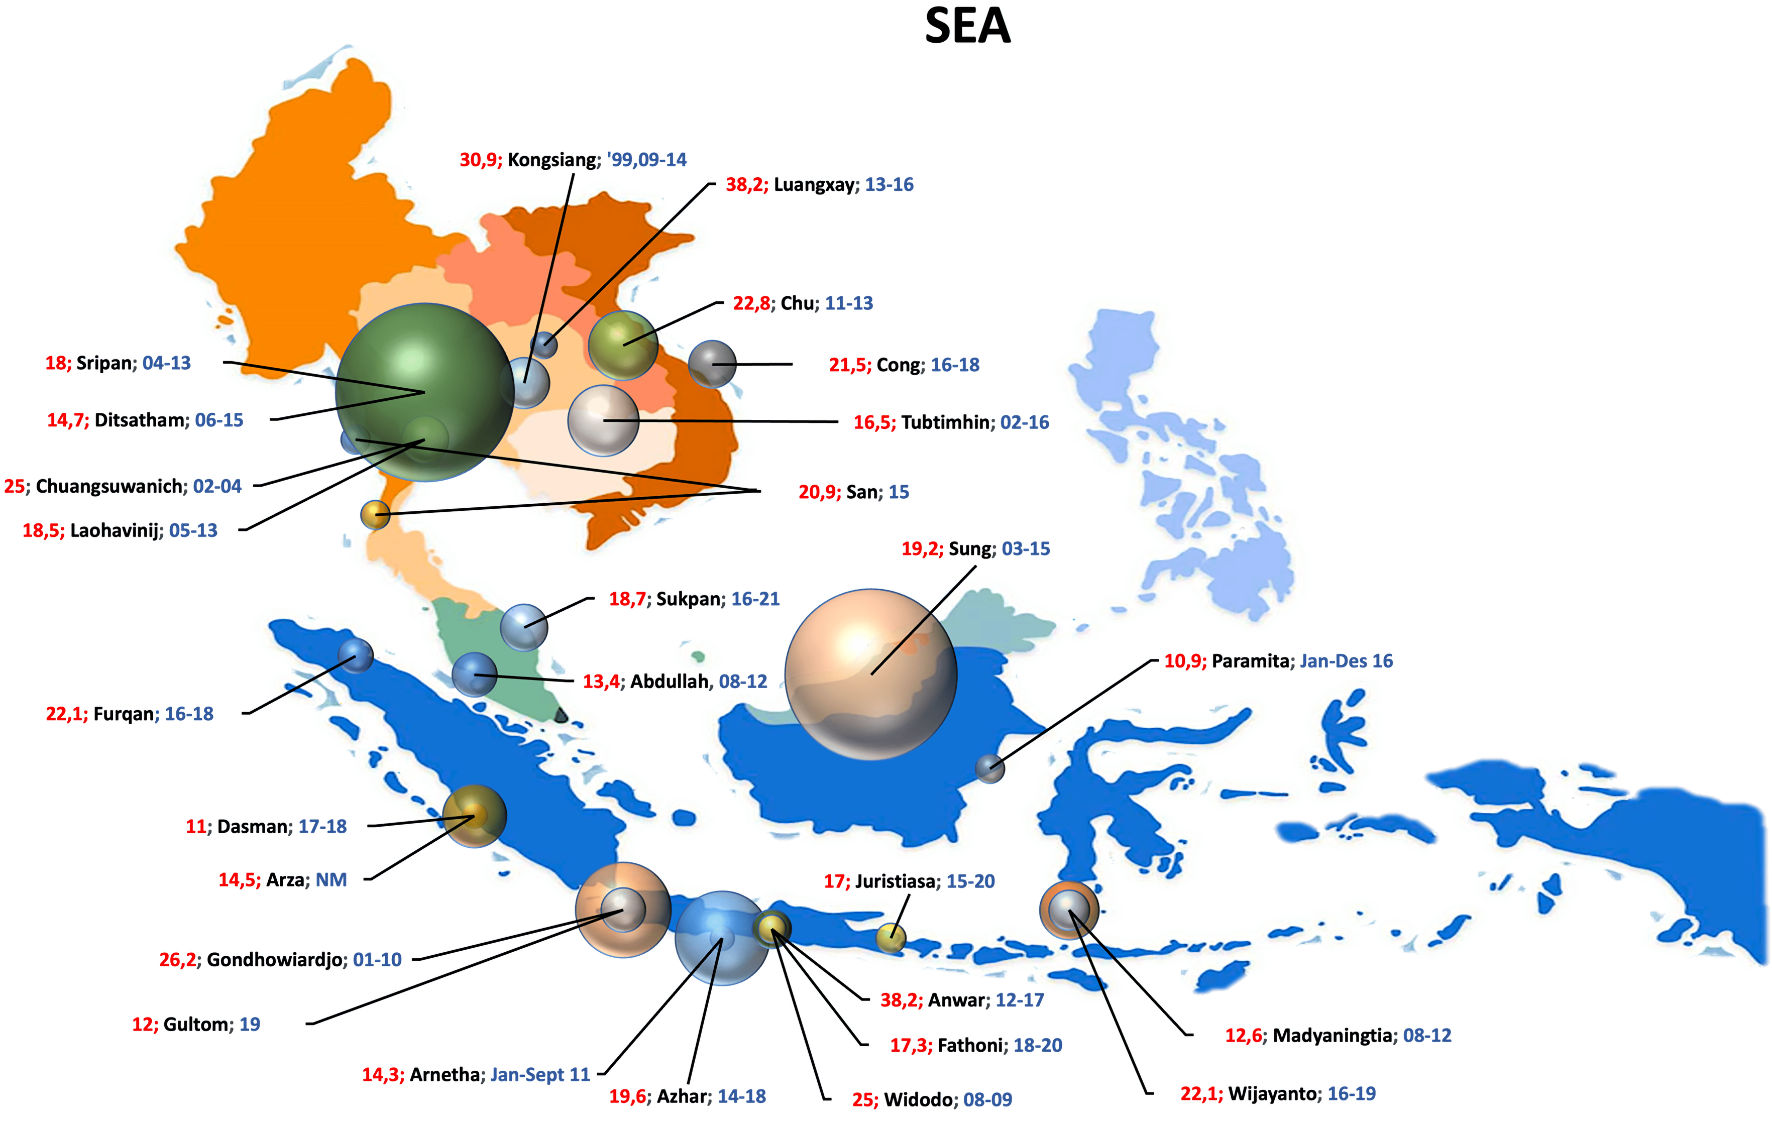
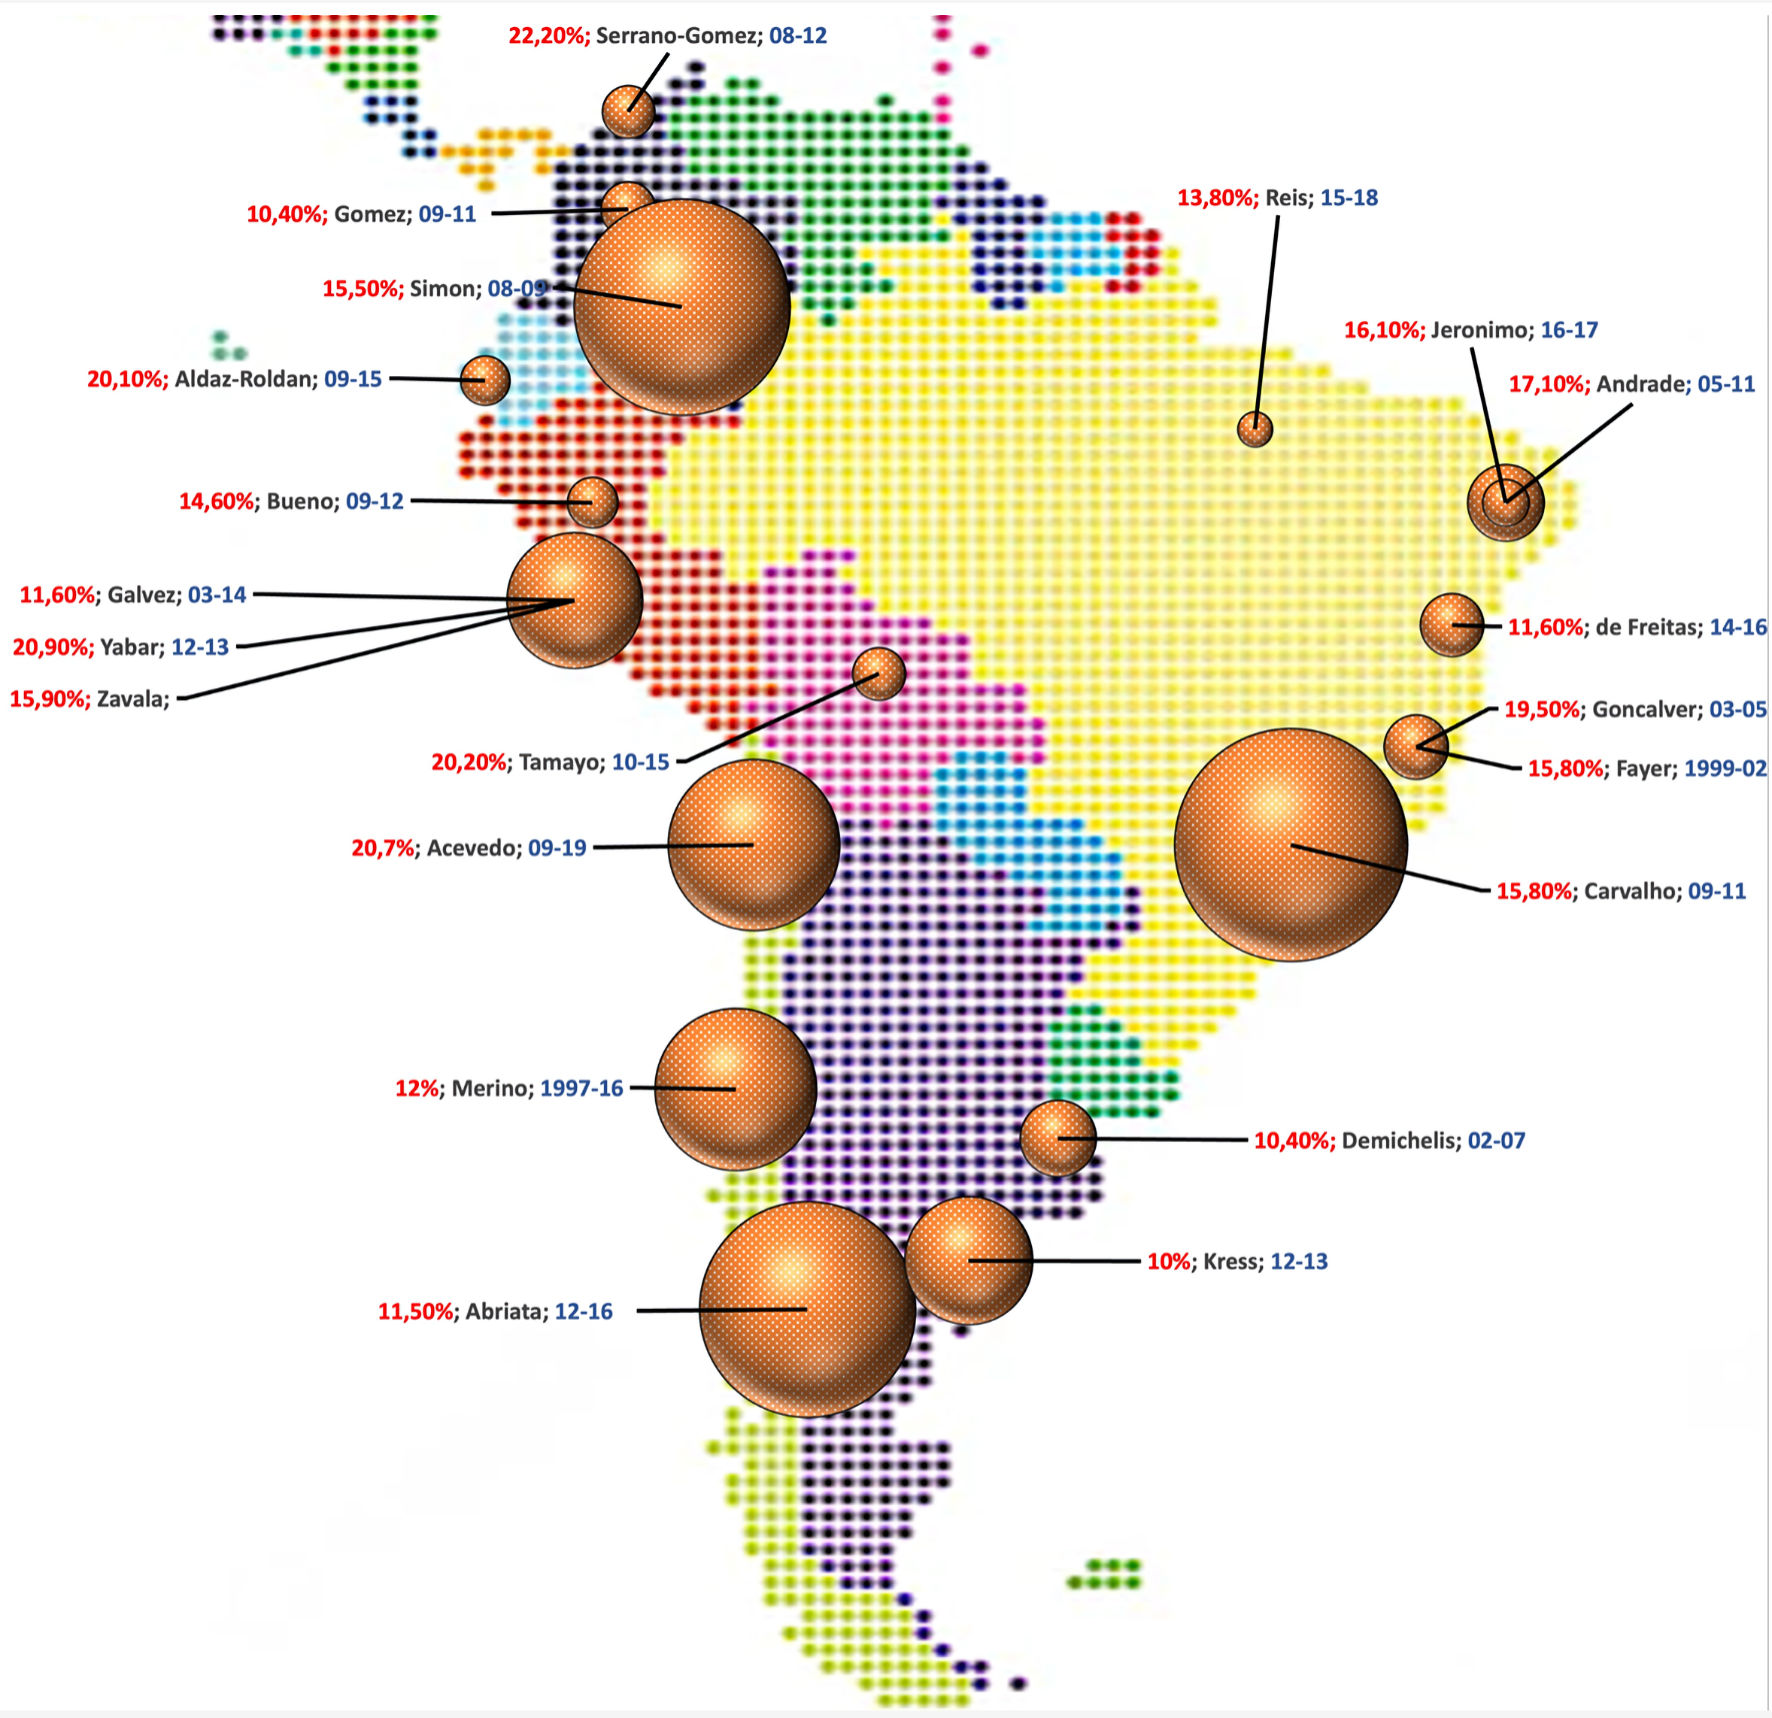
Figure 1. Study identification phases of this review in PRISMA flow diagram. PRISMA: the Preferred Reporting Items for Systematic Review and Meta-Analysis; SEA: South-East Asia; SA: South America.
| World Journal of Oncology, ISSN 1920-4531 print, 1920-454X online, Open Access |
| Article copyright, the authors; Journal compilation copyright, World J Oncol and Elmer Press Inc |
| Journal website https://www.wjon.org |
Review
Volume 15, Number 3, June 2024, pages 355-371
Intercontinental Comparison of Immunohistochemical Subtypes Among Individuals With Breast Cancer in South-East Asia and South America: A Scoping Systematic Review and Meta-Analysis of Observational Studies
Figures
Table
| Study | Country | City | Observation period | Center | Sample size | Age (years) | NOS score | Continent |
|---|---|---|---|---|---|---|---|---|
| H: hospital; GH: general hospital; MC: medical center; NH: national hospital; PEGEN-BC: The Peruvian Genetics and Genomics of Breast Cancer Study; PH: public hospital; SH: state hospital; UNACON: Unidades de Alta Complexidade em Oncologia (High Complexity Care Units in Oncology); UTH: university hospital; NOS: Newcastle-Ottawa Scale; SEA: South-East Asia; SA: South America. | ||||||||
| Arnetha et al, 2020 [15] | Indonesia | Bandung | January 2011 - September 2011 | Hasan Sadikin GH | 63 | 48.79 (mean) | 8 | SEA |
| Azhar et al, 2020 [16] | 2014 - 2018 | 913 | 42.4 ± 18.6 | 7 | ||||
| Juristiasa et al, 2022 [17] | Denpasar | January 2015 - June 2020 | Sanglah GH | 100 | 52.36 ± 1.21 | 7 | ||
| Felicia et al, 2022 [18] | Jakarta | January 2015 - December 2020 | Dr. Cipto Mangunkusumo NH | |||||
| Gondhowiardjo et al, 2020 [19] | 2001 - 2010 | 933 | 33.7% 41 - 50 | 8 | ||||
| Gultom et al, 2021 [20] | September 2019 | Siloam Semanggi H | 208 | 34.1% 50 - 59 | 6 | |||
| Madyaningtias, 2021 [21] | Makassar | July 2014 - June 2017 | Tertiary hospitals | 365 | 38.1% 41 - 50 | 5 | ||
| Wijayanto et al, 2022 [22] | 2016 - 2019 | Dr. W. Sudirohusodo GH | 172 | 31.4% 50 - 59 | 7 | |||
| Furqan et al, 2020 [23] | Medan | 2016 - 2018 | Haji Adam Malik GH | 131 | 46.41 ± 9.90 | 5 | ||
| Arza et al, 2022 [24] | Padang | 2020 - 2022 | Dr. M. Djamil GH | 68 | 91.2% > 40 | 5 | ||
| Dasman et al, 2021 [25] | 2017 - 2018 | Dr. M. Djamil GH, YARSI H, and Ropanasuri SH | 418 | 54.1% > 50 | 6 | |||
| Paramita et al, 2019 [26] | Samarinda | January 2016 - December 2016 | A.W. Sjahranie GH | 92 | 48.3 ± 10.7 | 5 | ||
| Anwar et al, 2019 [27] | Yogyakarta | 2012 - 2017 | Dr. Sardjito GH | 144 | 37 (median) | 7 | ||
| Fathoni et al, 2022 [28] | July 2018 June 2019 | 162 | 52.57 ± 9.35 | 8 | ||||
| Widodo et al, 2014 [29] | 2008 - 2009 | 84 | 53.15 ± 10.89 | 6 | ||||
| Luangxay et al, 2019 [30] | Laos | Vientiane | 2013 - 2016 | University of Health Science | 76 | 49.1 ± 10.9 | 6 | |
| Sung et al, 2020 [31] | Malaysia | Sarawak | 2003 - 2015 | Sarawak GH | 2,994 | 51.6 ± 11.1 | 7 | |
| Abdullah et al, 2016 [32] | Subang Jaya | 2008 - 2012 | Subang Jaya MC | 675 | 53.0 ± 11.0 | 8 | ||
| San et al, 2017 [33] | Myanmar | Myeik and Yangon | January 2015 - December 2015 | Myeik and Sakura | 91 | 51.3 (mean) | 6 | |
| Chuangsuwanich et al, 2014 [34] | Thailand | Bangkok | 2002 - 2004 | Siriraj H | 100 | 51 (mean) | 8 | |
| Laohanvinij et al, 2017 [35] | January 2015 - December 2013 | Rajavithi H | 232 | 51.5 (28 - 88) | 7 | |||
| Ditsatham et al, 2022 [36] | Chiang Mai | January 2006 - December 2015 | Chiang Mai UTH | 3,153 | 64.5% 40 - 60 | 8 | ||
| Sripan et al, 2019 [37] | 2004 - 2013 | Maharaj Nakorn Chiang Mai H | 3,228 | 45 (52 - 60) | 8 | |||
| Kongsiang et al, 2014 [38] | Khon Kaen | January 1999 - May 2009 | Srinagarind H | 272 | 44.9 ± 55.1 | 7 | ||
| Sukpan et al, 2023 [39] | Narathiwat | June 2016 - May 2021 | Naradhiwas Rajanagarindra H | 234 | 52.6 ± 12.0 | 8 | ||
| Tubtimhin et al, 2018 [40] | Ubon Ratchthani | January 2022 - December 2016 | Ubon Ratchathani CH | 523 | 49.6 ± 9.8 | 8 | ||
| Nguyen et al, 2019 [41] | Vietnam | Hanoi | 2011 - 2013 | National CH | 501 | 50 (median) | 8 | |
| Cong et al, 2020 [42] | Hue | June 2016 - August 2018 | Hue UTH | 237 | 54.7 ± 12.66 | 9 | ||
| Path et al, 2016 [43] | Argentina | Whole Argentina | January 2012 - December 2013 | Multicenter | 1,732 | 59 (23 - 92) | 9 | SA |
| Goncalves, 2018 [44] | Brazil | Juiz de Fora | 2003 - 2005 | Private Referral Center for Cancer Care | 447 | 57.0 ± 13.0 | 9 | |
| Fayer et al, 2016 [45] | January 2000 - December 2018 | UNACON | 195 | 57.8 (mean) | 8 | |||
| Reis et al, 2020 [46] | Maranhao | January 2015 - December 2018 | 137 | 52.1 ± 11.8 | 9 | |||
| Freitas et al, 2022 [47] | Minas Gerais | 2014 - 2016 | Oncology Referral Center | 430 | 42 (low-risk) and 63 (high-risk) | 8 | ||
| Macedo Andrade et al, 2014 [48] | Paraiba | March 2013 - November 2013 | Fundação de Assistência da Paraíba PH | 269 | 55.4 ± 0.8 | 7 | ||
| Jeronimo et al, 2017 [49] | Paraiba and Joao | 2013 - 2016 | Fundação de Assistência | 236 | 55.1 ± 12.3 | 9 | ||
| da Paraíba PH and Hospital Napoleao Laureano | ||||||||
| Simon et al, 2019 [50] | Whole Brazil | 2001 - 2006 | 28 Brazilian Institutions | 2,296 | 54.0 (mean) | 6 | ||
| Carvalho et al, 2014 [51] | July 2009 - March 2011 | Consultoria em Patologia | 5,687 | 55.5 ± 13.5 | 7 | |||
| Acevedo et al, 2020 [52] | Chile | Santiago | January 2009 - December 2019 | Servicio de Salud Metropolitano Suroriente | 439 | 51.7 (23 - 79) | 7 | |
| Merino et al, 2018 [53] | 1997 - 2006 | Pontificia Universidad Catolica de Chile and Red de Salud UC Christus | 2,198 | 55 (19 - 101) | 6 | |||
| Gomez et al, 2015 [54] | Colombia | Bogota | January 2009 - December 2011 | Instituto de Cancerologia-Clinicas Las Americas | 328 | 52.9 ± 11.3 | 7 | |
| Serrano-Gomez et al, 2016 [55] | Bogota and Bolicar | 2008 - 2012 | Colombian National Cancer Institute and Hospital Universitario del Caribe | 301 | 56.6 (mean) | 8 | ||
| Aldaz-Roldan et al, 2023 [56] | Ecuador | Loja | 2009 - 2019 | SOLCA Nucleo de Loja | 268 | 54.6 (mean) | 6 | |
| Bueno et al, 2017 [57] | Peru | Arequipa | January 2009 - December 2012 | Hospital Nacional Carlos Alberto Seguín Escobedo | 280 | 56 (27 - 91) | ||
| Galvez et al, 2018 [58] | Surquillo | 2003 - 2014 | Instituto Nacional de Enfermedades Neoplasicas | 435 | 49 (24 - 84) | 6 | ||
| Zavala et al, 2023 [59] | Whole Peru | 2010 - 2022 | PEGEN-BC | 1943 | 49.8 ± 11.0 | 9 | ||
| Yabar et al, 2017 [60] | Peru and Uruguay | Lima and Montevidio | 2012 - 2013 | Hospital Nacional Edgardo Rebagliatti Martins, Hospital Nacional Guillermo Almenara Irigoyen, Hospital Nacional Alberto Sabogal, Instituto Nacional de Cancer | 580 | 58 (27 - 90) | 7 | |