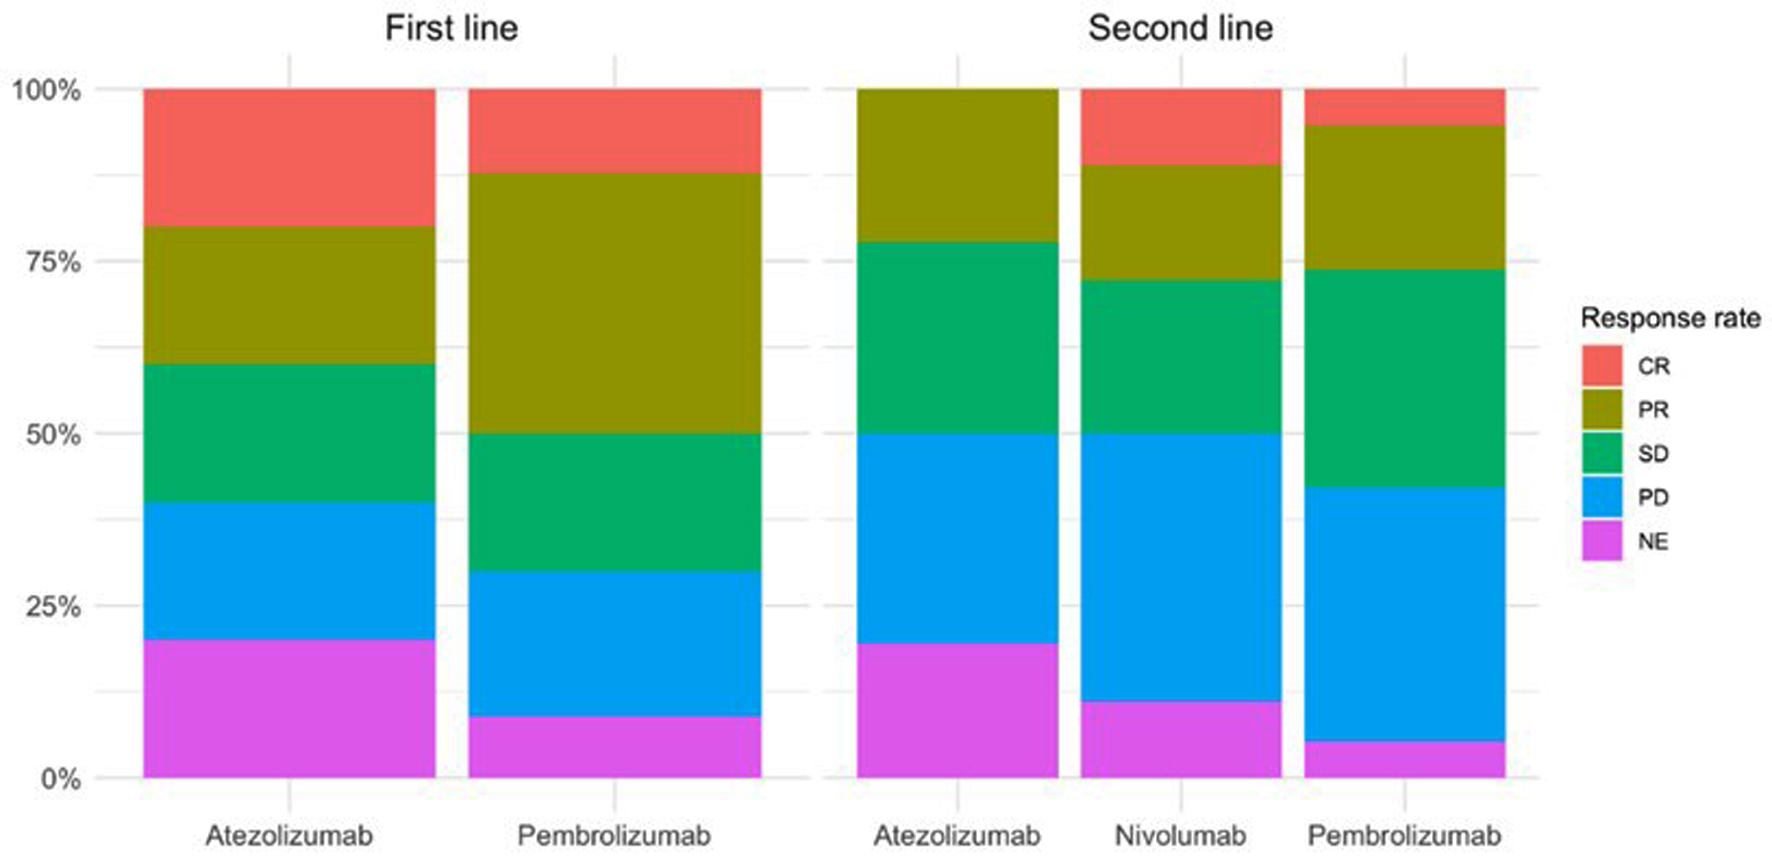
Figure 1. Disease response rate according to appearance of irAEs for patients with first- and second-line treatment. irAEs: immune-related adverse events.
| World Journal of Oncology, ISSN 1920-4531 print, 1920-454X online, Open Access |
| Article copyright, the authors; Journal compilation copyright, World J Oncol and Elmer Press Inc |
| Journal website https://www.wjon.org |
Original Article
Volume 15, Number 2, April 2024, pages 223-238
Predictors of Immunotherapy Efficacy in Metastatic Non-Small Cell Lung Cancer: Lung Immune Prognostic Index and Immune-Related Toxicity
Figures
Tables
| All (N = 168) | Good (N = 82) | Intermediate (N = 73) | Poor (N = 13) | P overall | |
|---|---|---|---|---|---|
| Means (standard deviation) for continuous variables and number of cases (%) for categorical variables. Comparisons between groups are made using ANOVA (continuous variables) and Chi-square with Yates correction (categorical variables). ANOVA: analysis of variance; CR: complete response; LDH: lactate dehydrogenase; LIPI: lung immune prognostic index; NE: not evaluated; NLR: neutrophil-to-lymphocyte ratio; PD: progressive disease; PR: partial response; SD: stable disease. | |||||
| Age | 64.3 (9.11) | 66.0 (8.23) | 63.5 (9.59) | 58.2 (8.99) | 0.009 |
| Sex | 0.663 | ||||
| Men | 130 (77.4%) | 65 (79.3%) | 56 (76.7%) | 9 (69.2%) | |
| Female | 38 (22.6%) | 17 (20.7%) | 17 (23.3%) | 4 (30.8%) | |
| Histology | 0.543 | ||||
| Adenocarcinoma | 116 (69%) | 53 (64.6%) | 53 (72.6%) | 10 (76.9%) | |
| Squamous | 52 (31%) | 29 (35.4%) | 20 (27.4%) | 3 (23.1%) | |
| Drug | 0.912 | ||||
| Atezolizumab | 41 (24.4%) | 21 (25.6%) | 18 (24.7%) | 2 (15.4%) | |
| Nivolumab | 18 (10.7%) | 9 (11.0%) | 7 (9.59%) | 2 (15.4%) | |
| Pembrolizumab | 109 (64.9%) | 52 (63.4%) | 48 (65.8%) | 9 (69.2%) | |
| NLR | 2.46 (1.95) | 1.68 (0.60) | 2.68 (1.45) | 6.18 (4.27) | < 0.001 |
| LDH | 244 (132) | 179 (25.8) | 294 (163) | 359 (143) | < 0.001 |
| Response | |||||
| CR | 15 (8.93%) | 10 (12.2%) | 4 (5.48%) | 1 (7.69%) | |
| PR | 5 (29.8%) | 30 (36.6%) | 17 (23.3%) | 3 (23.1%) | |
| SD | 39 (23.2%) | 22 (26.8%) | 15 (20.5%) | 2 (15.4%) | |
| PD | 45 (26.8%) | 12 (14.6%) | 28 (38.4%) | 5 (38.5%) | |
| NE | 19 (11.3%) | 8 (9.76%) | 9 (12.3%) | 2 (15.4%) | |
| Progression | 103 (61.3%) | 46 (56.1%) | 46 (63.0%) | 11 (84.6%) | 0.135 |
| Death | 114 (67.9%) | 46 (56.1%) | 56 (76.7%) | 12 (92.3%) | 0.003 |
| Alive | 54 (32.1%) | 36 (43.9%) | 17 (23.2%) | 1 (7.7%) | |
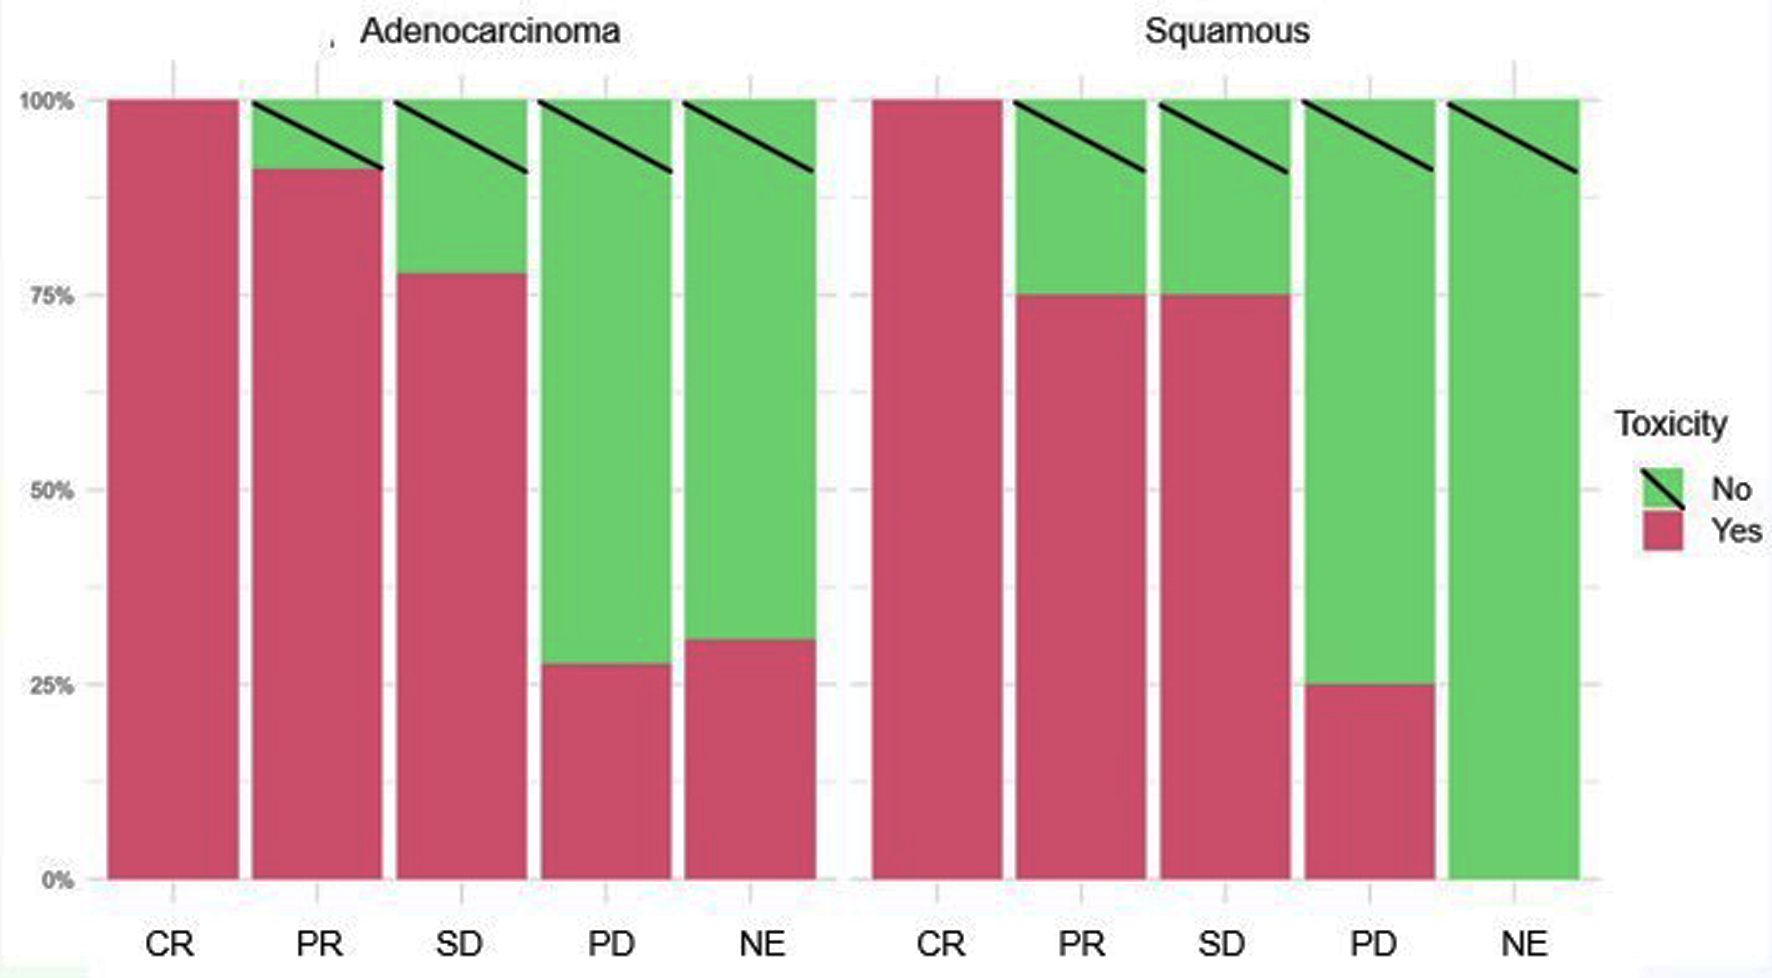
| Histology | Toxicity | Re-evaluation | ||||
|---|---|---|---|---|---|---|
| CR | PR | SE | PD | NE | ||
| CR: complete response; irAEs: immune-related adverse events; NE: not evaluated; PD: progressive disease; PR: partial response; SD: stable disease. | ||||||
| Adenocarcinoma | Yes (77) | 13 | 31 | 21 | 8 | 4 |
| No (39) | 0 | 3 | 6 | 21 | 9 | |
| Squamous | Yes (27) | 2 | 12 | 9 | 4 | 0 |
| No (25) | 0 | 4 | 3 | 12 | 6 | |
| First-line | Second-line | |||||
|---|---|---|---|---|---|---|
| No toxicity (N = 33) | Toxicity (N = 62) | P overall | No toxicity (N = 31) | Toxicity (N = 42) | P overall | |
| CR: complete response; irAEs: immune-related adverse events; NE: not evaluated; PD: progressive disease; PR: partial response; SD: stable disease. | ||||||
| Response rate | < 0.001 | < 0.001 | ||||
| CR | 0 (0.00%) | 12 (100%) | 0 (0.00%) | 3 (100%) | ||
| PR | 5 (14.3%) | 30 (85.7%) | 2 (13.3%) | 13 (86.7%) | ||
| SD | 5 (26.3%) | 14 (73.7%) | 4 (20.0%) | 16 (80.0%) | ||
| PD | 17 (85.0%) | 3 (15.0%) | 16 (64.0%) | 9 (36.0%) | ||
| NE | 6 (66.7%) | 3 (33.3%) | 9 (90.0%) | 1 (10.0%) | ||
| All (N = 168) | Good (N = 82) | Intermediate (N = 73) | Poor (N = 13) | P overall | |
|---|---|---|---|---|---|
| irAEs: immune-related adverse events; LIPI: lung immune prognostic index. | |||||
| Toxicity | 104 (61.9%) | 61 (74.4%) | 36 (49.3%) | 7 (53.8%) | 0.004 |
| Dermatological | |||||
| No | 142 (84.5%) | 69 (84.1%) | 62 (84.9%) | 11 (84.6%) | 1.000 |
| Yes | 26 (15.5%) | 13 (15.9) | 11 (15.1%) | 2 (15.4%) | 1.000 |
| Gastrointestinal | |||||
| No | 126 (75.0%) | 61 (74.4%) | 55 (75.3%) | 10 (76.9%) | 1.000 |
| Yes | 42 (25.0%) | 21 (25.6%) | 18 (24.7%) | 3 (23.1%) | 1.000 |
| Lung | |||||
| No | 152 (90.5%) | 72 (87.8%) | 68 (93.2%) | 12 (92.3%) | 0.520 |
| Yes | 16 (9.5%) | 10 (12.2%) | 5 (6.85%) | 1 (7.7%) | 0.520 |
| Endocrine | |||||
| No | 111 (66.1%) | 51 (62.2%) | 52 (71.2%) | 8 (61.5%) | 0.457 |
| Yes | 57 (33.9%) | 31 (37.8%) | 21 (28.8%) | 5 (38.5%) | 0.457 |
| Musculoeskeletal | |||||
| No | 147 (87.5%) | 71 (86.6%) | 64 (87.7%) | 12 (92.3%) | 1.000 |
| Yes | 21 (12.5%) | 11 (13.4%) | 9 (12.3%) | 1 (7.69%) | 1.000 |
| Renal | |||||
| No | 159 (94.6%) | 77 (93.9%) | 69 (94.5%) | 13 (100%) | 1.000 |
| Yes | 9 (5.4%) | 5 (6.1%) | 4 (5.5%) | 0 (0%) | 1.000 |
| Neurological | |||||
| No | 163 (97.0%) | 79 (96.3%) | 72 (98.6%) | 12 (92.3%) | 0.267 |
| Yes | 5 (3%) | 3 (3.7%) | 1 (1.4%) | 1 (7.7%) | 0.267 |
| Hematological | |||||
| No | 161 (96.4%) | 75 (92.6%) | 73 (100%) | 13 (100%) | 0.039 |
| Yes | 6 (3.6%) | 6 (7.4%) | 0 (0%) | 0 (0%) | 0.039 |
| Cardiovascular | |||||
| No | 161 (95.8%) | 76 (92.7%) | 72 (98.6%) | 13 (100%) | 0.196 |
| Yes | 7 (4.2%) | 6 (7.3%) | 1 (1.4%) | 0 (0%) | 0.196 |
| Ophthalmological | |||||
| No | 159 (94.6%) | 79 (96.3%) | 68 (93.2%) | 12 (92.3%) | 0.473 |
| Yes | 9 (5.4%) | 3 (3.7%) | 5 (6.8%) | 1 (7.3%) | 0.473 |