World Journal of Oncology, ISSN 1920-4531 print, 1920-454X online, Open Access
Article copyright, the authors; Journal compilation copyright, World J Oncol and Elmer Press Inc
Journal website https://www.wjon.org

Original Article

Volume 15, Number 2, April 2024, pages 287-297


Lipid Profiles Impact on the Oncologic Outcome of Upper Tract Urothelial Carcinoma

Figures

Figure 1.
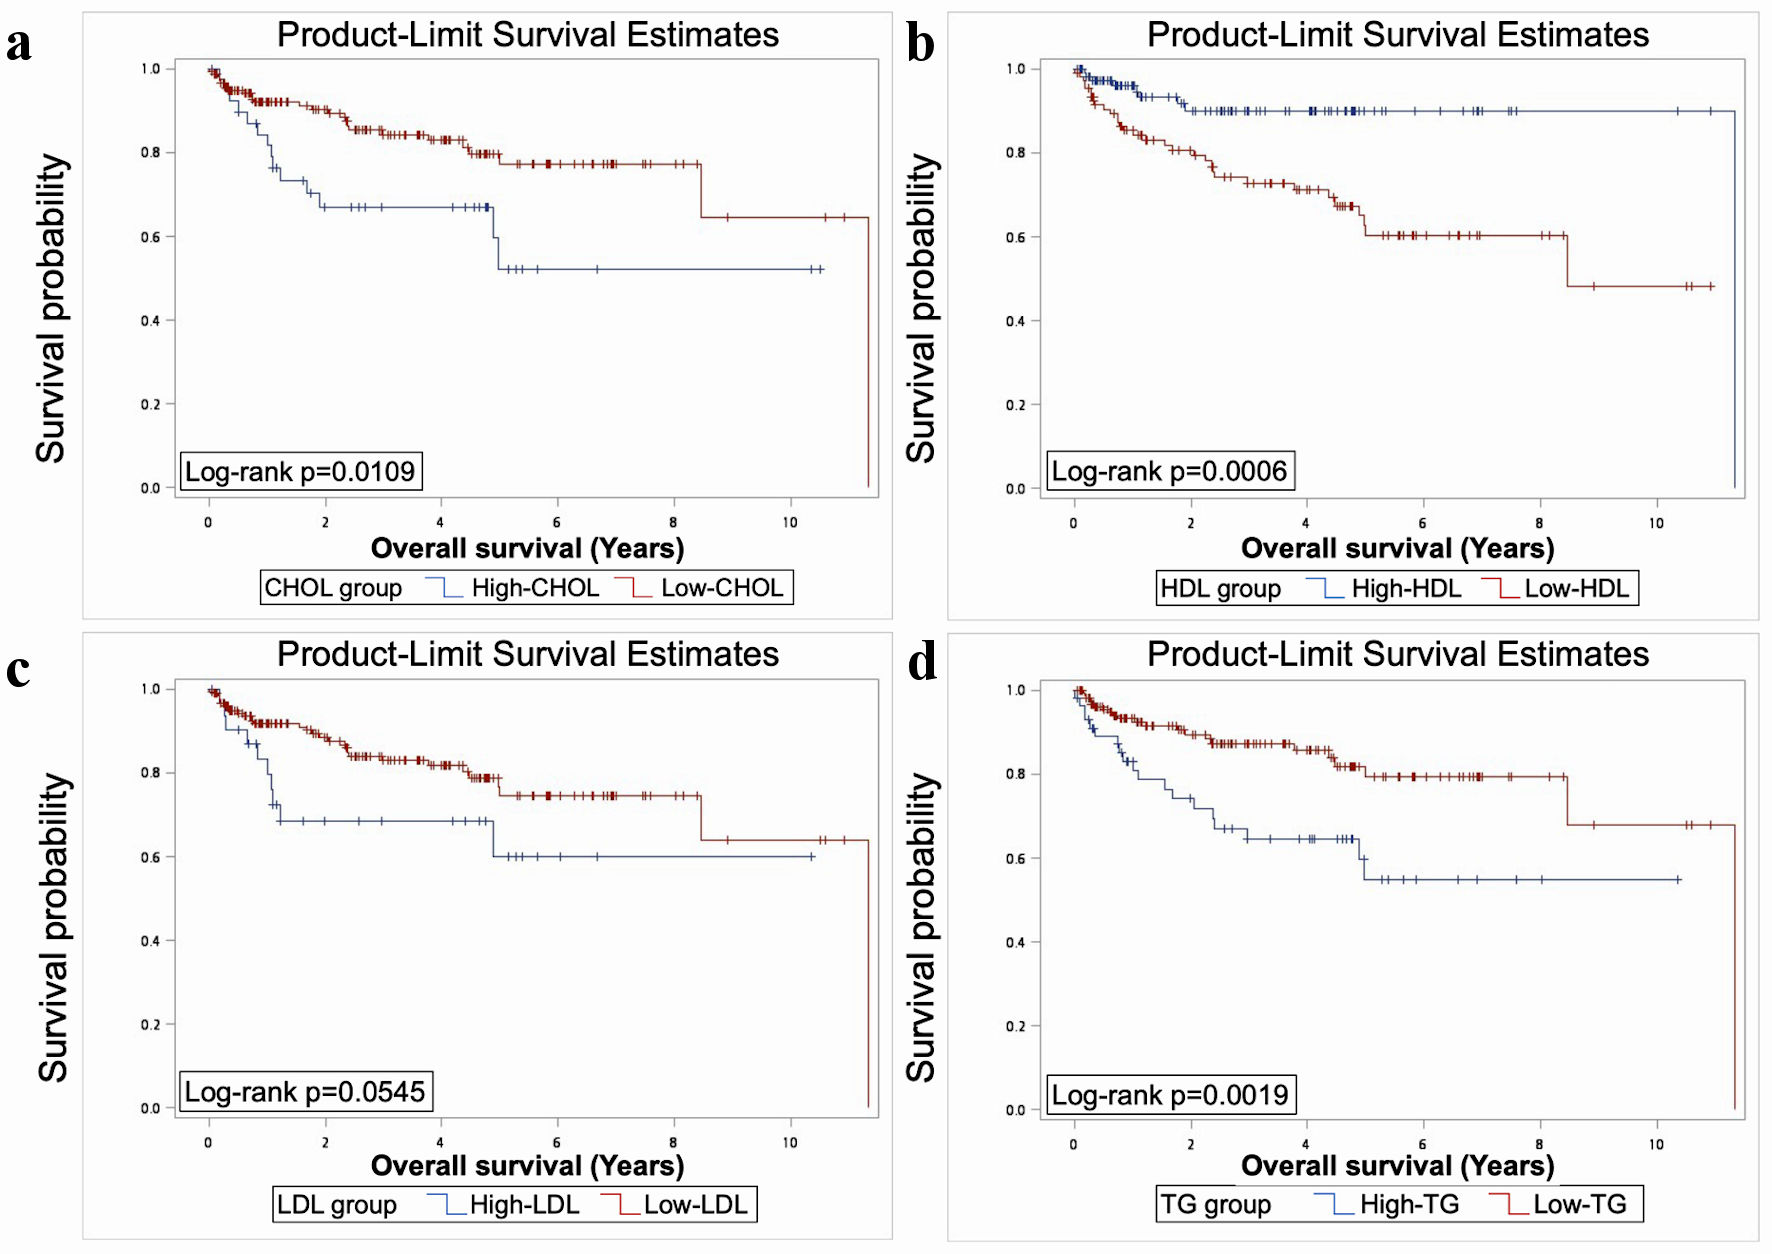
Figure 1. Elevated TG, CHOL, and reduced HDL had significant worse OS as revealed by Kaplan-Meier analysis and log-rank test (P < 0.05). TG: triacylglycerol; CHOL: cholesterol; HDL: high-density lipoprotein; LDL: low-density lipoprotein; OS: overall survival.
Figure 2.
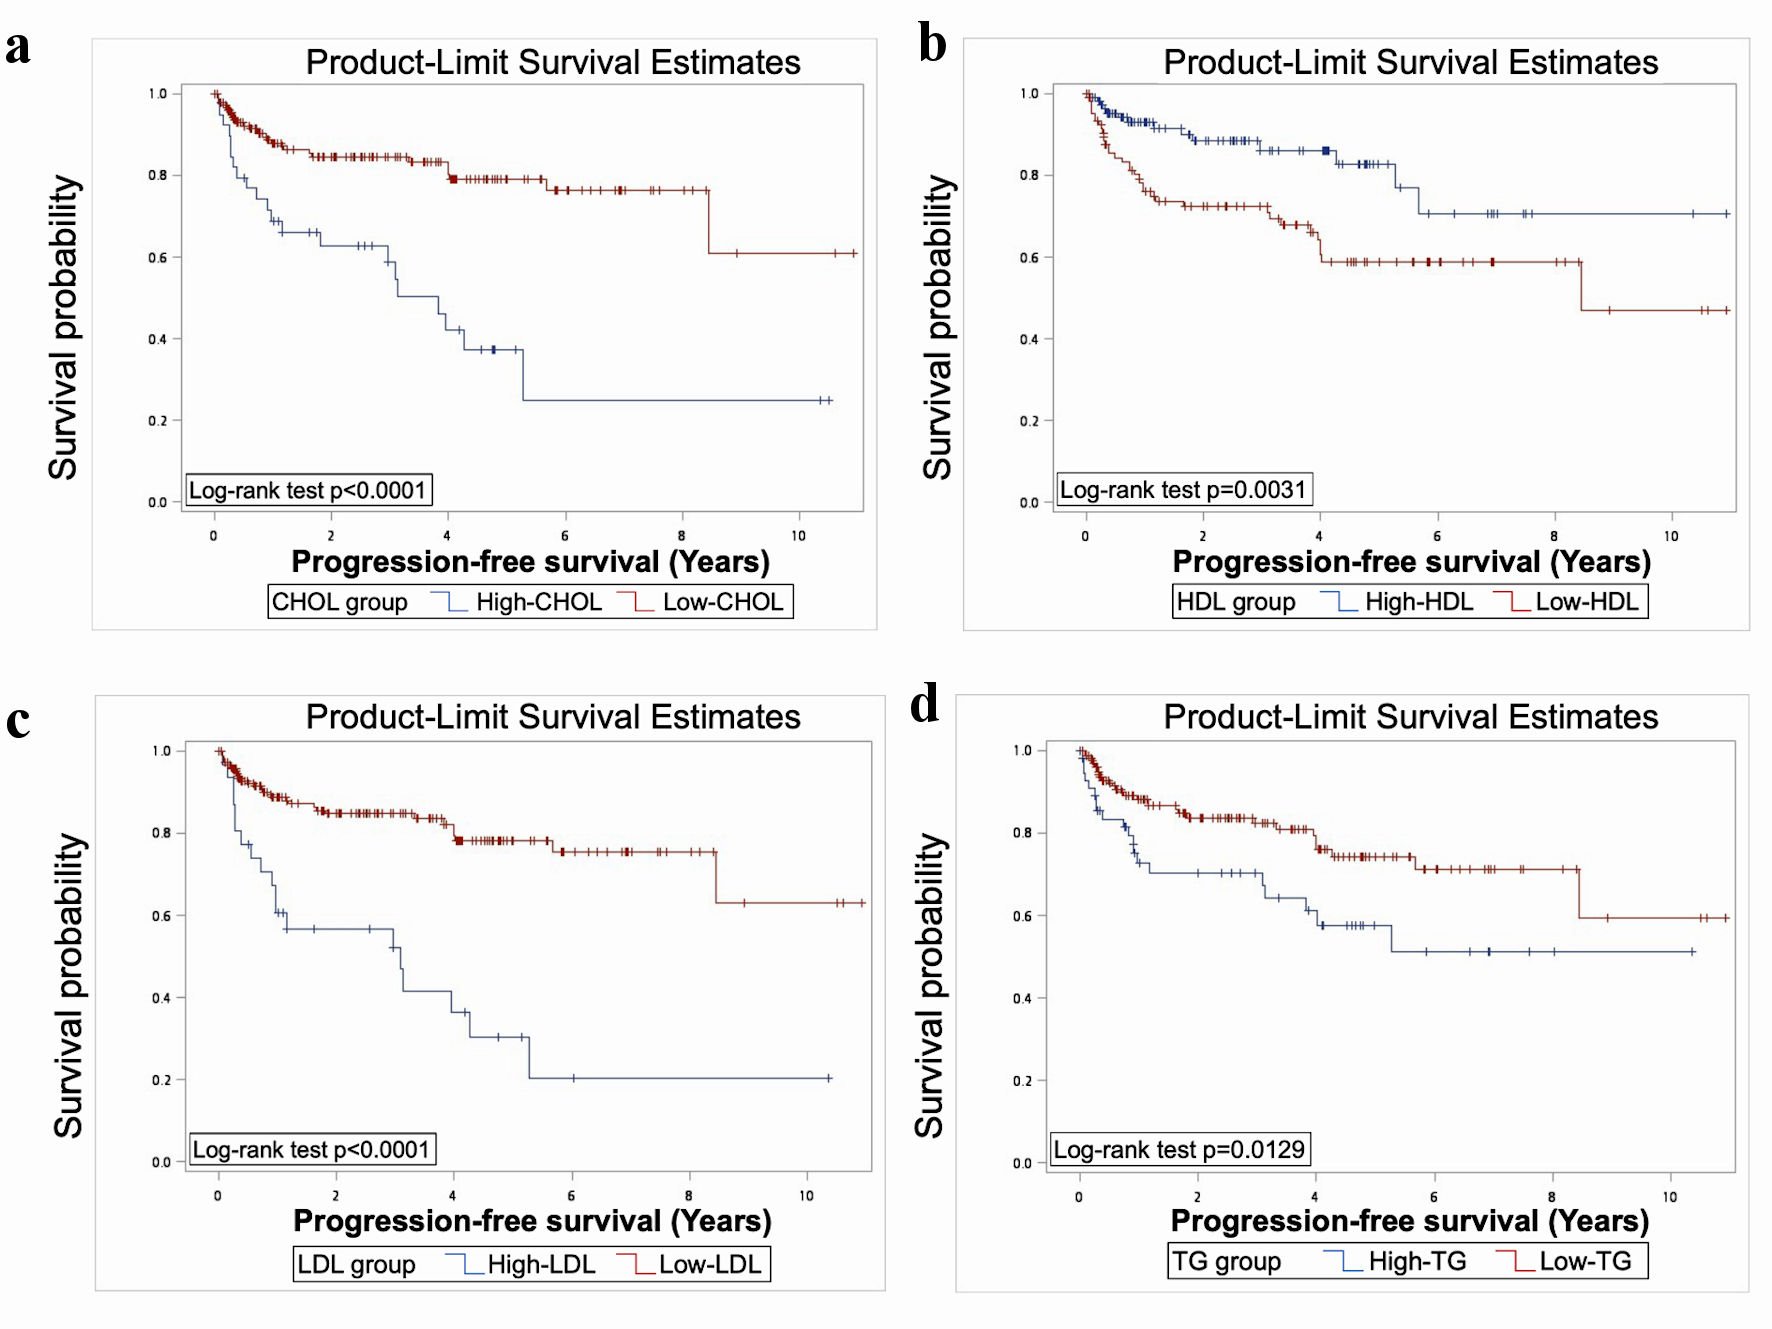
Figure 2. Elevated CHOL, LDL, TG and reduced HDL were associated with significantly worse PFS, as indicated by Kaplan-Meier analysis and log-rank test (P < 0.05). TG: triacylglycerol; CHOL: cholesterol; HDL: high-density lipoprotein; LDL: low-density lipoprotein; PFS: progression-free survival.
Figure 3.
Figure 3. The Kaplan-Meier analysis and log rank test showed significantly worse CSS in elevated TG and CHOL (P < 0.05). TG: triacylglycerol; CHOL: cholesterol; HDL: high-density lipoprotein; LDL: low-density lipoprotein; CSS: cancer-specific survival.

Tables

Table 1. Clinical Characteristic of UTUC Patients Receiving RNU
 
VariablesNumber of patients (%) (n = 217)Median (Q1 - Q3)
RNU: radical nephroureterectomy; UTUC: upper tract urothelial carcinoma; BMI: body mass index; CCI: Charlson Comorbidity Index; DM: diabetes mellitus; CHOL: cholesterol; HDL: high-density lipoprotein; LDL: low-density lipoprotein; TG: triacylglycerol.
Age71 (63 - 76)
Gender
  Male98 (45.16)
  Female119 (54.84)
BMI24.3 (21.92 - 26.93)
CCI5 (4 - 6)
Smoking
  Yes37 (17.05)
  No180 (82.95)
DM
  Yes83 (38.25)
  No134 (61.75)
Hypertension
  Yes177 (81.57)
  No40 (18.43)
Grade
  Low25 (11.52)
  High192 (88.48)
T stage
  Tis/Ta/T1106 (48.85)
  T2/T3/T4111 (51.15)
Nodal status
  N0/Nx207 (95.39)
  N1/N210 (4.61)
Initial metastasis
  Yes5 (2.3)
  No212 (97.7)
Multifocality
  Yes34 (15.67)
  No183 (84.33)
Size
  < 3cm97 (44.7)
  ≥ 3cm120 (55.3)
Squamous differentiation
  Yes5 (2.3)
  No212 (97.7)
Free resection margin
  Yes208 (95.85)
  No9 (4.15)
Adjuvant therapy
  Yes44 (20.28)
  No173 (79.72)
CHOL170 (144 - 193)
  < 200177 (81.57)
  ≥ 20040 (18.43)
HDL43.8 (35.7 - 56.4)
  < 40 (men), < 50 (female)107 (49.31)
  ≥ 40 (men), ≥ 50 (female)110 (50.69)
LDL93.6 (75.3 - 114)
  < 130185 (85.25)
  ≥ 13032 (14.75)
TG103 (78 - 150)
  < 150162 (74.65)
  ≥ 15055 (25.35)


Table 2. Oncologic Outcomes of UTUC Patients Receiving RNU
 
VariablesNumber of patients (%)
UTUC: upper tract urothelial carcinoma; RNU: radical nephroureterectomy.
Total217
Progression
  Yes51 (23.5%)
  No166 (76.5%)
Died of disease
  Yes16 (7.37%)
  No201 (92.63%)
All-caused death
  Yes41 (18.89%)
  No176 (81.11%)


Table 3. Univariate and Multivariate Standard Cox Regression Analysis
 
VariablesOSPFSCSS
UnivariateMultivariateUnivariateMultivariateUnivariateMultivariate
cHRP valueaHRP valuecHRP valueaHRP valuecHRP valueaHRP value
Ref: reference; cHR: crude hazard ratio; aHR: adjusted hazard ratio; OS: overall survival; PFS: progression-free survival; CSS: cancer-specific survival: BMI: body mass index: CCI: Charlson Comorbidity Index; DM: diabetes mellitus
Age1.052 (1.015 - 1.091)0.00561.067 (1.012 - 1.124)0.01581.018 (0.99 - 1.047)0.20341.046 (1.01 - 1.084)0.01121.051 (0.991 - 1.115)0.09671.093 (0.984 - 1.215)0.0968
Male (Ref: female)2.728 (1.404 - 5.302)0.00313.437 (1.476 - 8.001)0.00422.316 (1.307 - 4.102)0.0042.727 (1.401 - 5.308)0.00323.626 (1.144 - 11.489)0.02865.893 (1.094 - 31.758)0.039
BMI0.959 (0.886 - 1.037)0.29080.978 (0.89 - 1.074)0.64290.937 (0.873 - 1.005)0.06840.956 (0.885 - 1.033)0.25290.914 (0.797 - 1.047)0.19420.828 (0.648 - 1.058)0.1311
CCI1.18 (1.025 - 1.359)0.02111.035 (0.848 - 1.264)0.73440.996 (0.865 - 1.145)0.95030.92 (0.765 - 1.105)0.36991.221 (0.984 - 1.514)0.06911.008 (0.724 - 1.404)0.9616
Smoking (Ref: no)2.121 (1.078 - 4.172)0.02941.077 (0.416 - 2.79)0.87921.583 (0.826 - 3.03)0.1660.685 (0.294 - 1.593)0.37911.81 (0.576 - 5.69)0.30981.703 (0.348 - 8.32)0.5108
DM (Ref: no)0.798 (0.411 - 1.55)0.50540.835 (0.385 - 1.811)0.64780.701 (0.383 - 1.282)0.24881.087 (0.546 - 2.165)0.81271.167 (0.411 - 3.314)0.77131.819 (0.38 - 8.716)0.4542
Hypertension (Ref: no)1.675 (0.656 - 4.278)0.28092.337 (0.841 - 6.496)0.10370.489 (0.27 - 0.883)0.01770.611 (0.313 - 1.194)0.1495----
High grade (Ref: low grade)3.325 (0.799 - 13.833)0.09852.304 (0.499 - 10.648)0.28512.07 (0.743 - 5.764)0.16390.954 (0.311 - 2.924)0.93452.099 (0.274 - 16.081)0.47561.344 (0.13 - 13.881)0.8039
≥ pT2 stage (Ref: pTis/pTa/pT1)2.872 (1.432 - 5.761)0.0032.473 (1.08 - 5.666)0.03233.119 (1.682 - 5.784)0.00032.455 (1.149 - 5.242)0.02034.035 (1.135 - 14.344)0.03114.426 (0.871 - 22.49)0.0729
pN1/pN2 (Ref: pN0/pNx)9.16 (4.094 - 20.498)< 0.00012.612 (0.803 - 8.496)0.11056.722 (2.954 - 15.297)< 0.00011.461 (0.466 - 4.584)0.51597.974 (2.182 - 29.138)0.00171.779 (0.31 - 10.207)0.5184
Metastasis (Ref: no)4.951 (1.735 - 14.133)0.00281.47 (0.402 - 5.37)0.56036.005 (2.336 - 15.433)0.00021.641 (0.495 - 5.434)0.41799.822 (2.648 - 36.429)0.000610.144 (1.558 - 66.038)0.0154
Multifocality (Ref: no)1.375 (0.653 - 2.899)0.40221.468 (0.634 - 3.4)0.37071.538 (0.803 - 2.946)0.19412.384 (1.151 - 4.939)0.01931.864 (0.584 - 5.953)0.29314.388 (1.026 - 18.763)0.046
Tumor size ≥ 3 cm (Ref: < 3 cm)3.218 (1.567 - 6.606)0.00152.945 (1.361 - 6.374)0.00613.388 (1.768 - 6.49)0.00023.022 (1.489 - 6.132)0.00221.967 (0.668 - 5.793)0.21950.771 (0.19 - 3.13)0.7157
Squamous differentiation (Ref: no)1.93 (0.263 - 14.191)0.51810.765 (0.093 - 6.278)0.80271.399 (0.192 - 10.209)0.74080.734 (0.093 - 5.808)0.76924.681 (0.605 - 36.2)0.13911.784 (0.145 - 22.013)0.6515
Positive margin (Ref: free)4.445 (1.541 - 12.822)0.00581.684 (0.415 - 6.824)0.46577.535 (3.075 - 18.463)< 0.00011.909 (0.573 - 6.361)0.29258.211 (2.227 - 30.268)0.001611.888 (1.488 - 94.97)0.0195
Adjuvant therapy (Ref: no)2.56 (1.325 - 4.944)0.00511.236 (0.544 - 2.81)0.61294.227 (2.403 - 7.435)< 0.00012.857 (1.369 - 5.963)0.00524.163 (1.455 - 11.916)0.00781.68 (0.423 - 6.669)0.4608


Table 4. Univariate and Multivariate Standard Cox Regression Analysis of Lipid Profiles
 
VariablesOSPFSCSS
UnivariateMultivariateUnivariateMultivariateUnivariateMultivariate
cHRP valueaHRP valuecHRP valueaHRP valuecHRP valueaHRP value
cHR: crude hazard ratio; aHR: adjusted hazard ratio; OS: overall survival; PFS: progression-free survival; CSS: cancer-specific survival; CHOL: cholesterol; HDL: high-density lipoprotein; LDL: low-density lipoprotein; TG: triacylglycerol.
CHOL2.241 (1.169 - 4.294)0.01512.652 (1.175 - 5.984)0.01883.395 (1.938 - 5.948)< 0.00012.916 (1.493 - 5.694)0.00176.286 (2.235 - 17.682)0.00059.97 (2.147 - 46.304)0.0033
Low HDL4.067 (1.797 - 9.208)0.00085.925 (2.323 - 15.11)0.00022.488 (1.343 - 4.609)0.00384.238 (2.043 - 8.791)0.00011.769 (0.603 - 5.19)0.29911.447 (0.311 - 6.728)0.6372
LDL1.966 (0.96 - 4.025)0.06451.788 (0.74 - 4.324)0.19684.112 (2.326 - 7.27)< 0.00013.492 (1.759 - 6.934)0.00043.027 (1.033 - 8.87)0.04351.754 (0.297 - 10.359)0.5354
TG2.689 (1.443 - 5.01)0.00184.322 (2.057 - 9.08)0.00012.05 (1.168 - 3.6)0.01243.014 (1.604 - 5.663)0.00063.594 (1.296 - 9.97)0.0146.342 (1.374 - 29.277)0.0179


Table 5. Competing Risk Analysis of Lipid Profiles
 
VariablesPFSCSS
UnivariateMultivariateUnivariateMultivariate
cHRP valueaHRP valuecHRP valueaHRP value
cHR: crude hazard ratio; aHR: adjusted hazard ratio; PFS: progression-free survival; CSS: cancer-specific survival; CHOL: cholesterol; HDL: high-density lipoprotein; LDL: low-density lipoprotein; TG: triacylglycerol.
CHOL2.657 (1.525 - 4.629)0.00061.89 (0.82 - 4.36)0.13534.815 (1.801 - 12.871)0.001713.248 (1.612 - 108.882)0.0162
Low HDL1.384 (0.749 - 2.556)0.29951.456 (0.702 - 3.018)0.31260.849 (0.304 - 2.377)0.7560.478 (0.079 - 2.883)0.4208
LDL3.334 (1.831 - 6.071)0.00012.479 (1.039 - 5.913)0.04072.48 (0.847 - 7.258)0.09741.67 (0.166 - 16.839)0.6638
TG1.423 (0.828 - 2.448)0.20191.384 (0.72 - 2.659)0.32982.155 (0.823 - 5.642)0.11783.314 (0.968 - 11.352)0.0564