Figures
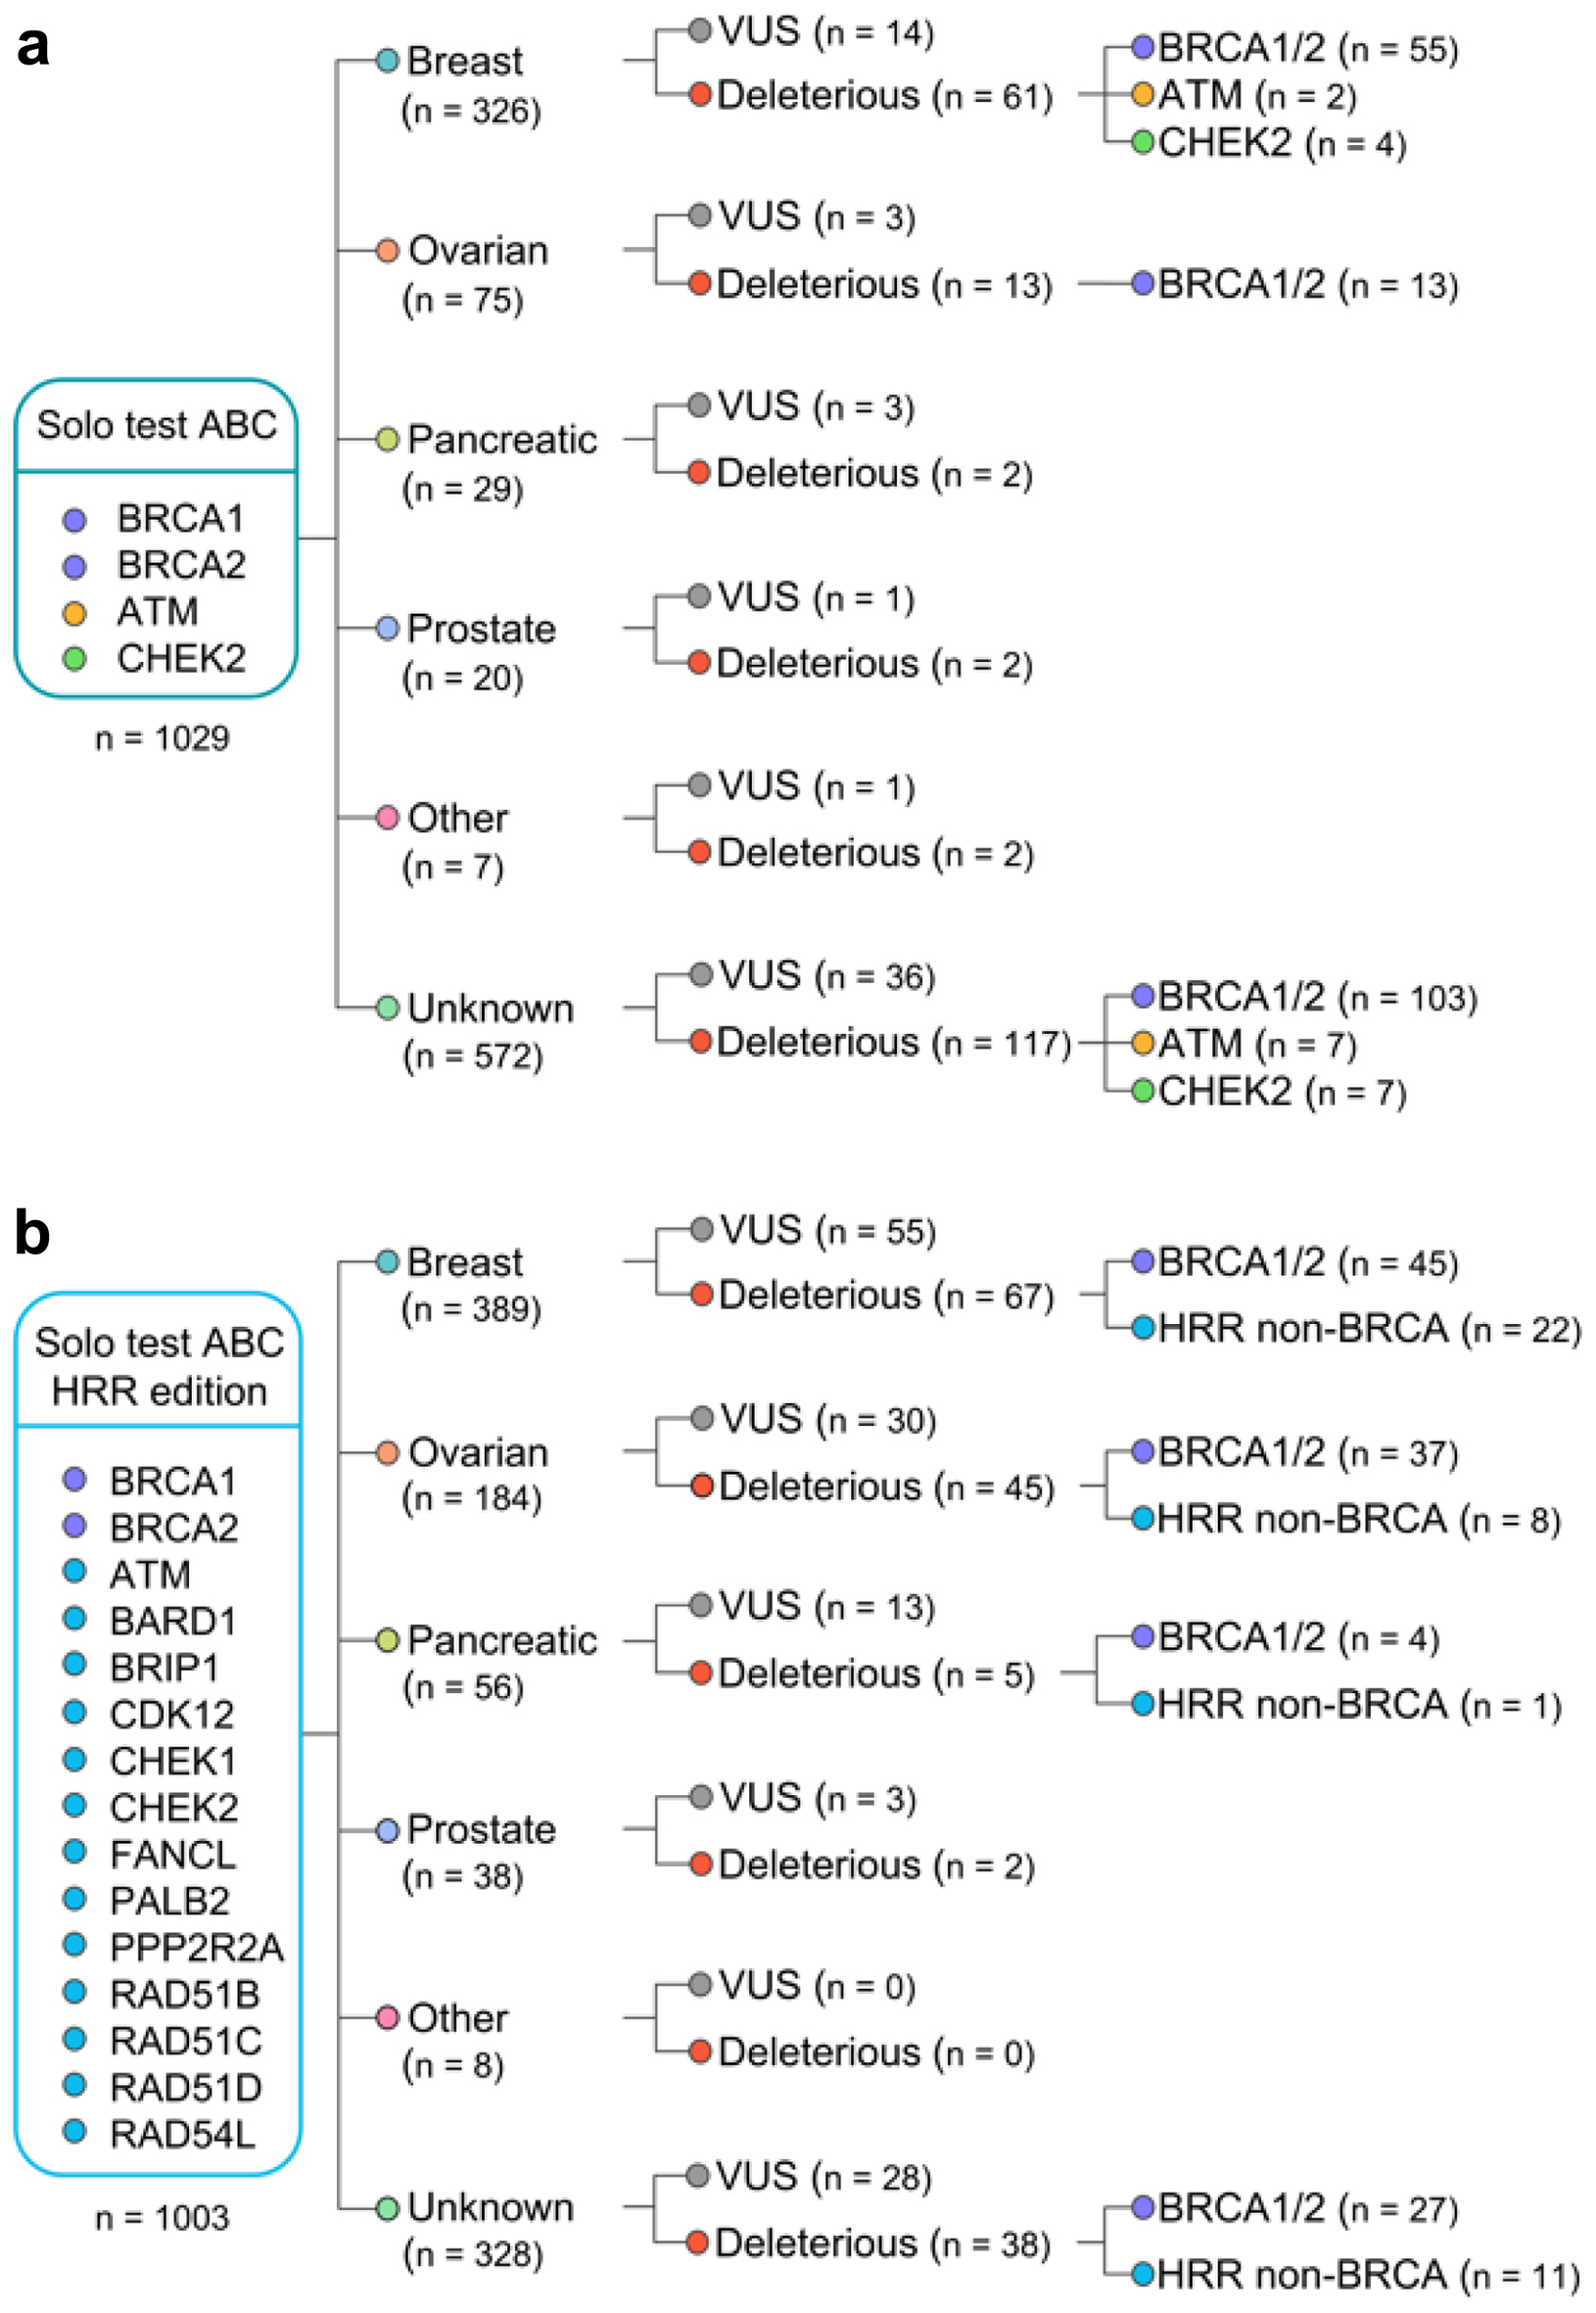
Figure 1. Flow chart with the overview of germline variants identified in the study. Patients were tested with either Solo test ABC (a) or Solo test ABC HRR edition (b). HRR: homologous recombination repair.
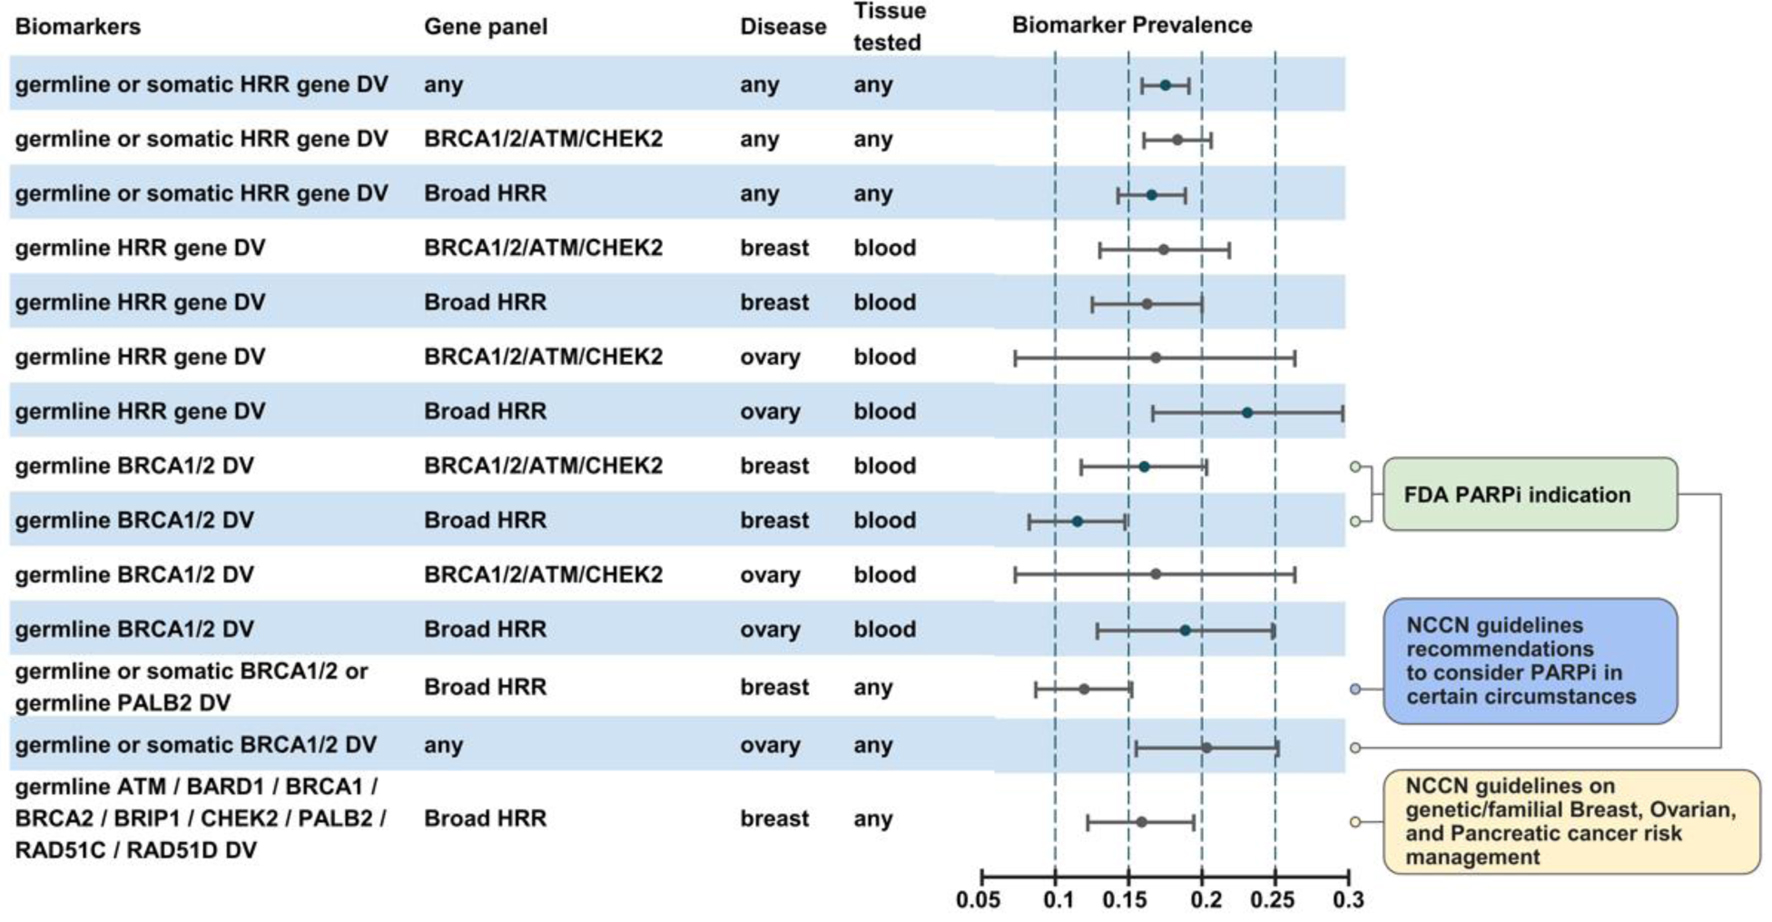
Figure 2. Biomarker prevalence across diverse patient subgroups.
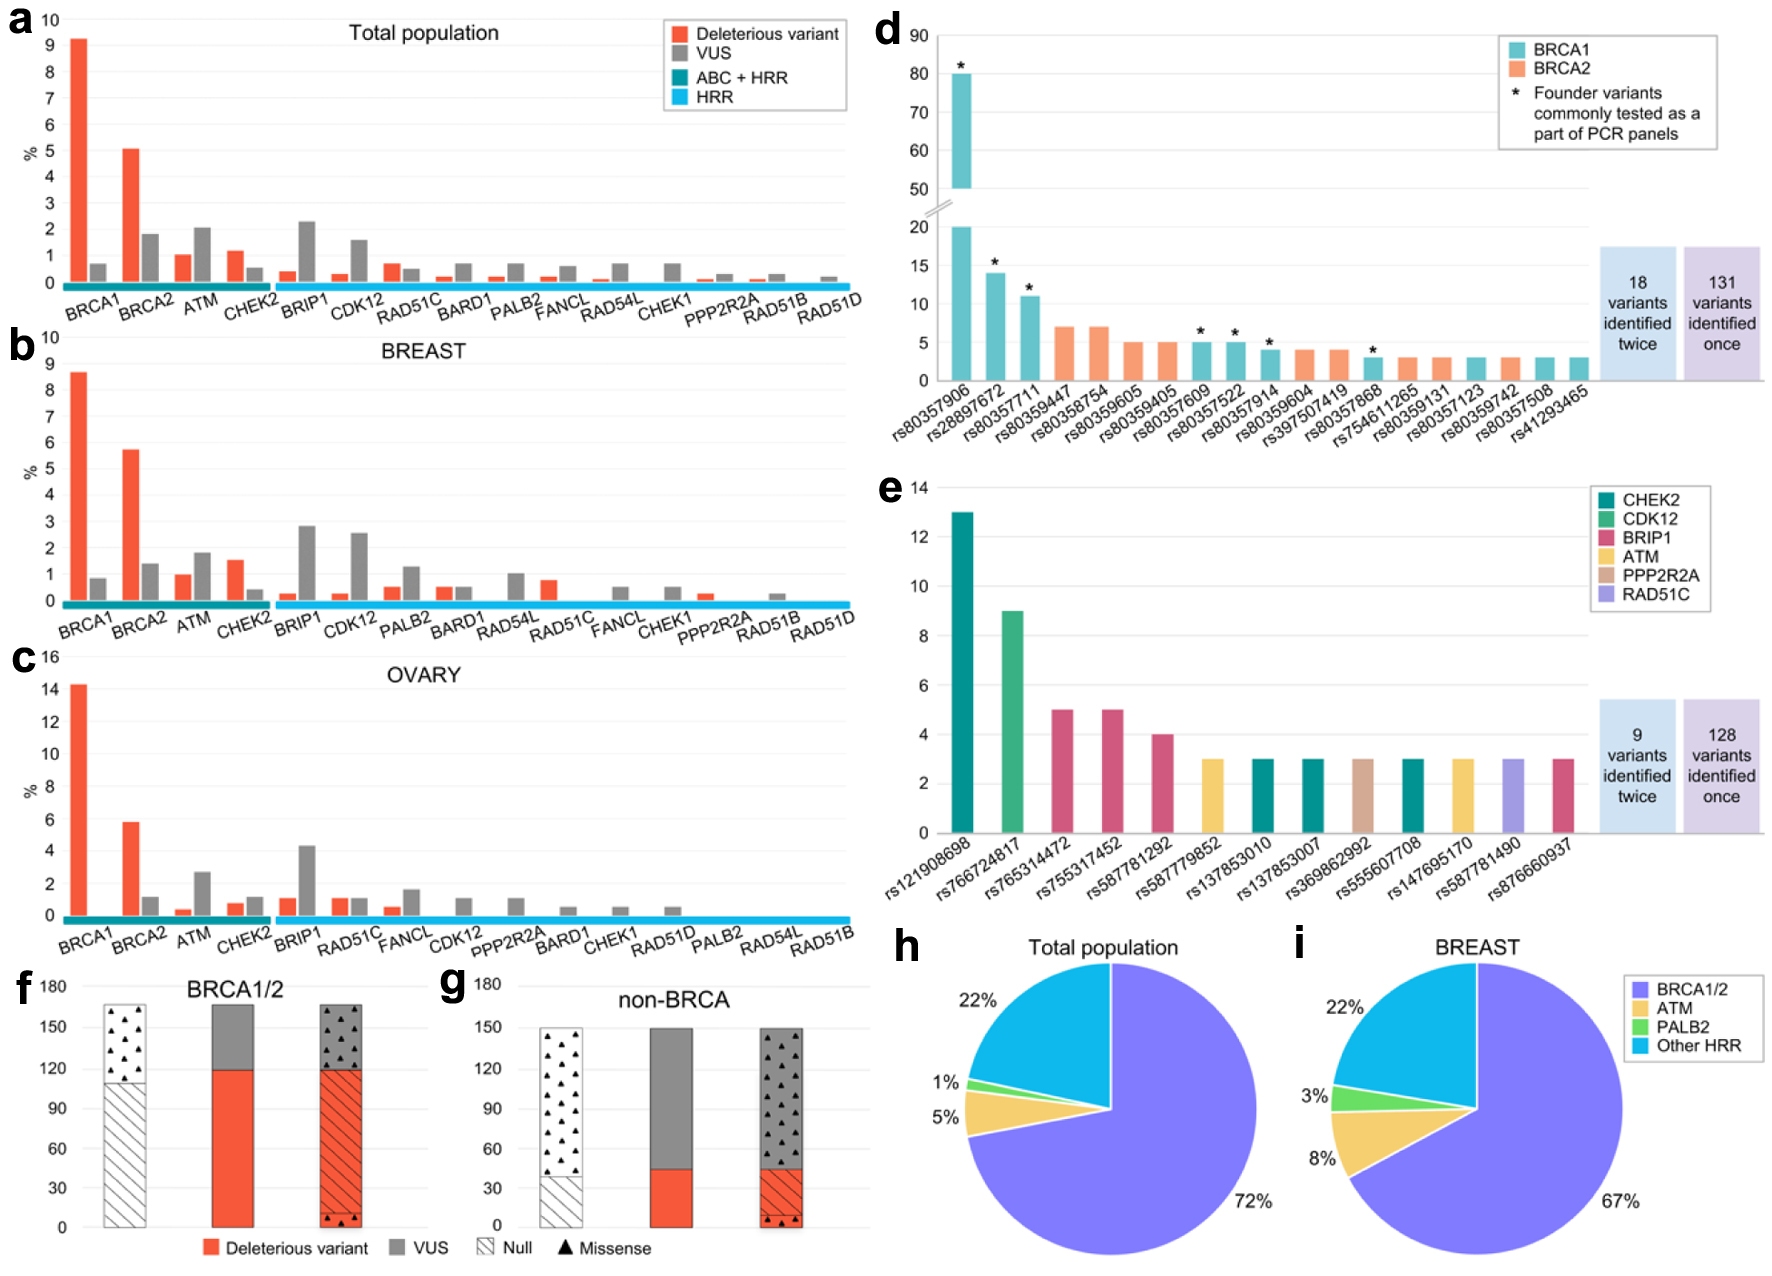
Figure 3. Frequencies of detected germline variants in the analyzed genes. (a-c) Frequencies of DV and VUS variants depending on the gene (a: whole patient population, b: breast cancer patients, c: ovarian cancer patients). (d, e) Frequencies of repetitively identified variants and their distribution by gene (d: BRCA1 and BRCA2, e: non-BRCA1/2). Asterisk indicates variants previously annotated as founder mutations and used to be broadly tested via PCR in Russia. (f, g) Distribution of DV and VUS by type of alteration in BRCA1/2 (f) and non-BRCA (g) genes (null variants comprises nonsense and canonical splice site variants). (h, i) Spectrum of DV in the whole population (h) and across breast cancer patients (i). VUS: variants of uncertain significance; DV: deleterious variants.
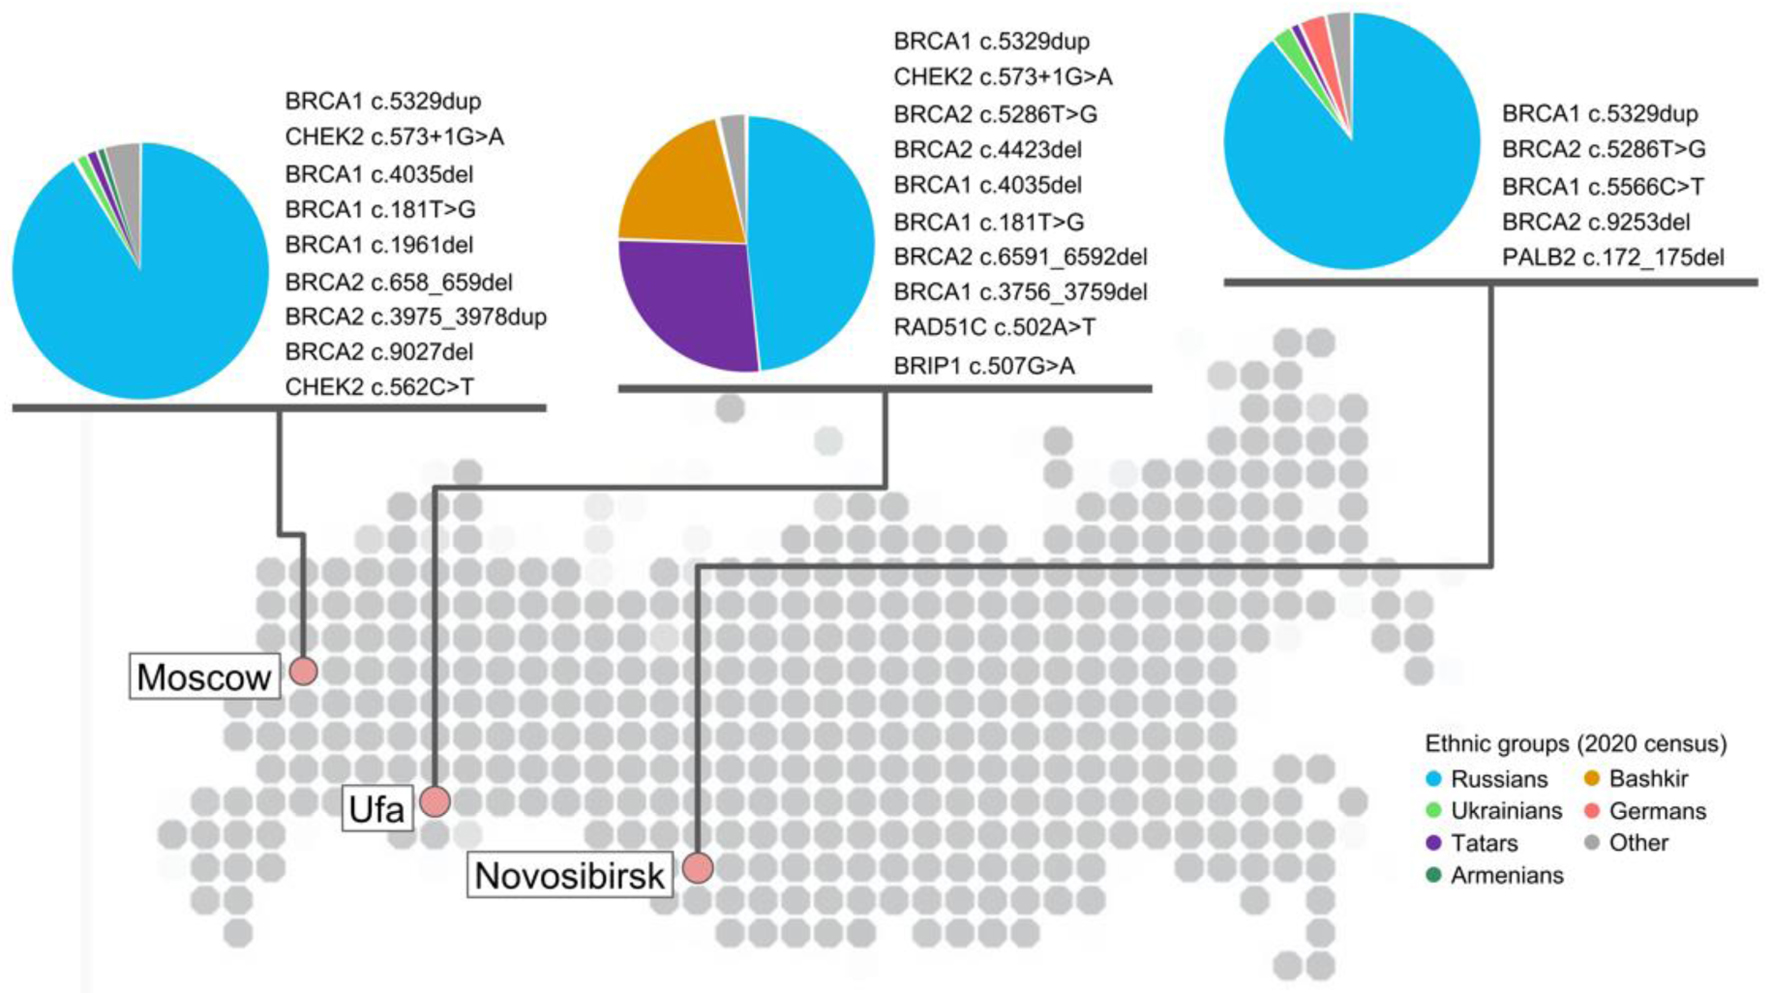
Figure 4. Geographical location of laboratories participated in study with at least 200 samples analyzed and corresponding repetitive germline damaging variants in HRR genes detected in each city in descending order of frequency. Variant was considered as repetitive if it was detected at least two times - for Moscow and Novosibirsk cities; at least three times - for Ufa. Data for Moscow collected based on patients tested with Solo ABC panel; for Ufa and Novosibirsk cities - Solo ABC HRR edition. Ethnic groups with at least 1% representation in each city population are provided for reference and based on the 2020 census in each city. HRR: homologous recombination repair.
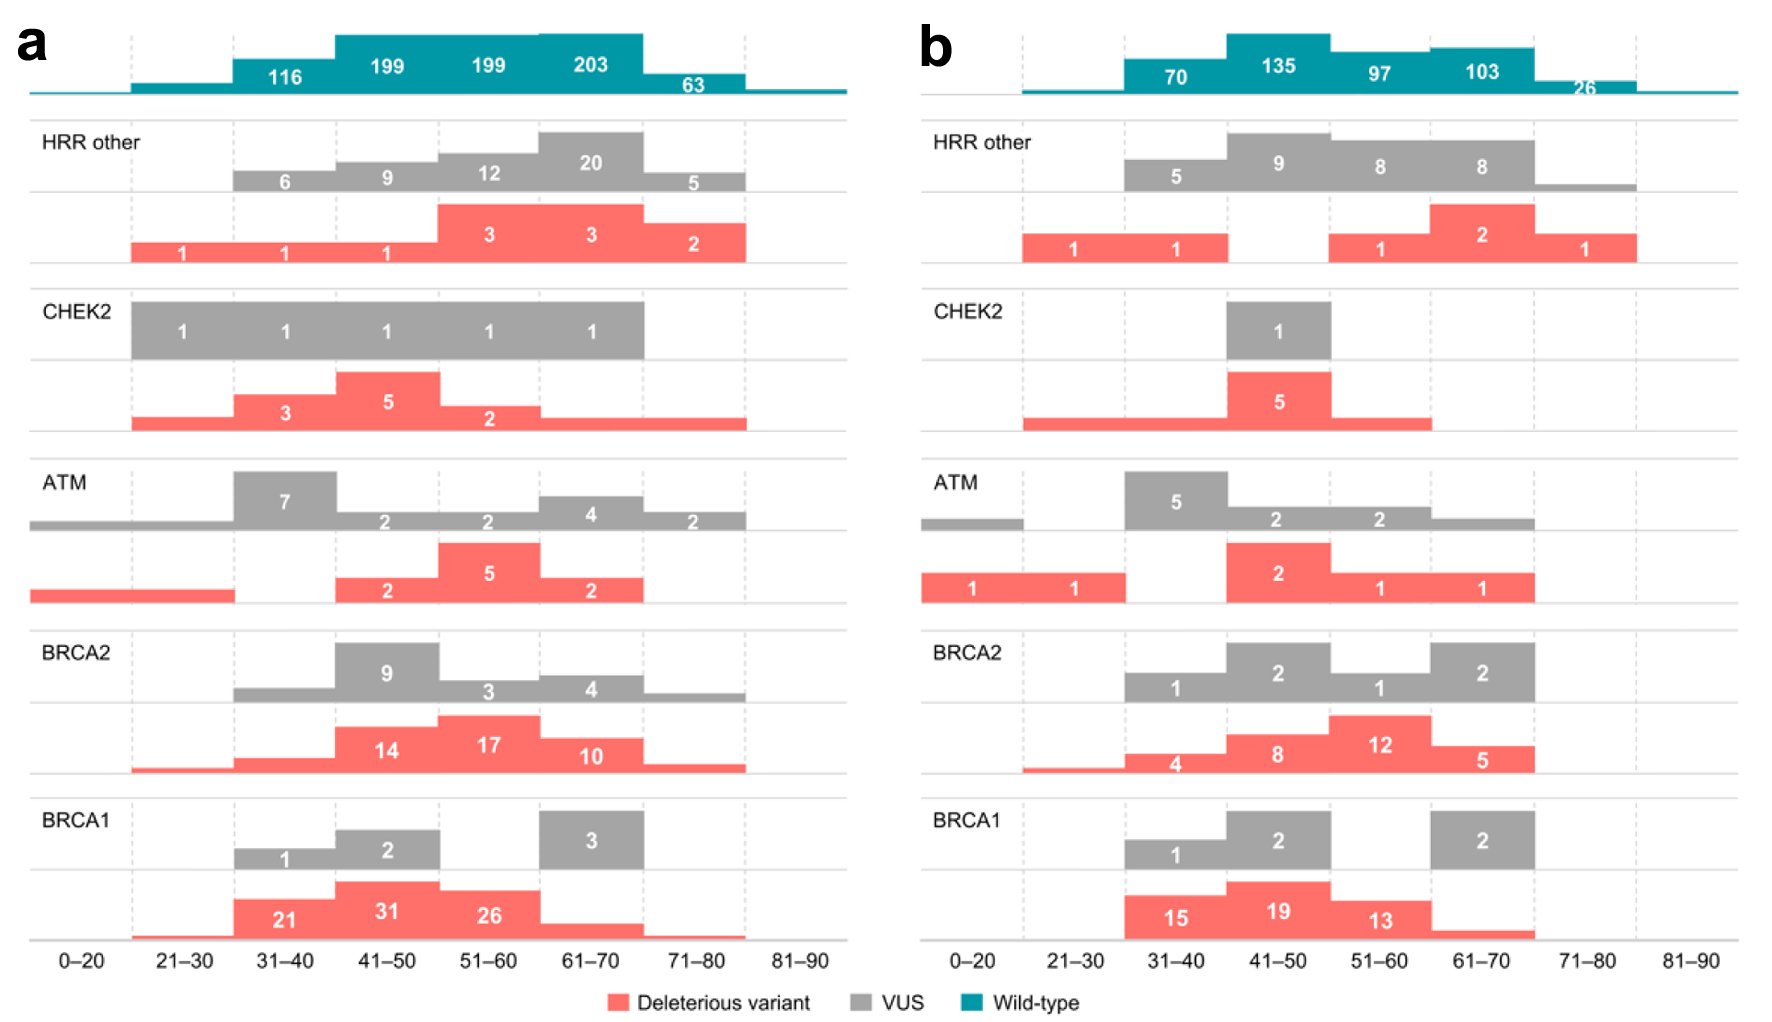
Figure 5. Distribution of germline variants (DV, VUS) by age groups across (a) all patients tested, (b) patients with breast cancer. Data on the age of patients without any identified variants (wild type patients) are presented for reference. VUS: variants of uncertain significance; DV: deleterious variants.
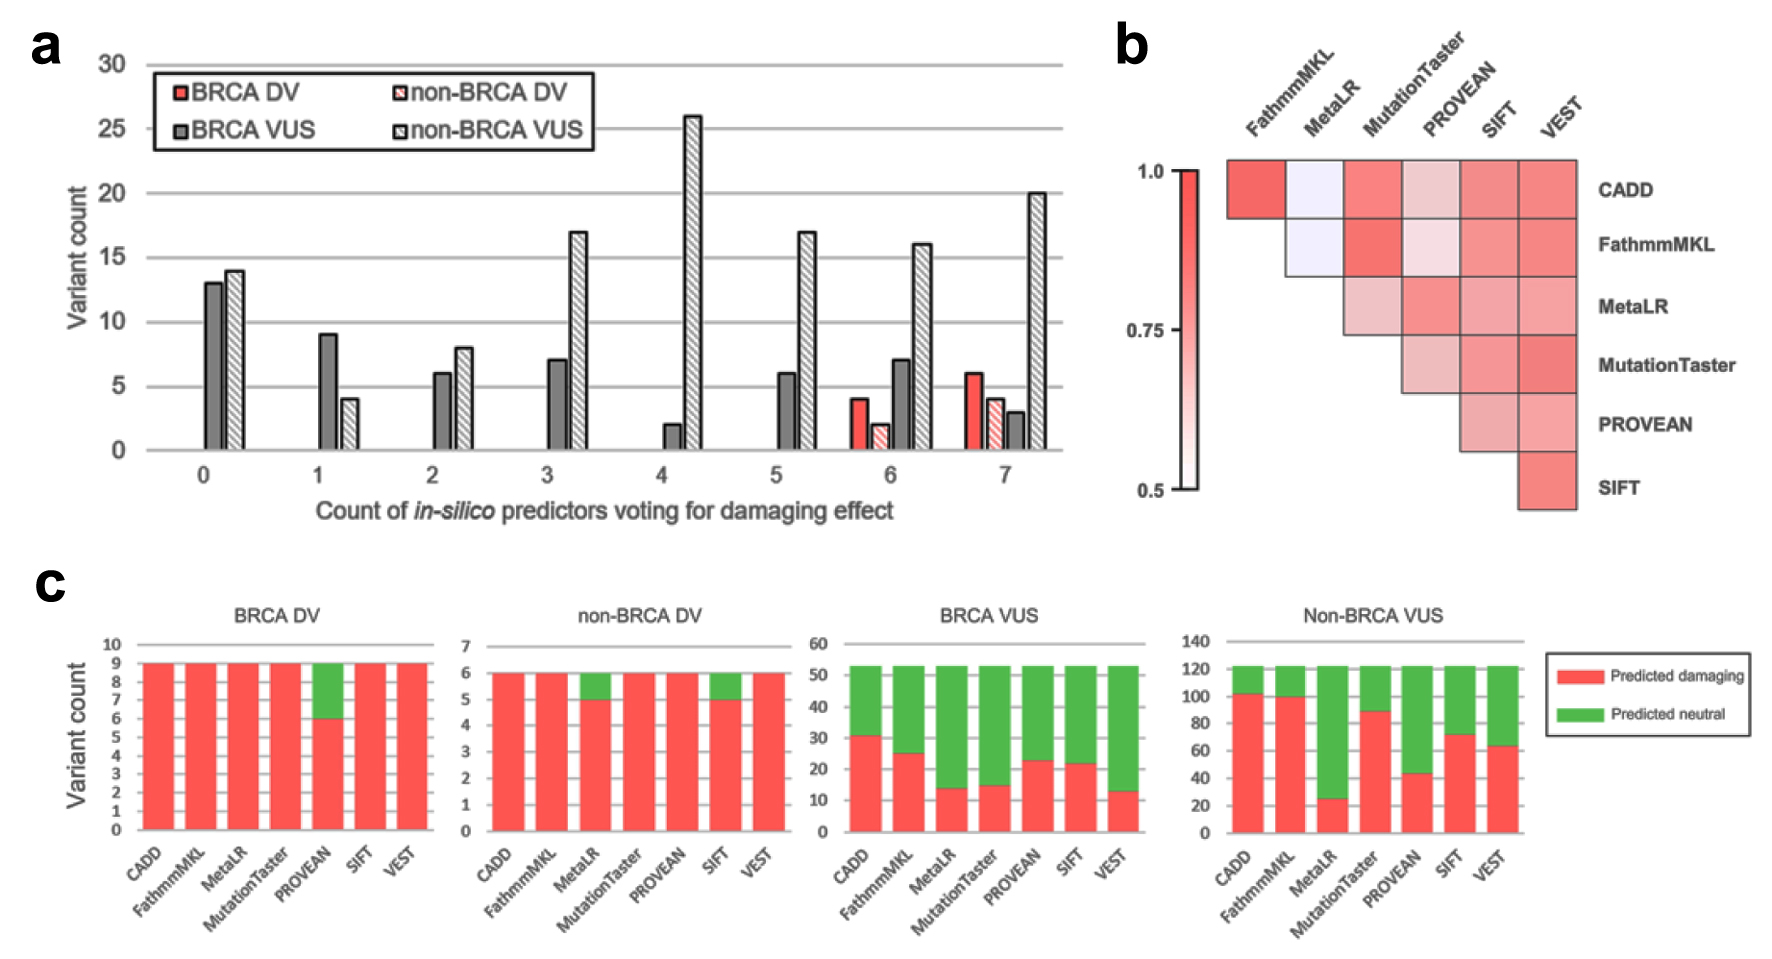
Figure 6. Results of in silico prediction of identified missense variants effect. (a) Distribution of observed VUS and DV by count of in silico tools predicting deleterious effect. (b) Pairwise concordance of in silico prediction algorithms demonstrated on variants identified in study. (c) Per-tool prediction results for BRCA/non-BRCA and VUS/DV. VUS: variants of uncertain significance; DV: deleterious variants.
Table
Table 1. Clinical and Demographic Characteristics of Patients Included in the Study
| aOther: lung, uterus, bowel, head and neck, vulva, stomach, kidney, liver, biliary tract. NOS: not otherwise specified; SD: standard deviation. |
| Patients | 2,032 | | | |
| Samples | 2,071 | | | |
| Patients with duplicate samples | 39 | | | |
| Samples | Total | Tested for BRCA1/2/ATM/CHEK2 | Tested for broad HRR gene panel | |
| Genomic DNA | 1,335 | 547 | 788 | |
| Tumor DNA | 242 | 139 | 103 | |
| NOS | 494 | 361 | 133 | |
| Patients | No. of patients | Patients with known age of testing | Age of testing, mean ± SD (min. - max.) | Median age of testing |
| Sex | | | | |
| Female | 1,177 | 991 | 52.2 ± 12.9 (7 - 87) | 54 |
| Male | 83 | 65 | 62.6 ± 10.9 (37 - 90) | 54 |
| NOS | 772 | 13 | 61.9 ± 10.7 (41 - 79) | 54 |
| Cancer type | | | | |
| NOS | 900 | 177 | 44.7 ± 13.7 (7 -78) | 53 |
| Breast | 715 | 584 | 51.9 ± 12.2 (20 - 90) | 54 |
| Ovary | 259 | 191 | 58.4 ± 10.6 (27 - 81) | 54 |
| Pancreas | 85 | 59 | 61.9 ± 8.6 (38 - 80) | 54 |
| Prostate | 58 | 44 | 65.8 ± 9.7 (41 - 87) | 54 |
| Othera | 15 | 14 | 52.1 ± 14.6 (33 - 80) | 55 |


