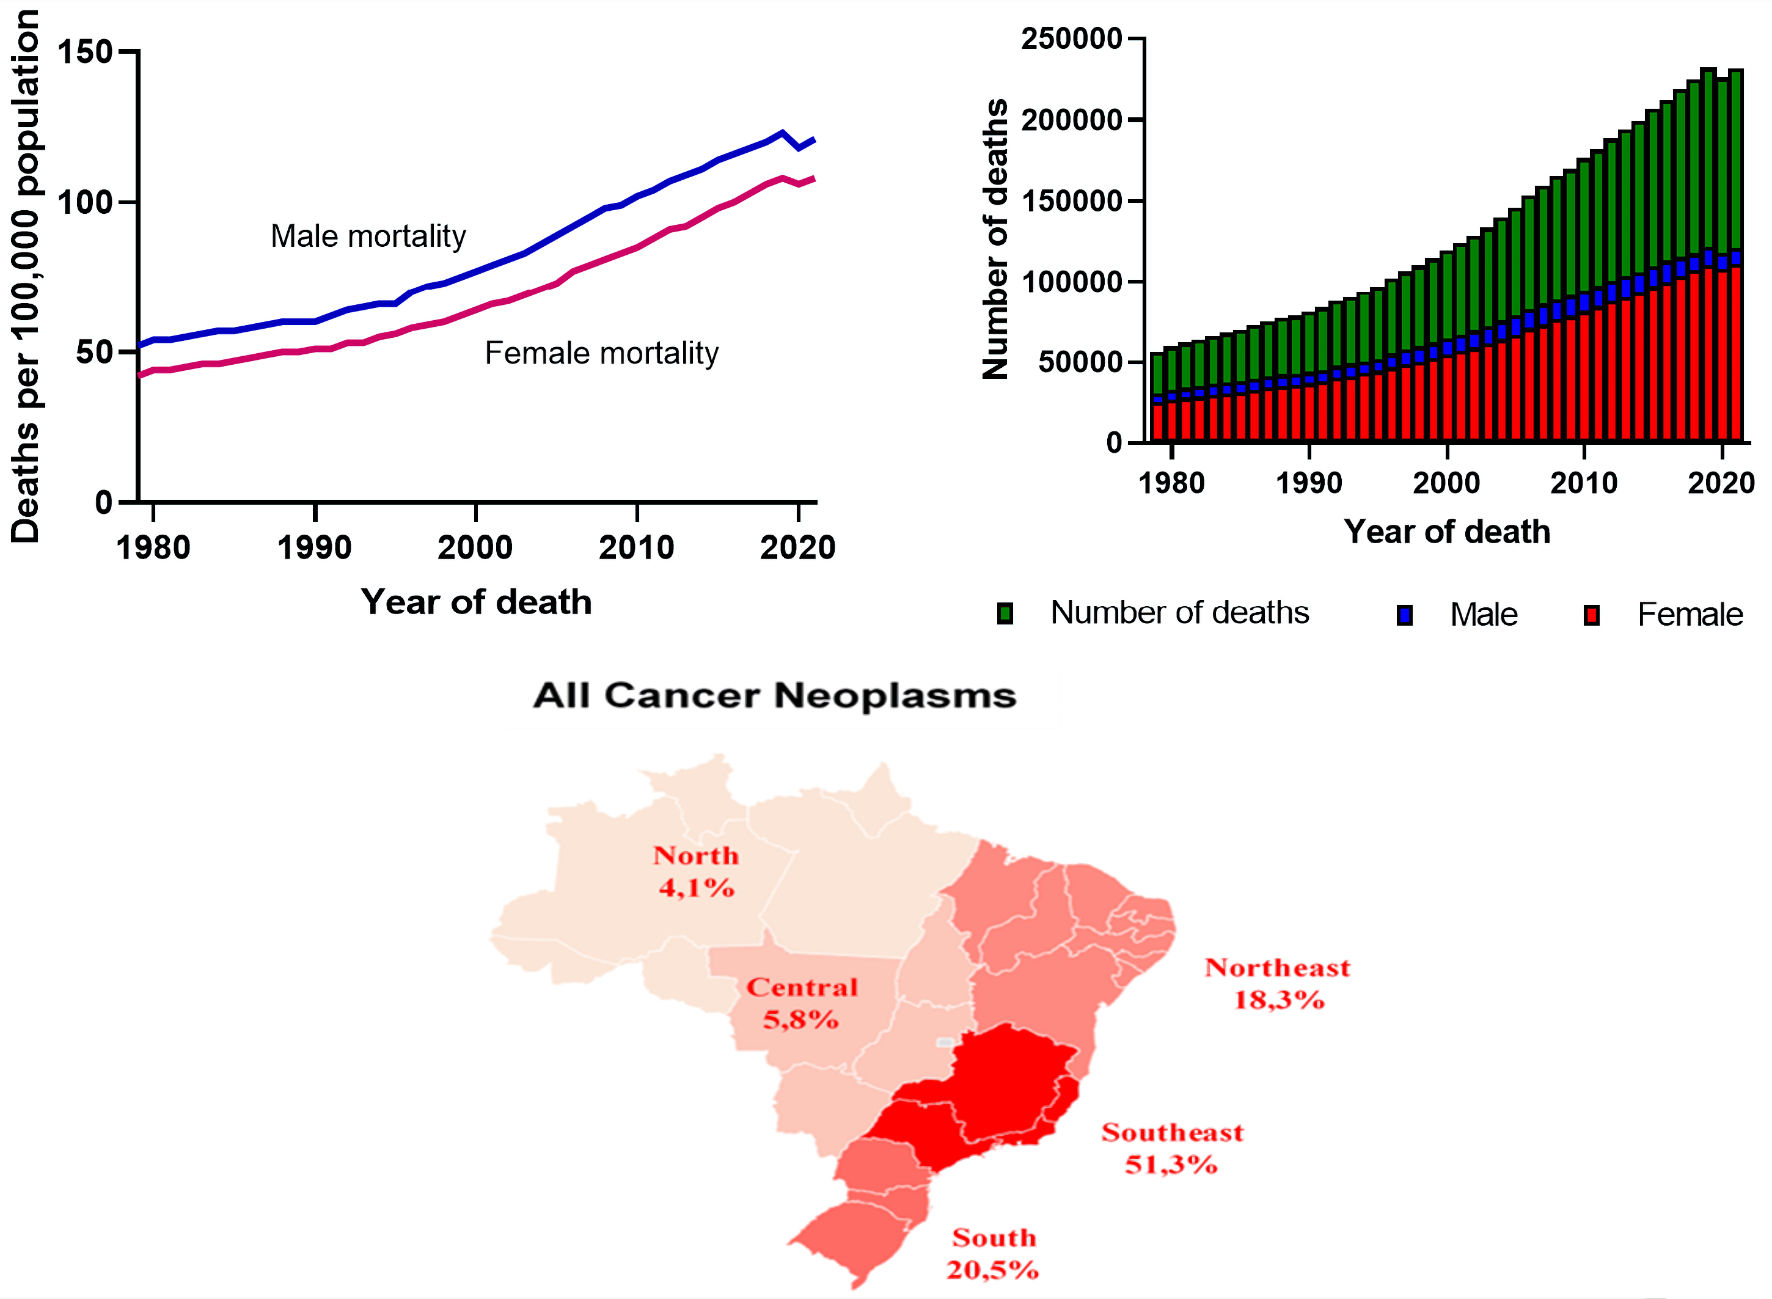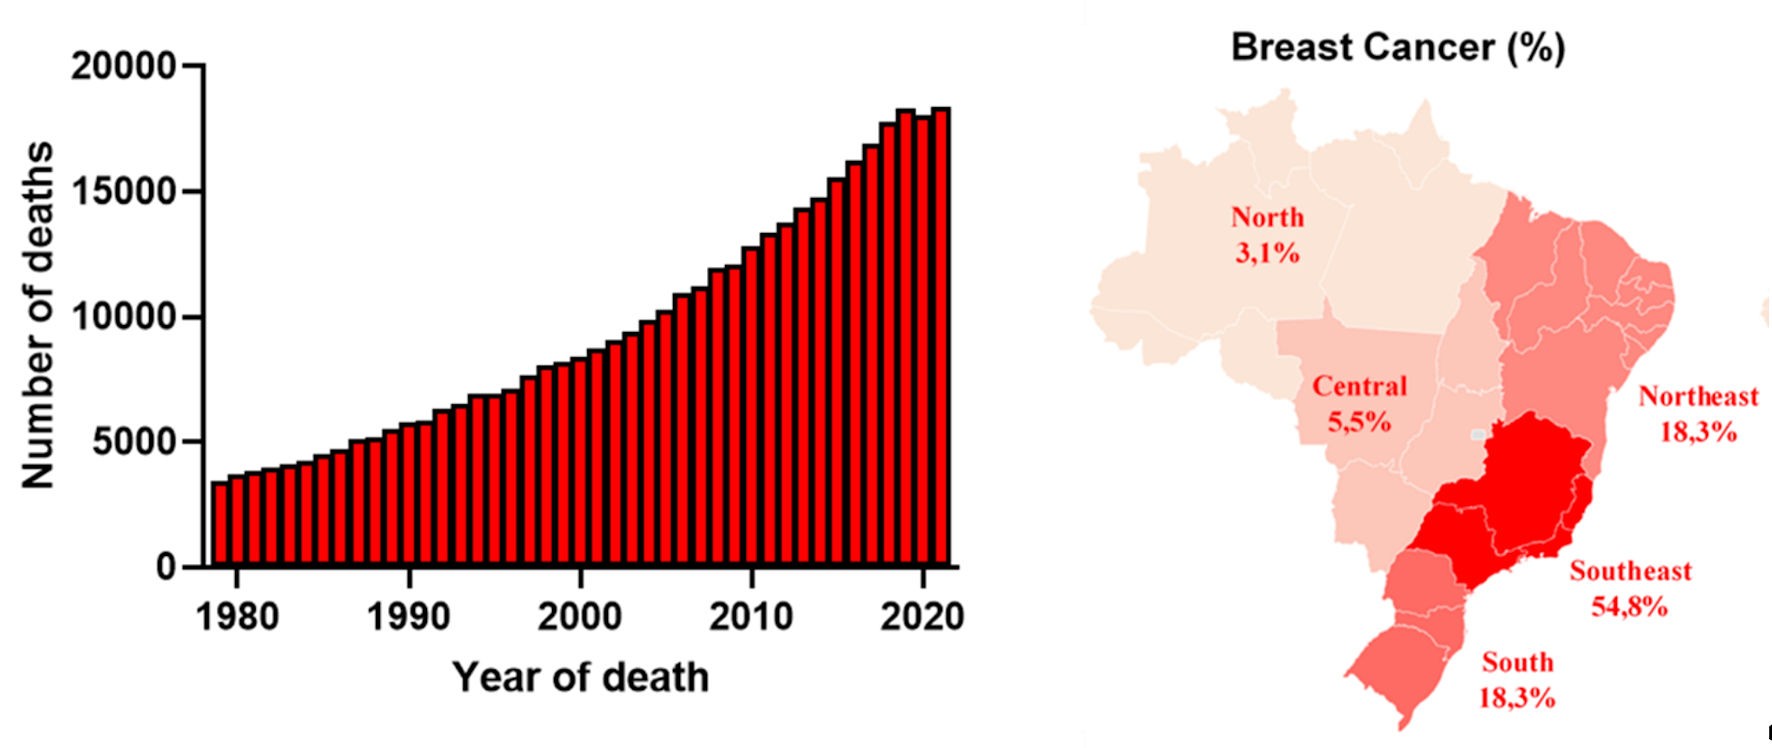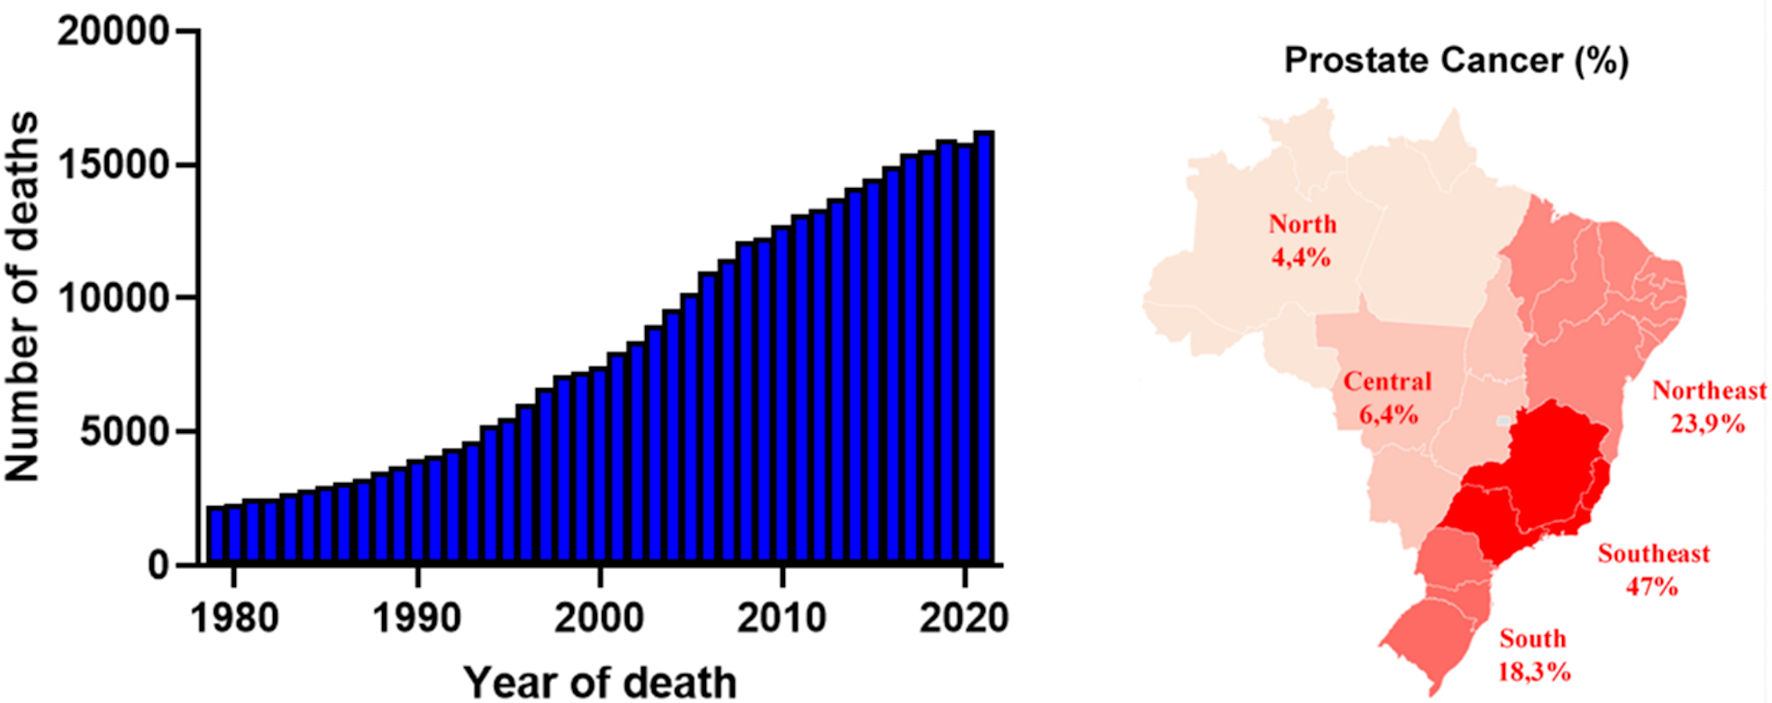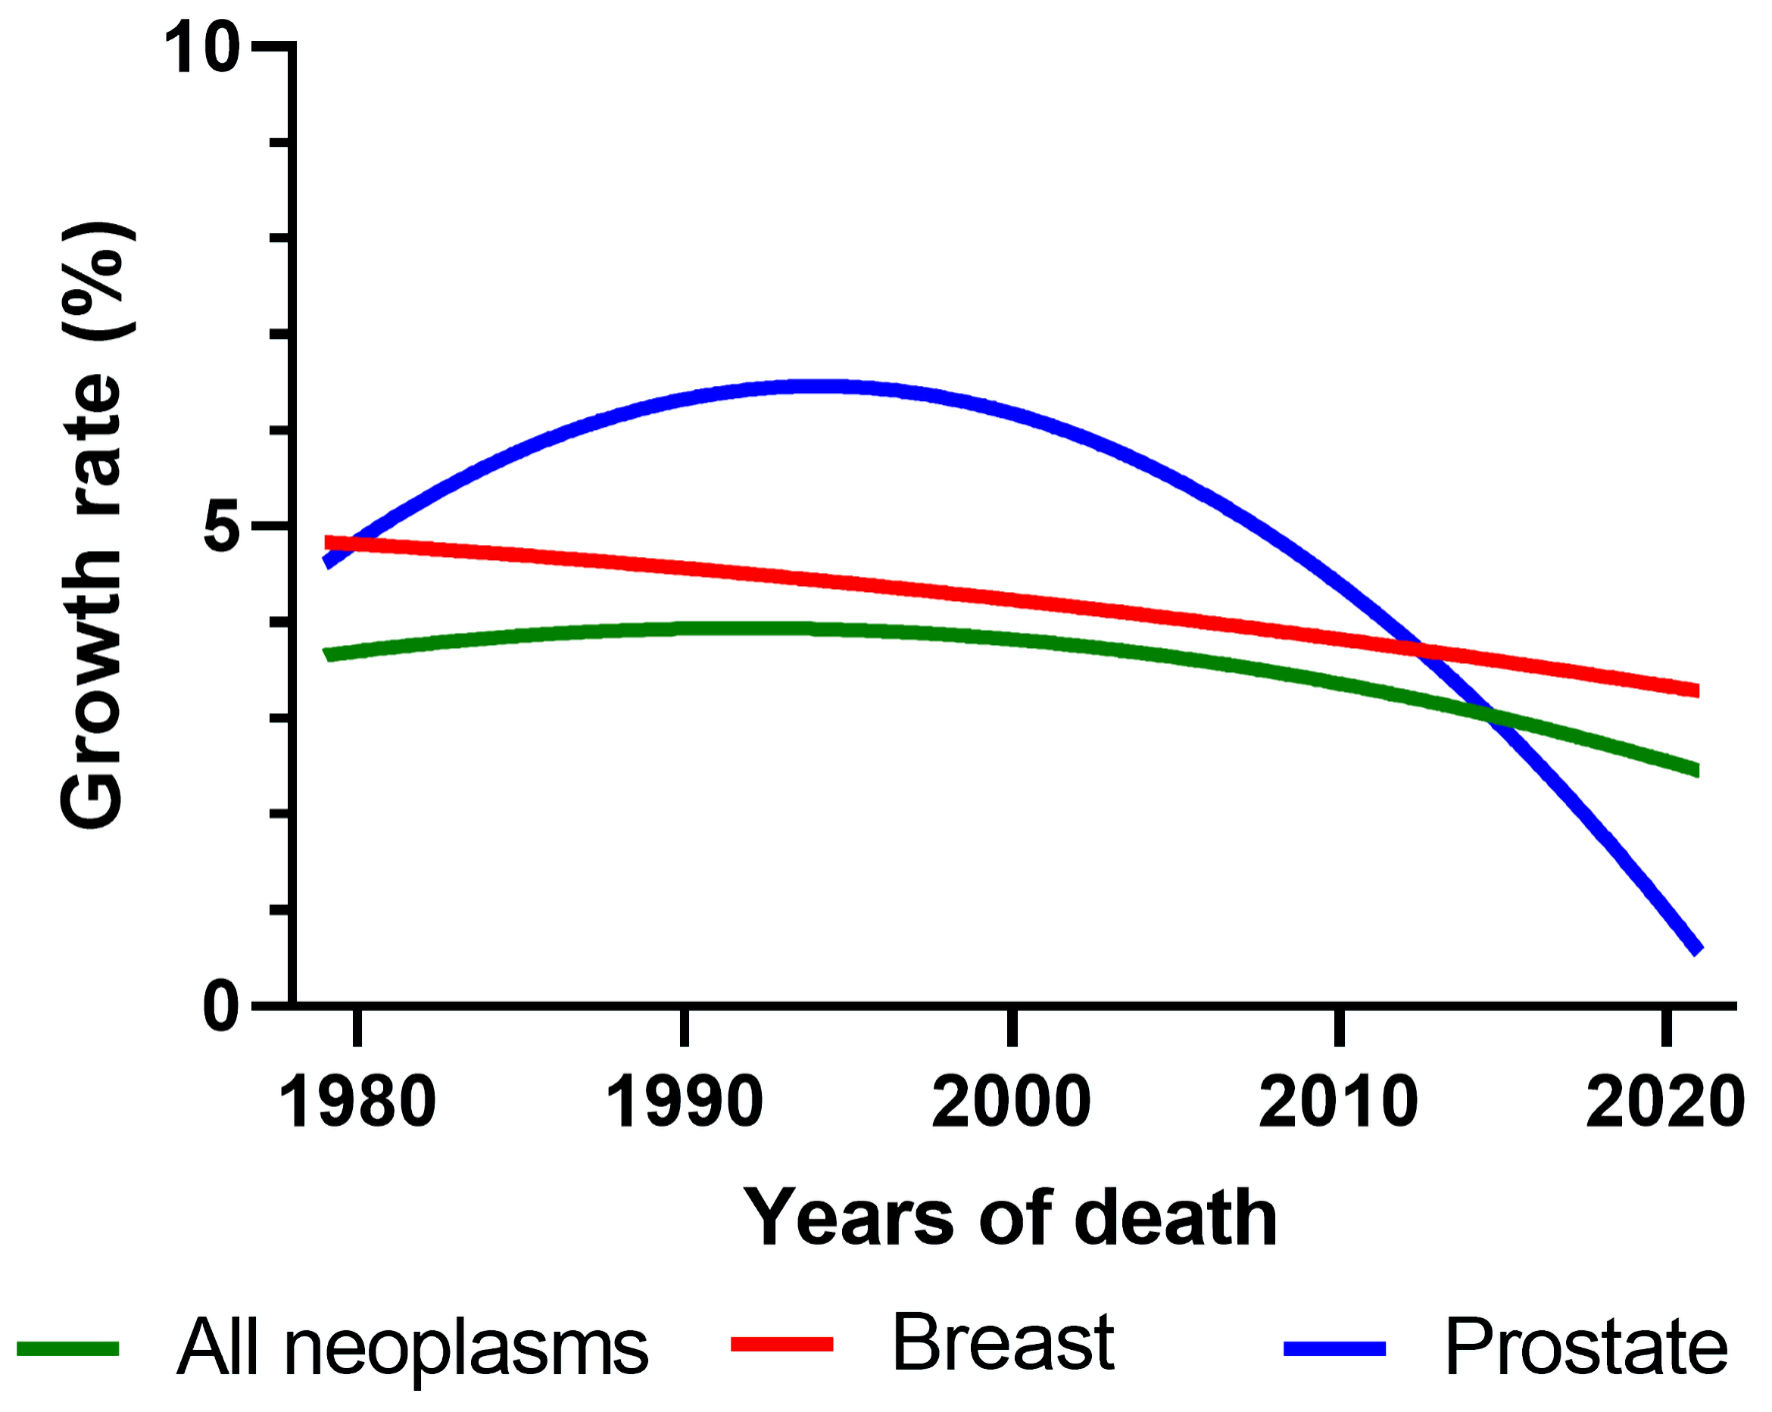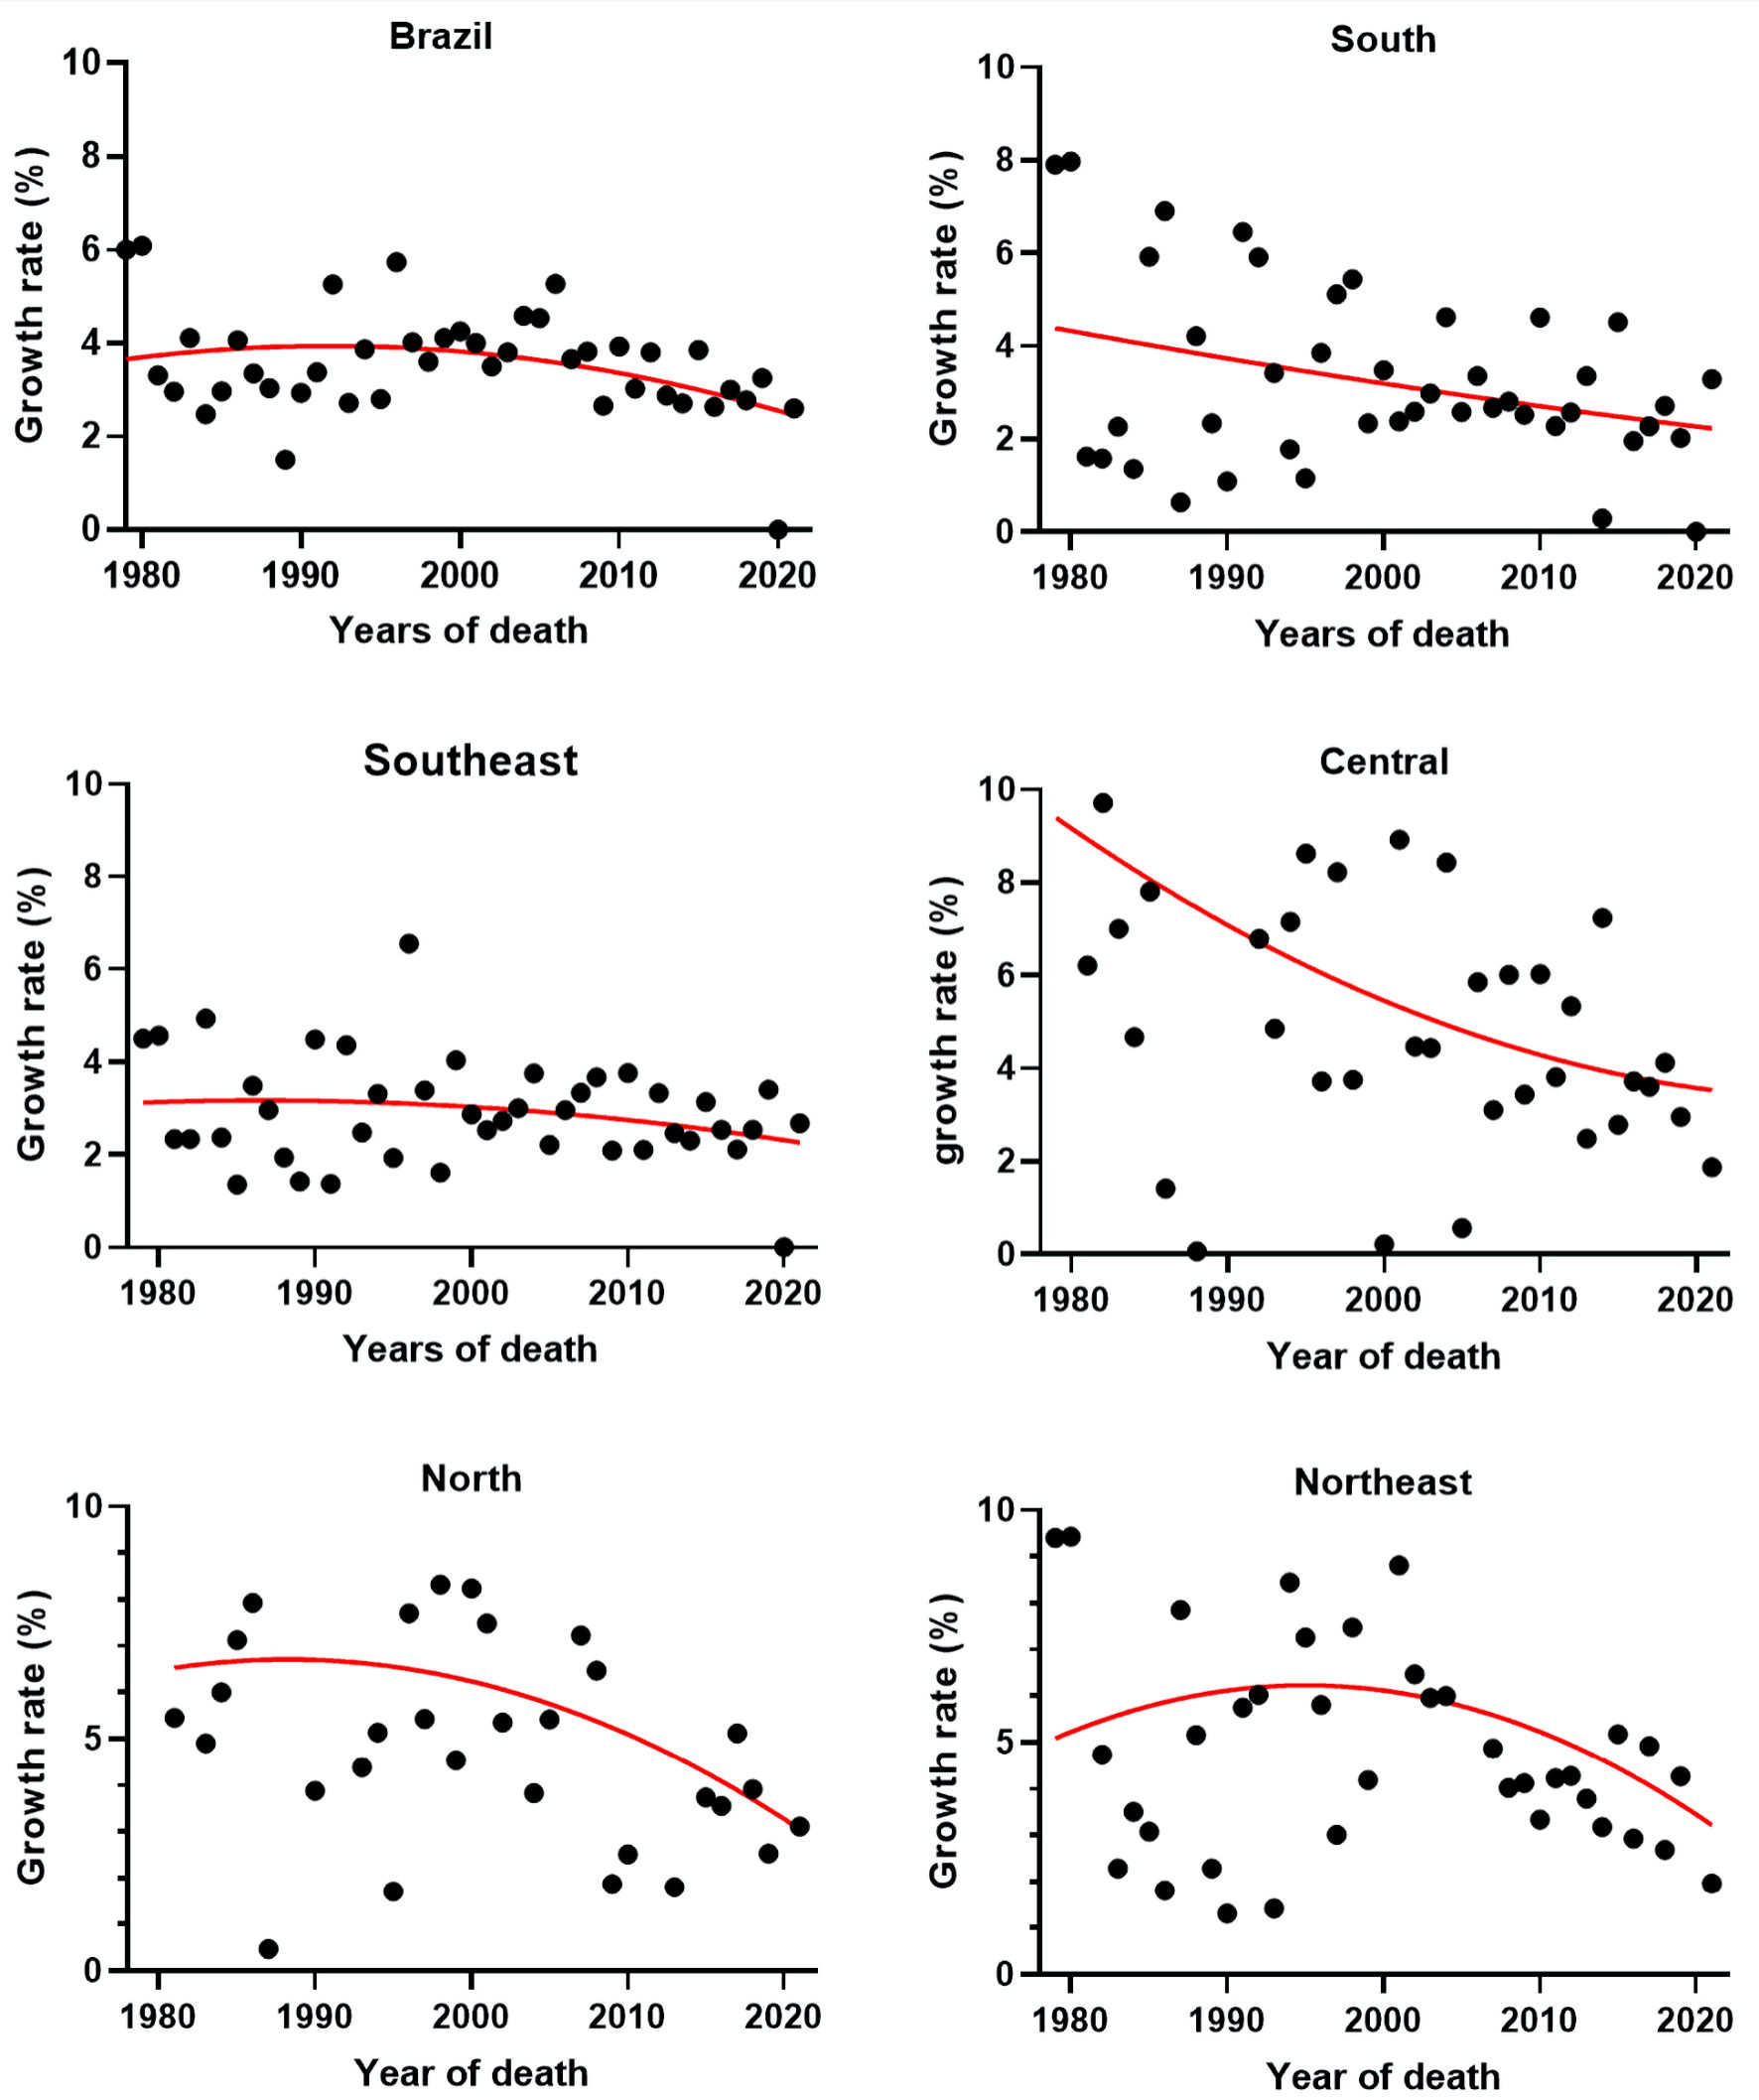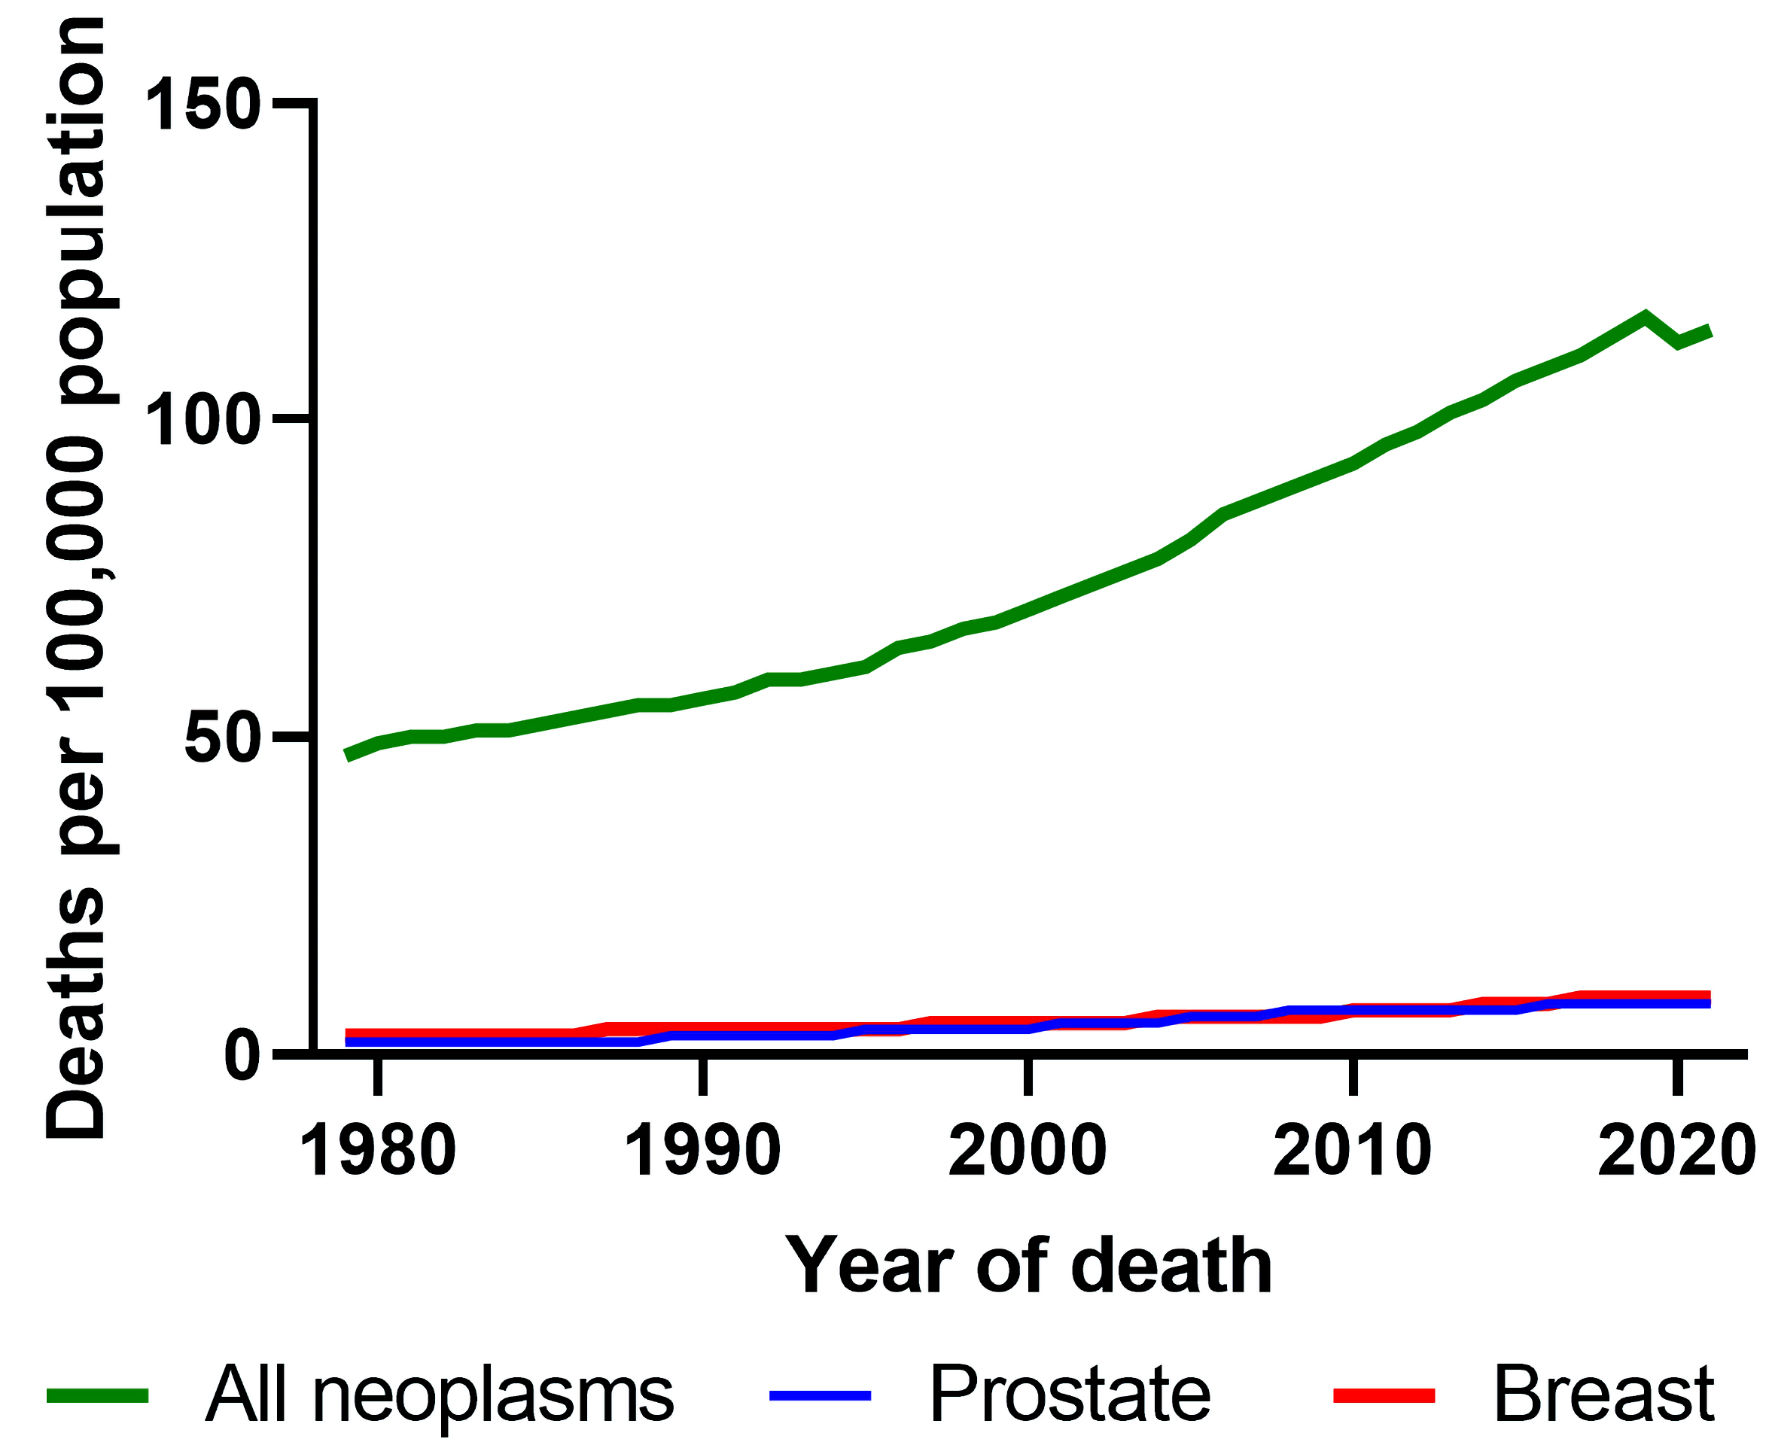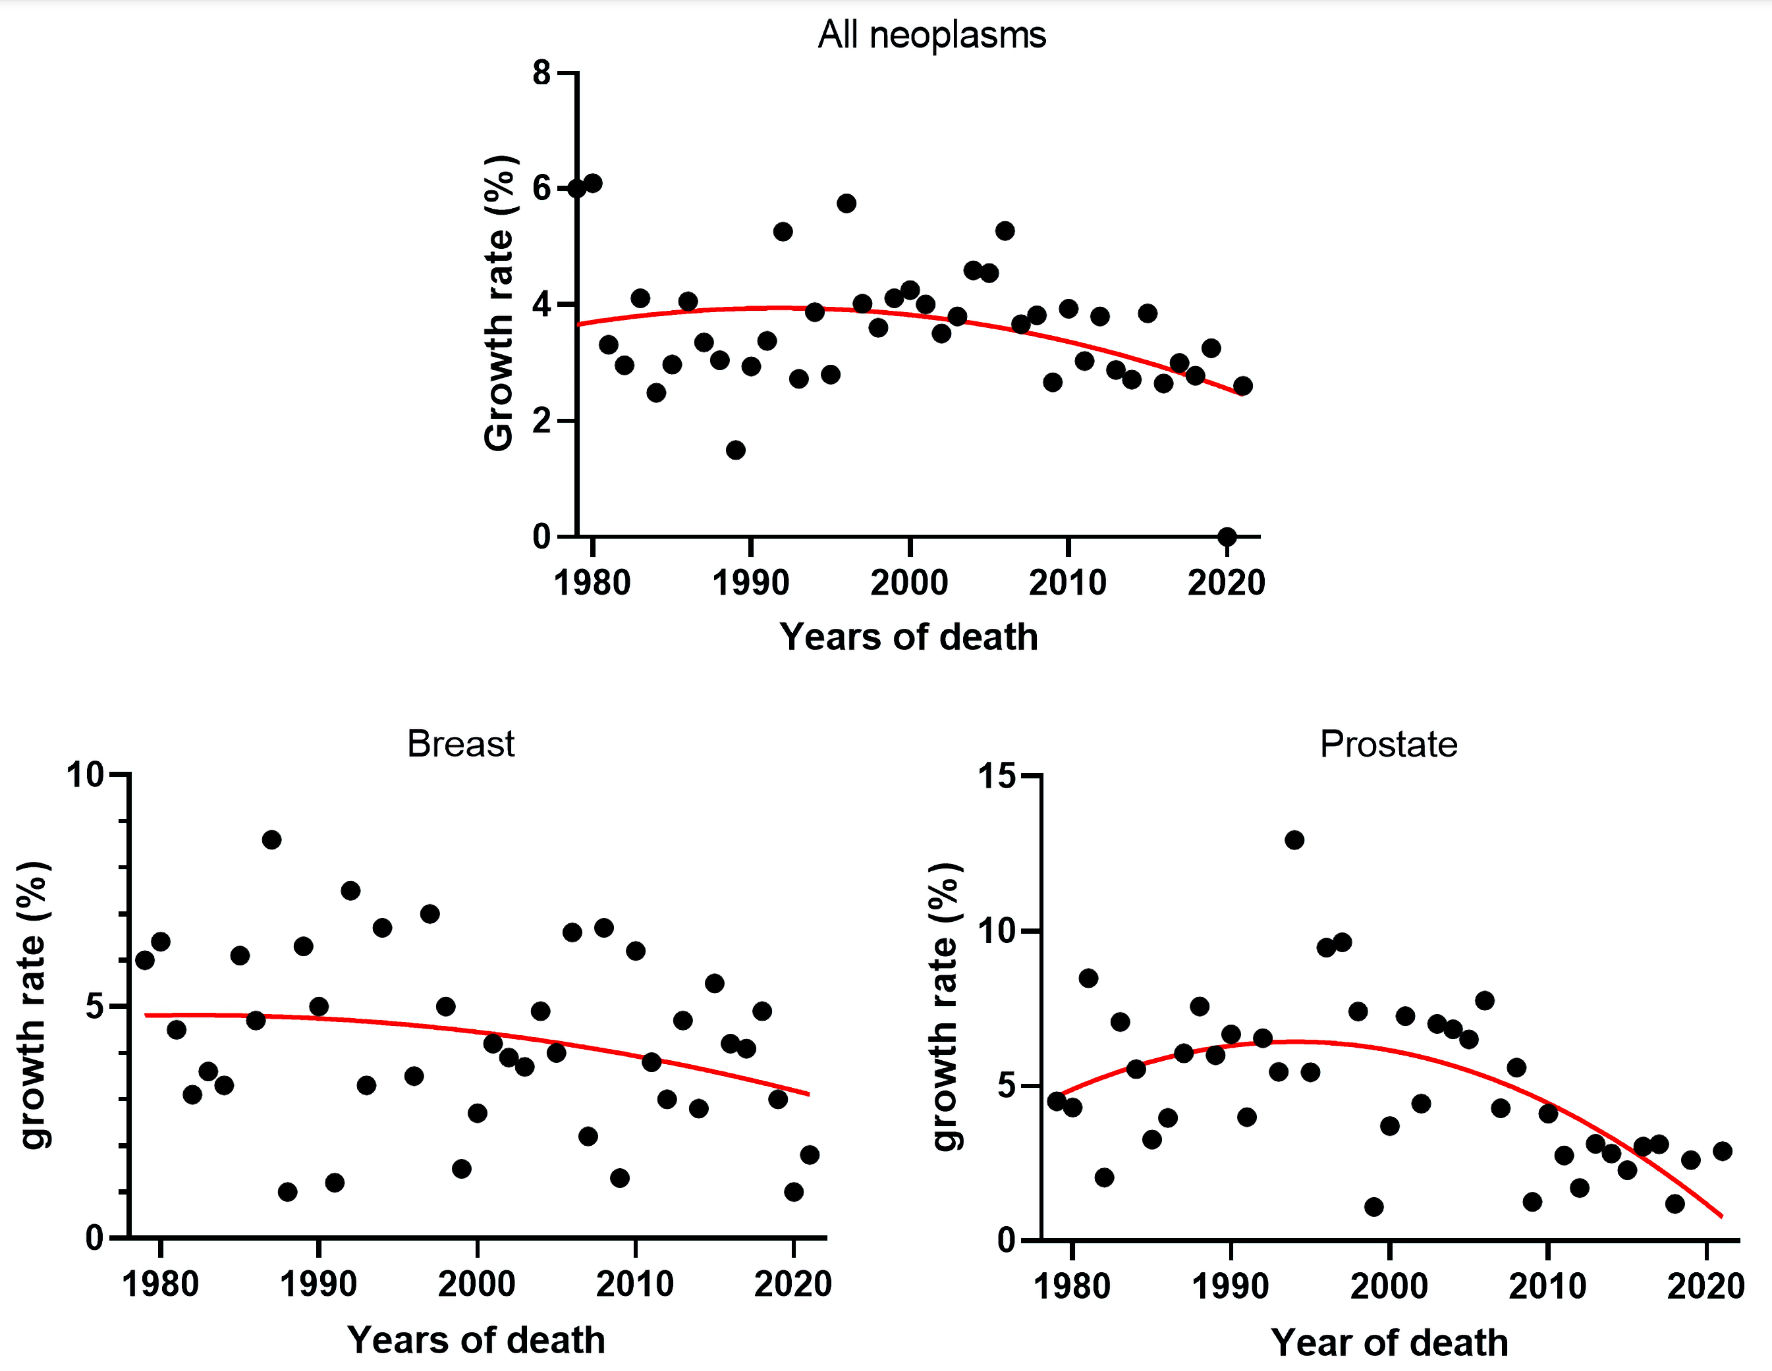
Figure 1. Growth rates of cancer deaths in Brazil from 1979 to 2021 for all neoplasm, breast and prostate cancer and their respective interpolating polynomial.
| World Journal of Oncology, ISSN 1920-4531 print, 1920-454X online, Open Access |
| Article copyright, the authors; Journal compilation copyright, World J Oncol and Elmer Press Inc |
| Journal website https://www.wjon.org |
Original Article
Volume 15, Number 3, June 2024, pages 463-471
Deciphering Trends in Cancer Mortality: A Comprehensive Analysis of Brazilian Data From 1979 to 2021 With Emphasis on Breast and Prostate Cancers
Figures

