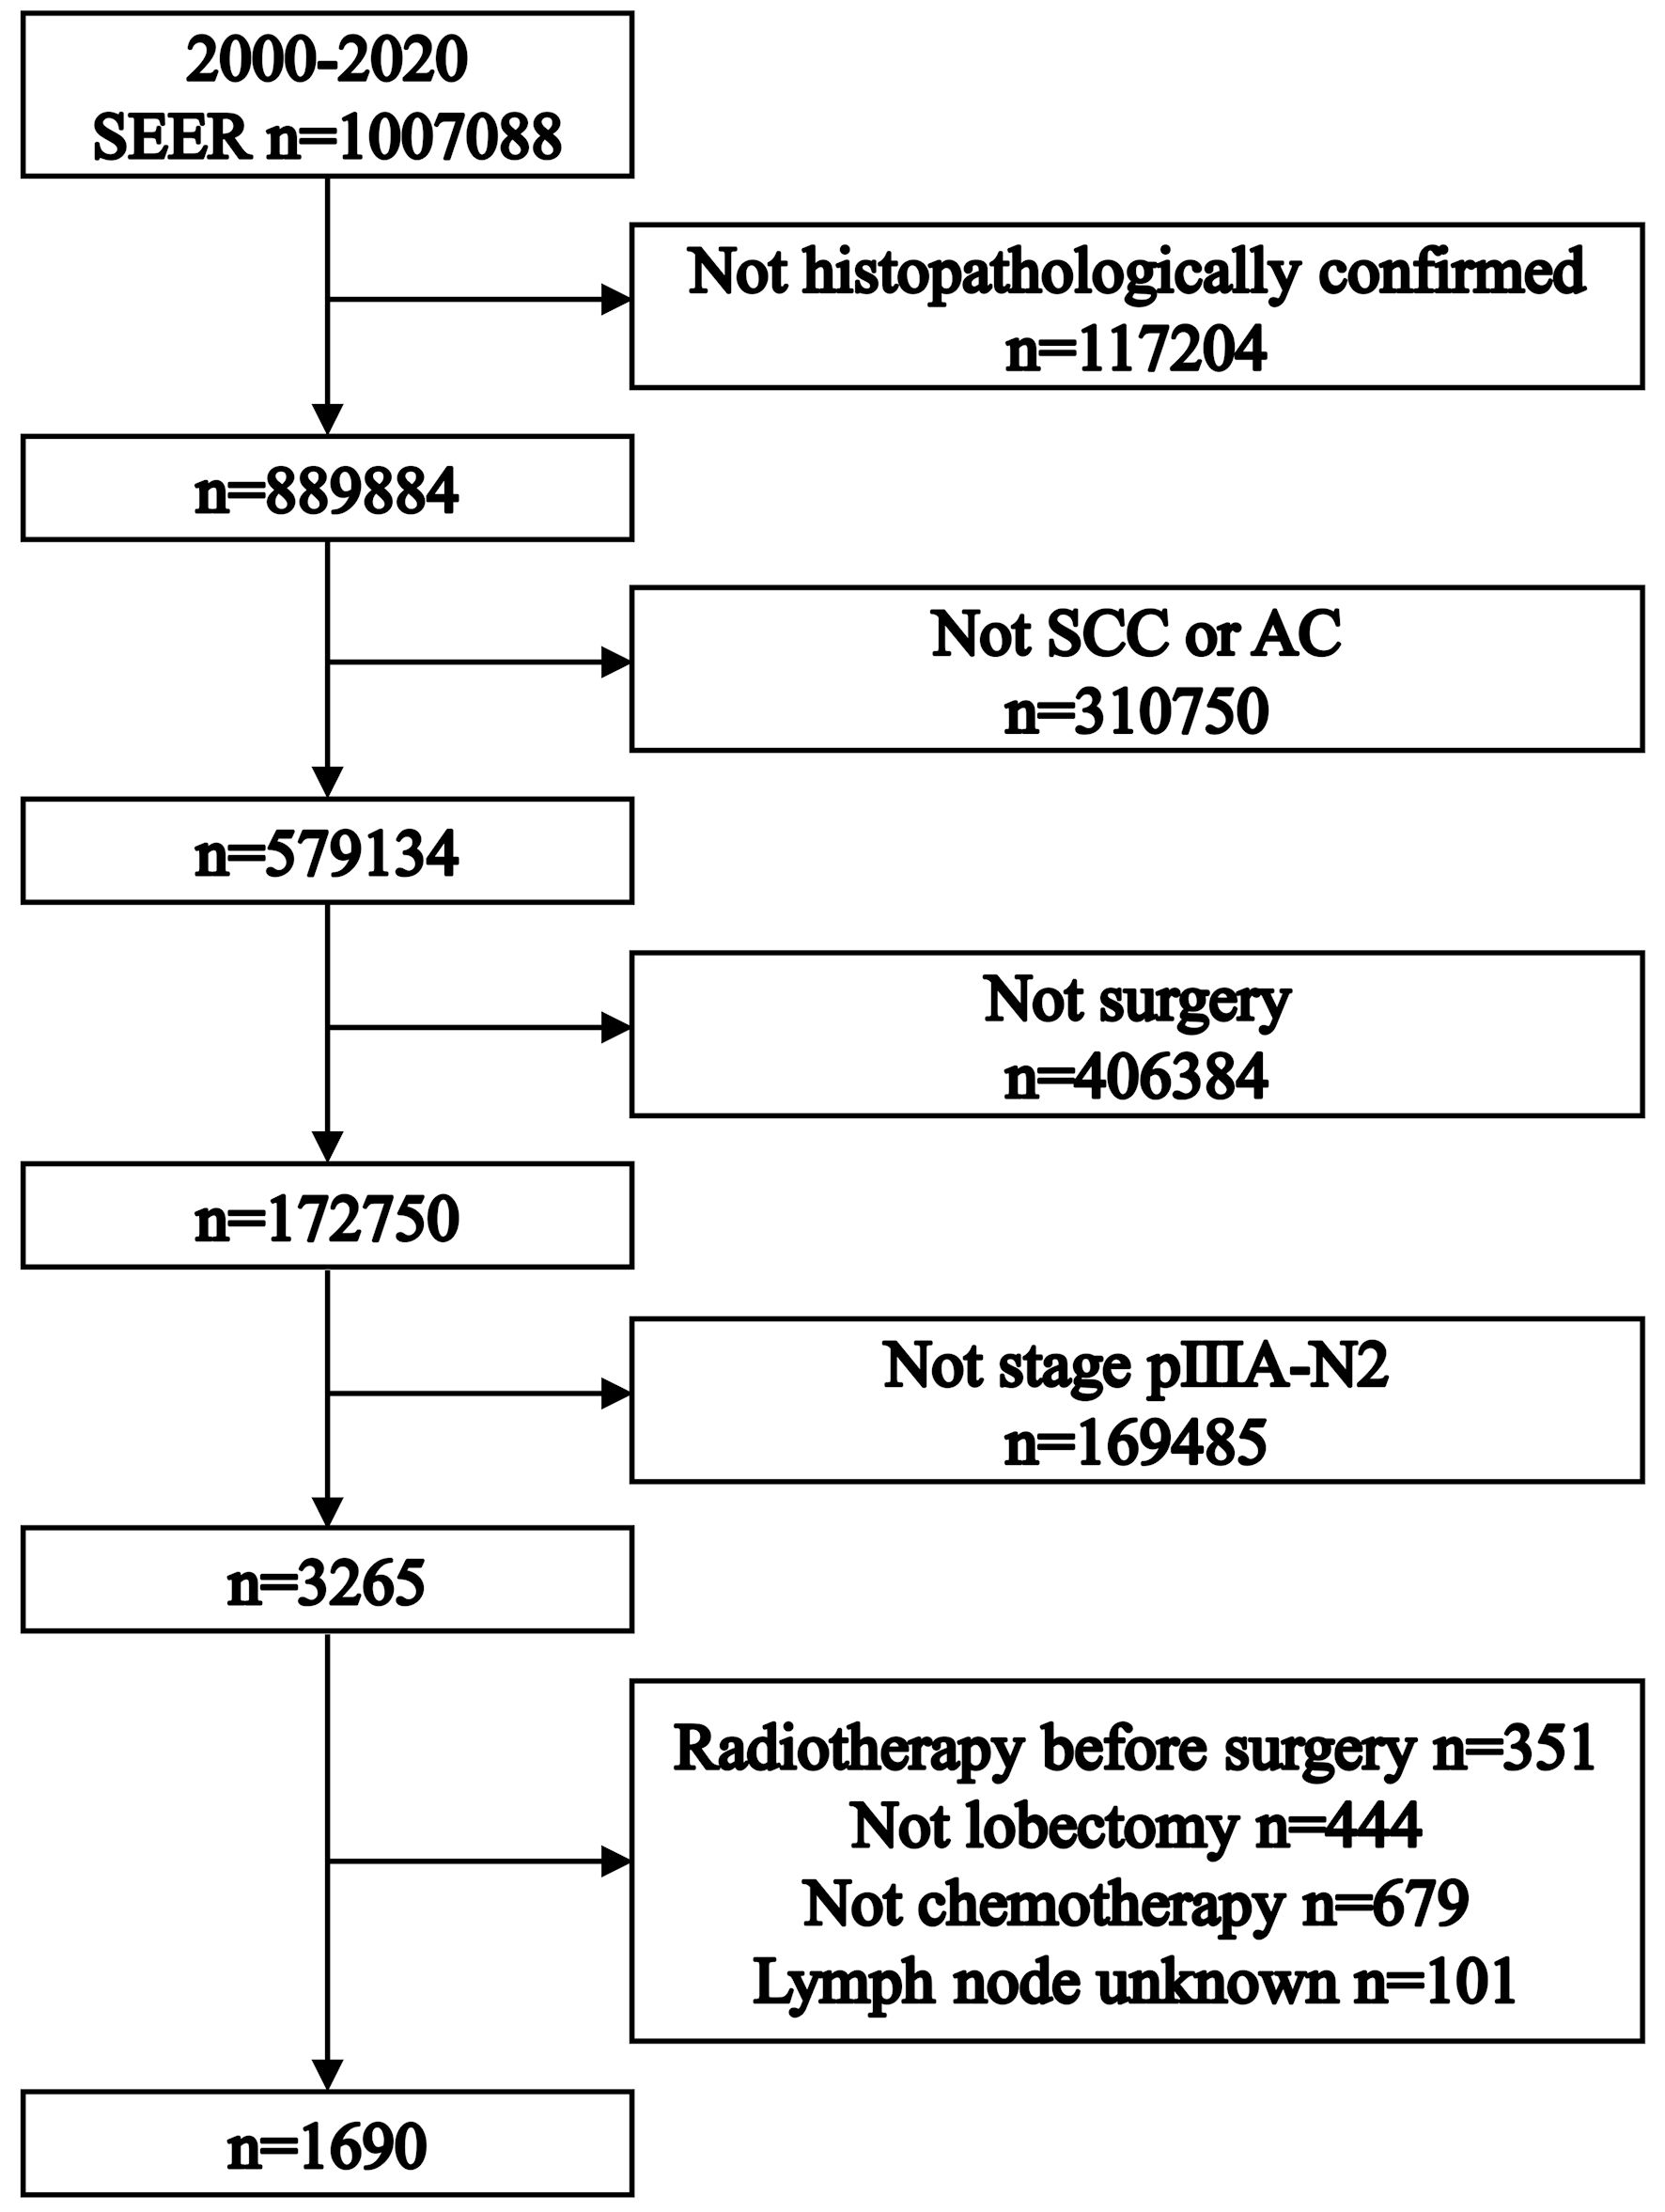
Figure 1. Flowchart illustrating the patient selection process for the study, outlining the criteria for inclusion and exclusion from the Surveillance, Epidemiology, and End Results database. SCC: squamous cell carcinoma. AC: adenocarcinoma.
| World Journal of Oncology, ISSN 1920-4531 print, 1920-454X online, Open Access |
| Article copyright, the authors; Journal compilation copyright, World J Oncol and Elmer Press Inc |
| Journal website https://www.wjon.org |
Original Article
Volume 15, Number 2, April 2024, pages 309-318
Role of Postoperative Radiotherapy on High-Risk Stage pIIIA-N2 Non-Small Cell Lung Cancer Patients After Complete Resection and Adjuvant Chemotherapy: A Retrospective Cohort Study
Figures
Tables
| LNR < 0.29 (n = 840) | LNR ≥ 0.29 (n = 850) | P | |
|---|---|---|---|
| LNR: lymph node ratio. | |||
| Age | 0.440 | ||
| < 66 | 418 (49.8%) | 406 (47.8%) | |
| ≥ 66 | 422 (50.2%) | 444 (52.2%) | |
| Sex | 0.133 | ||
| Female | 419 (49.9%) | 456 (53.6%) | |
| Male | 421 (50.1%) | 394 (46.4%) | |
| Race | 0.779 | ||
| White | 696 (82.8%) | 695 (81.8%) | |
| Black | 72 (8.6%) | 81 (9.5%) | |
| Others | 72 (8.6%) | 74 (8.7%) | |
| Site | 0.959 | ||
| Upper lobe | 480 (57.1%) | 476 (56.0%) | |
| Middle lobe | 48 (5.7%) | 50 (5.9%) | |
| Lower lobe | 287 (34.2%) | 300 (35.3%) | |
| Others | 25 (3.0%) | 24 (2.8%) | |
| Laterality | 0.650 | ||
| Left | 358 (42.6%) | 352 (41.4%) | |
| Right | 482 (57.4%) | 498 (58.6%) | |
| Grade | 0.712 | ||
| I/II | 421 (50.1%) | 409 (48.1%) | |
| III/IV | 350 (41.7%) | 369 (43.4%) | |
| unknown | 69 (8.2%) | 72 (8.5%) | |
| Histology | 0.002 | ||
| Squamous cell carcinoma | 625 (74.4%) | 687 (80.8%) | |
| Adenocarcinoma | 215 (25.6%) | 163 (19.2%) | |
| T stage | 0.783 | ||
| T1 | 283 (33.7%) | 280 (32.9%) | |
| T2 | 557 (66.3%) | 570 (67.1%) | |
| Non-radiotherapy (n = 376) | Radiotherapy (n = 474) | P | |
|---|---|---|---|
| Age | 0.037 | ||
| < 66 | 164 (43.6%) | 242 (51.1%) | |
| ≥ 66 | 212 (56.4%) | 232 (48.9%) | |
| Sex | 0.507 | ||
| Female | 207 (55.1%) | 249 (52.5%) | |
| Male | 169 (44.9%) | 225 (47.5%) | |
| Race | 0.097 | ||
| White | 314 (83.5%) | 381 (80.4%) | |
| Black | 38 (10.1%) | 43 (9.1%) | |
| Others | 24 (6.4%) | 50 (10.5%) | |
| Site | 0.537 | ||
| Upper lobe | 206 (54.8%) | 270 (57.0%) | |
| Middle lobe | 23 (6.1%) | 27 (5.7%) | |
| Lower lobe | 133 (35.4%) | 167 (35.2%) | |
| Others | 14 (3.7%) | 10 (2.1%) | |
| Laterality | 0.502 | ||
| Left | 161 (42.8%) | 191 (40.3%) | |
| Right | 215 (57.2%) | 283 (59.7%) | |
| Grade | 0.635 | ||
| I/II | 178 (47.3%) | 231 (48.7%) | |
| III/IV | 169 (44.9%) | 200 (42.2%) | |
| Unknown | 29 (7.8%) | 43 (9.1%) | |
| Histology | 0.441 | ||
| Squamous cell carcinoma | 299 (79.5%) | 388 (81.9%) | |
| Adenocarcinoma | 77 (20.5%) | 86 (18.1%) | |
| T stage | 0.350 | ||
| T1 | 117 (31.1%) | 163 (34.4%) | |
| T2 | 259 (68.9%) | 311 (65.6%) |