Figures
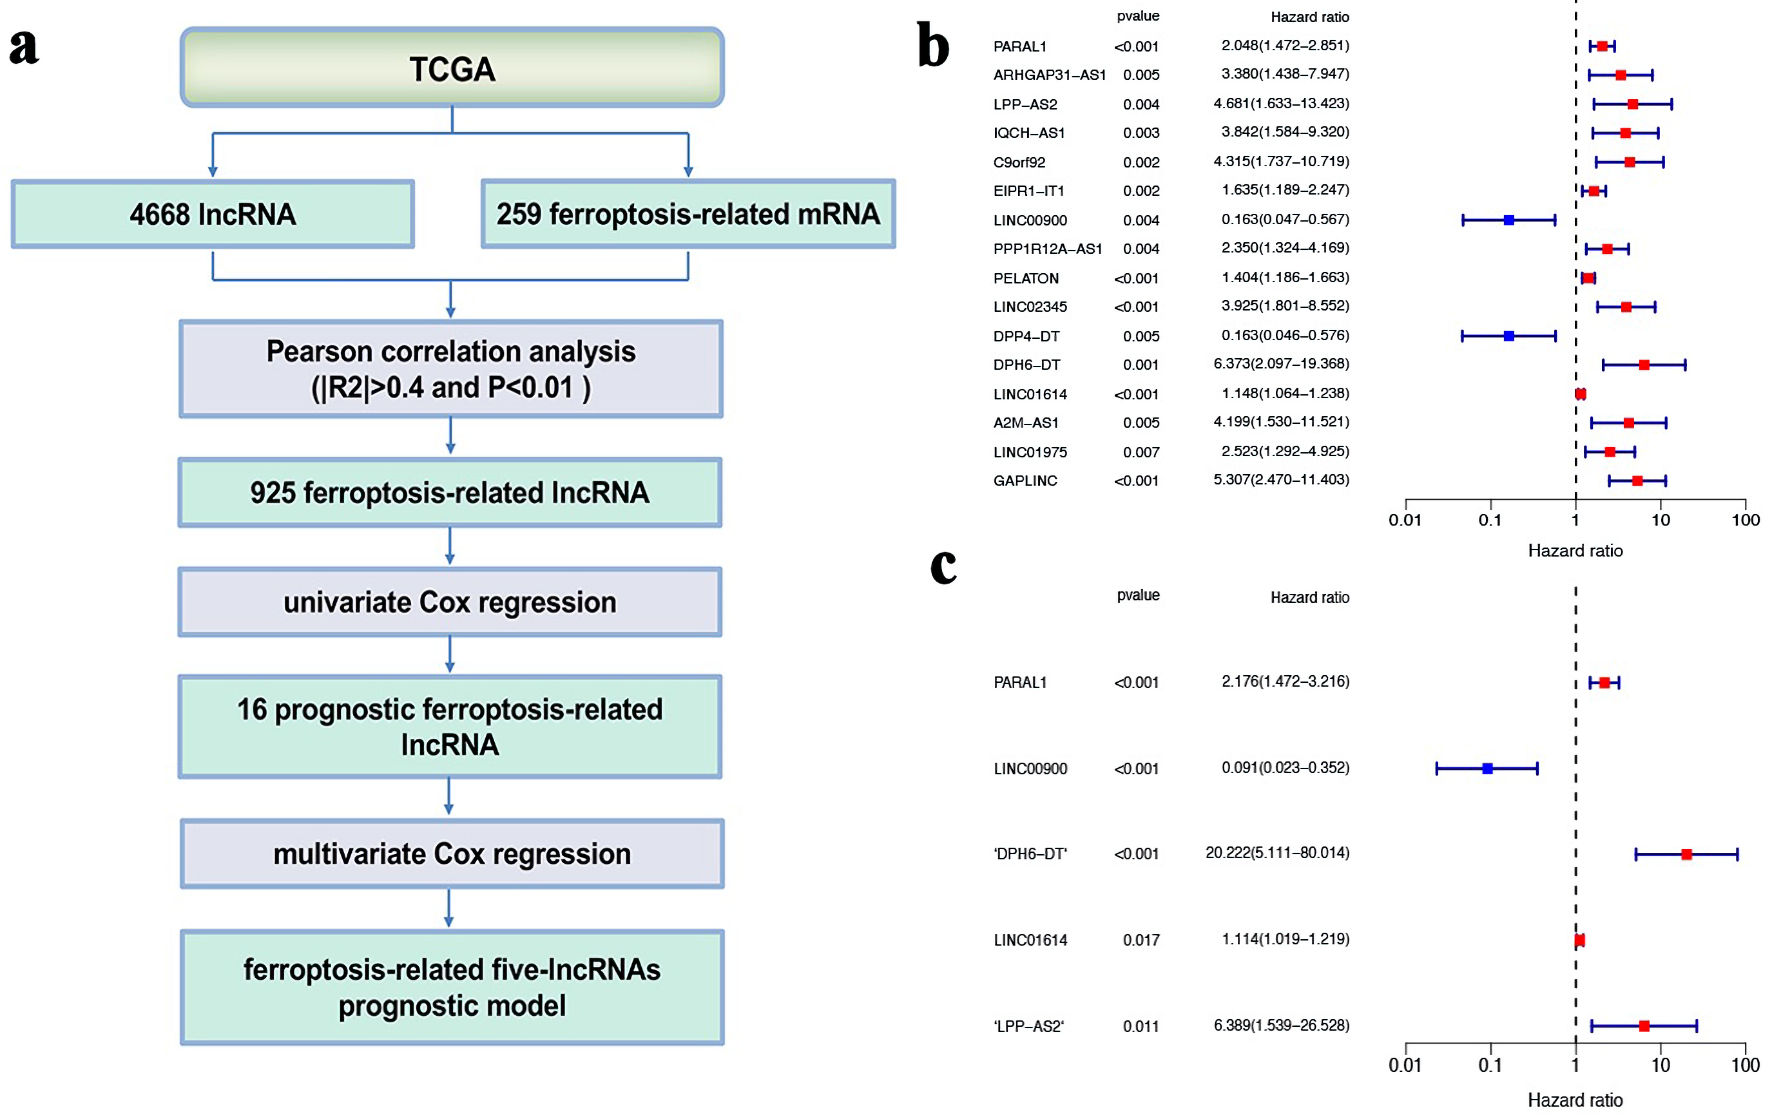
Figure 1. Determination of ferroptosis-related five-lncRNAs prognostic model. (a) The flowchart of how the five gene signature of ferroptosis-related lncRNAs were identified. (b) Univariate Cox regression analysis. (c) Multivariate Cox regression analysis. lncRNA: long non-coding RNA; TCGA: The Cancer Genome Atlas.
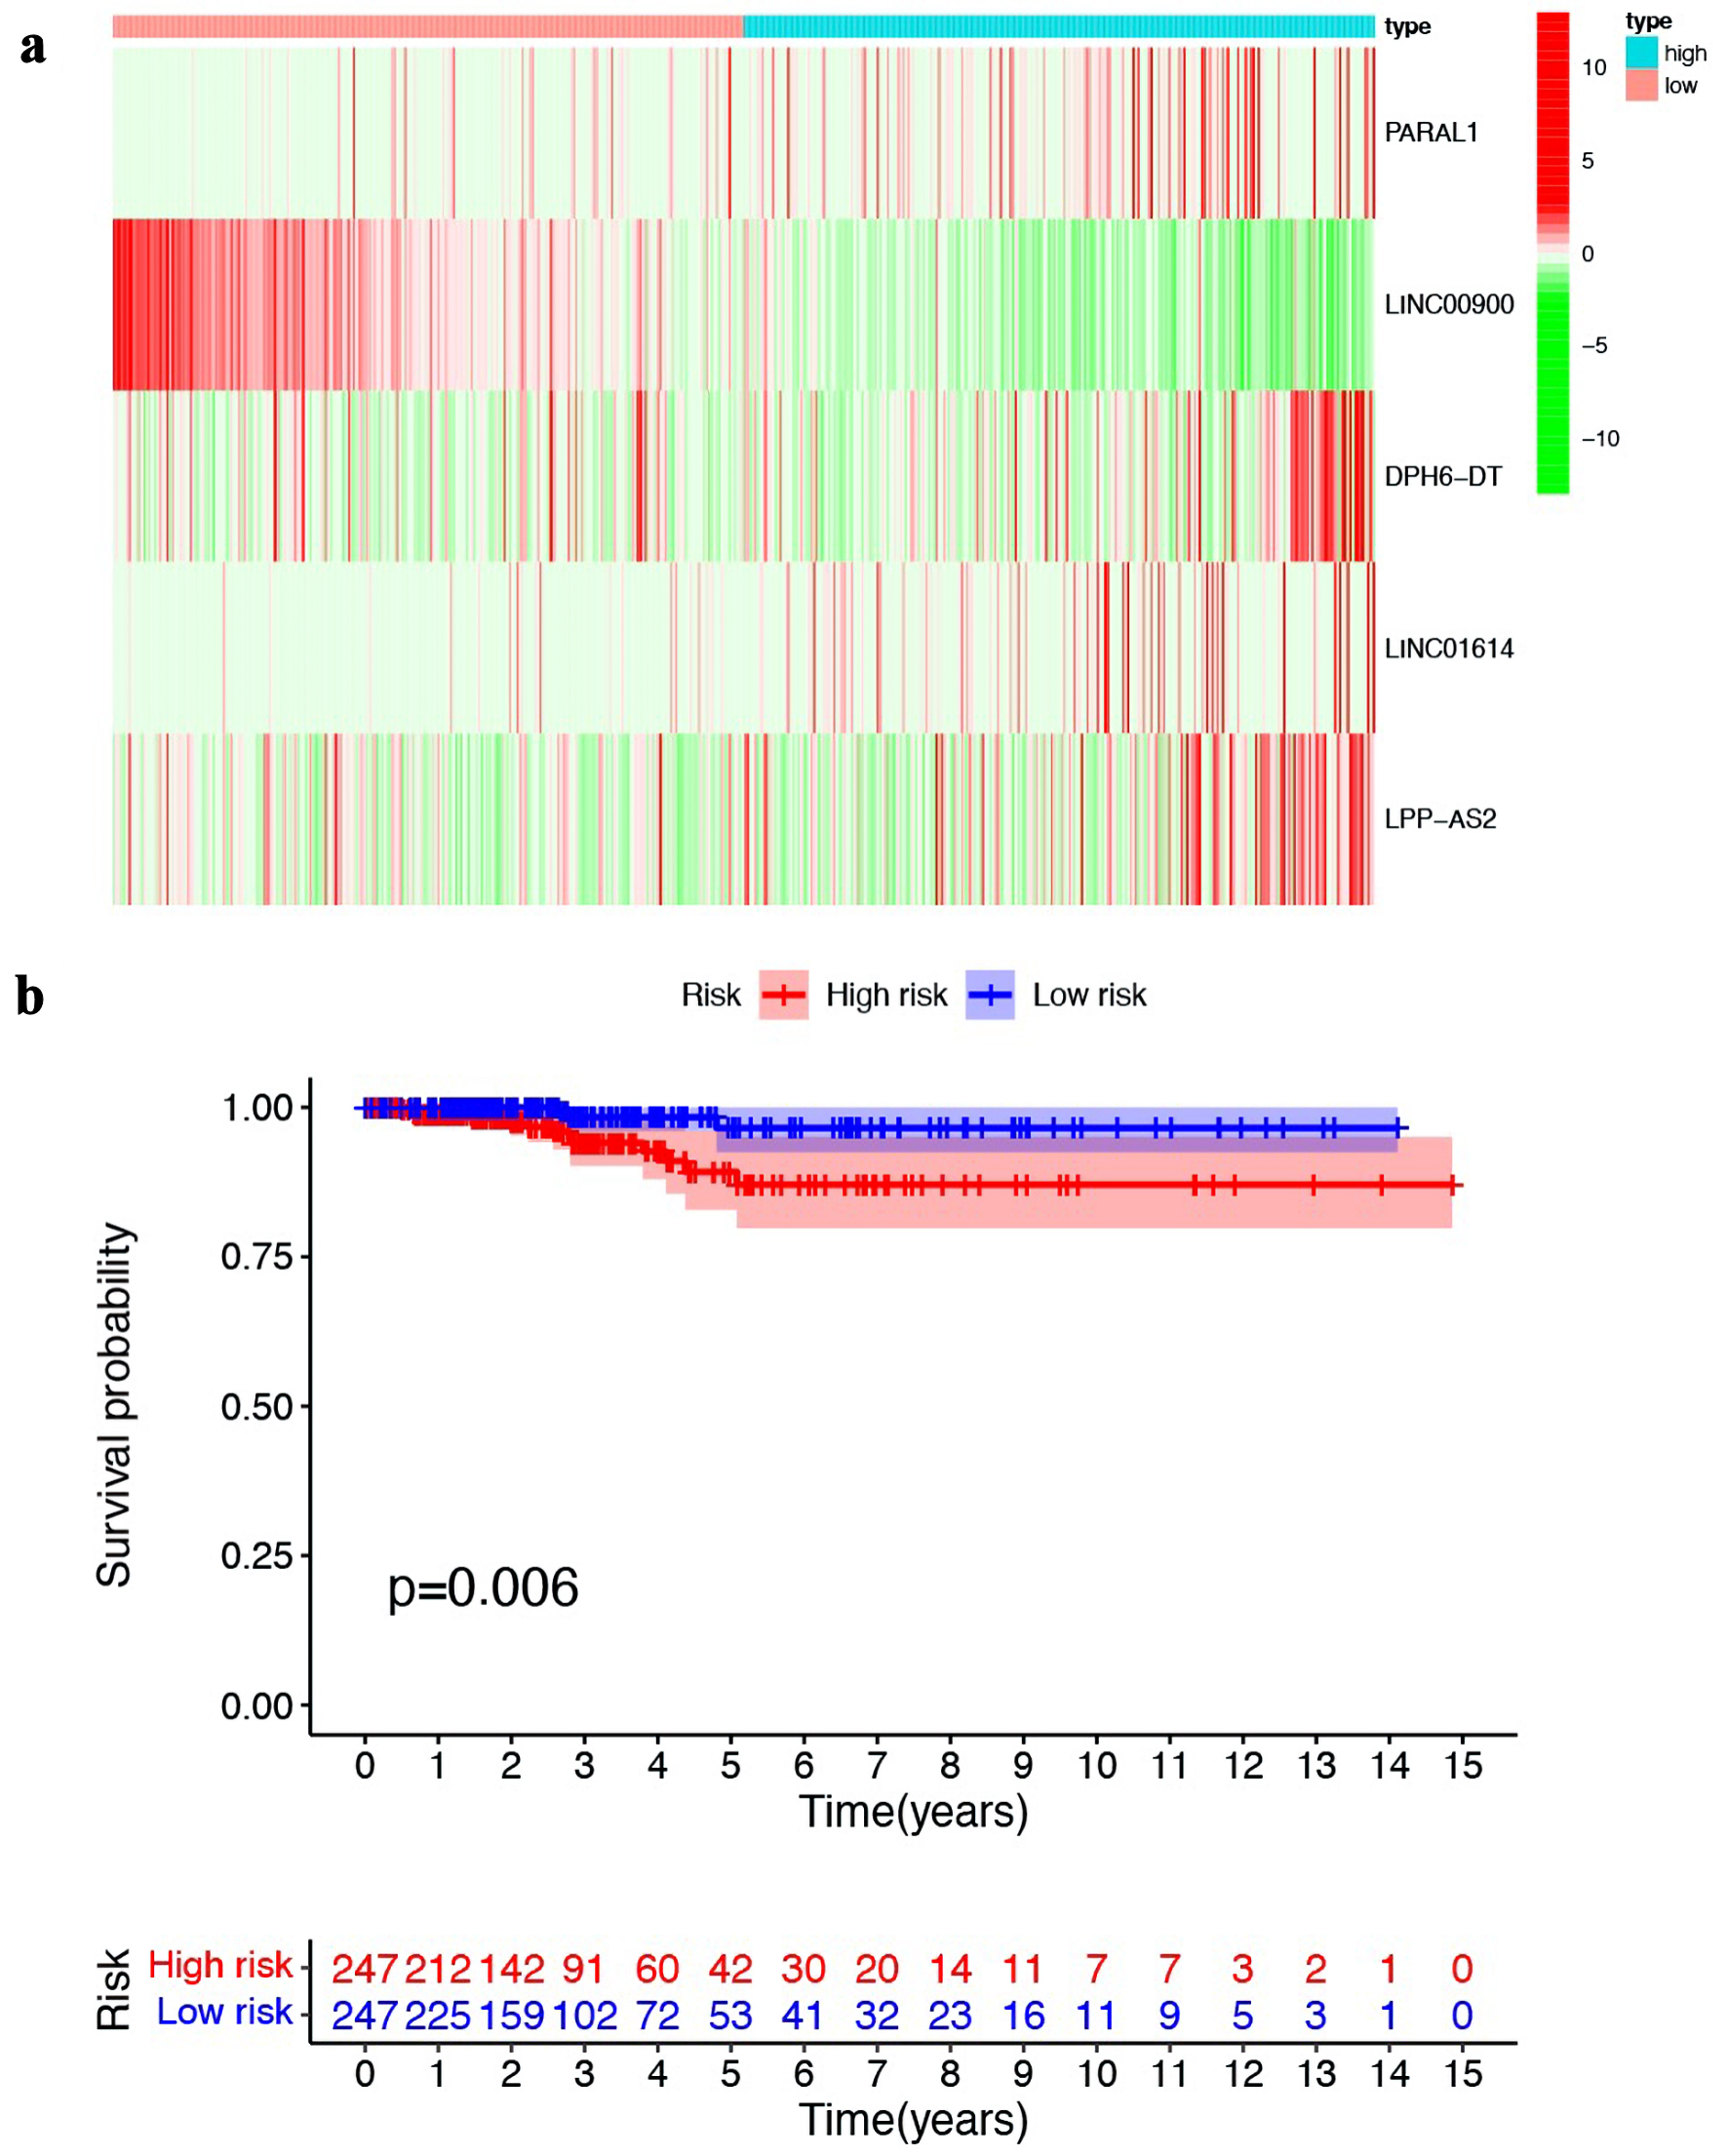
Figure 2. Establishment and validation of prognostic model based on ferroptosis-related lncRNA. (a) Heat map illustrating the expression of the five ferroptosis-related lncRNAs in high- and low-risk groups. (b) Kaplan-Meier survival curves comparing the overall survival of patients in high- and low-risk groups. lncRNA: long non-coding RNA.
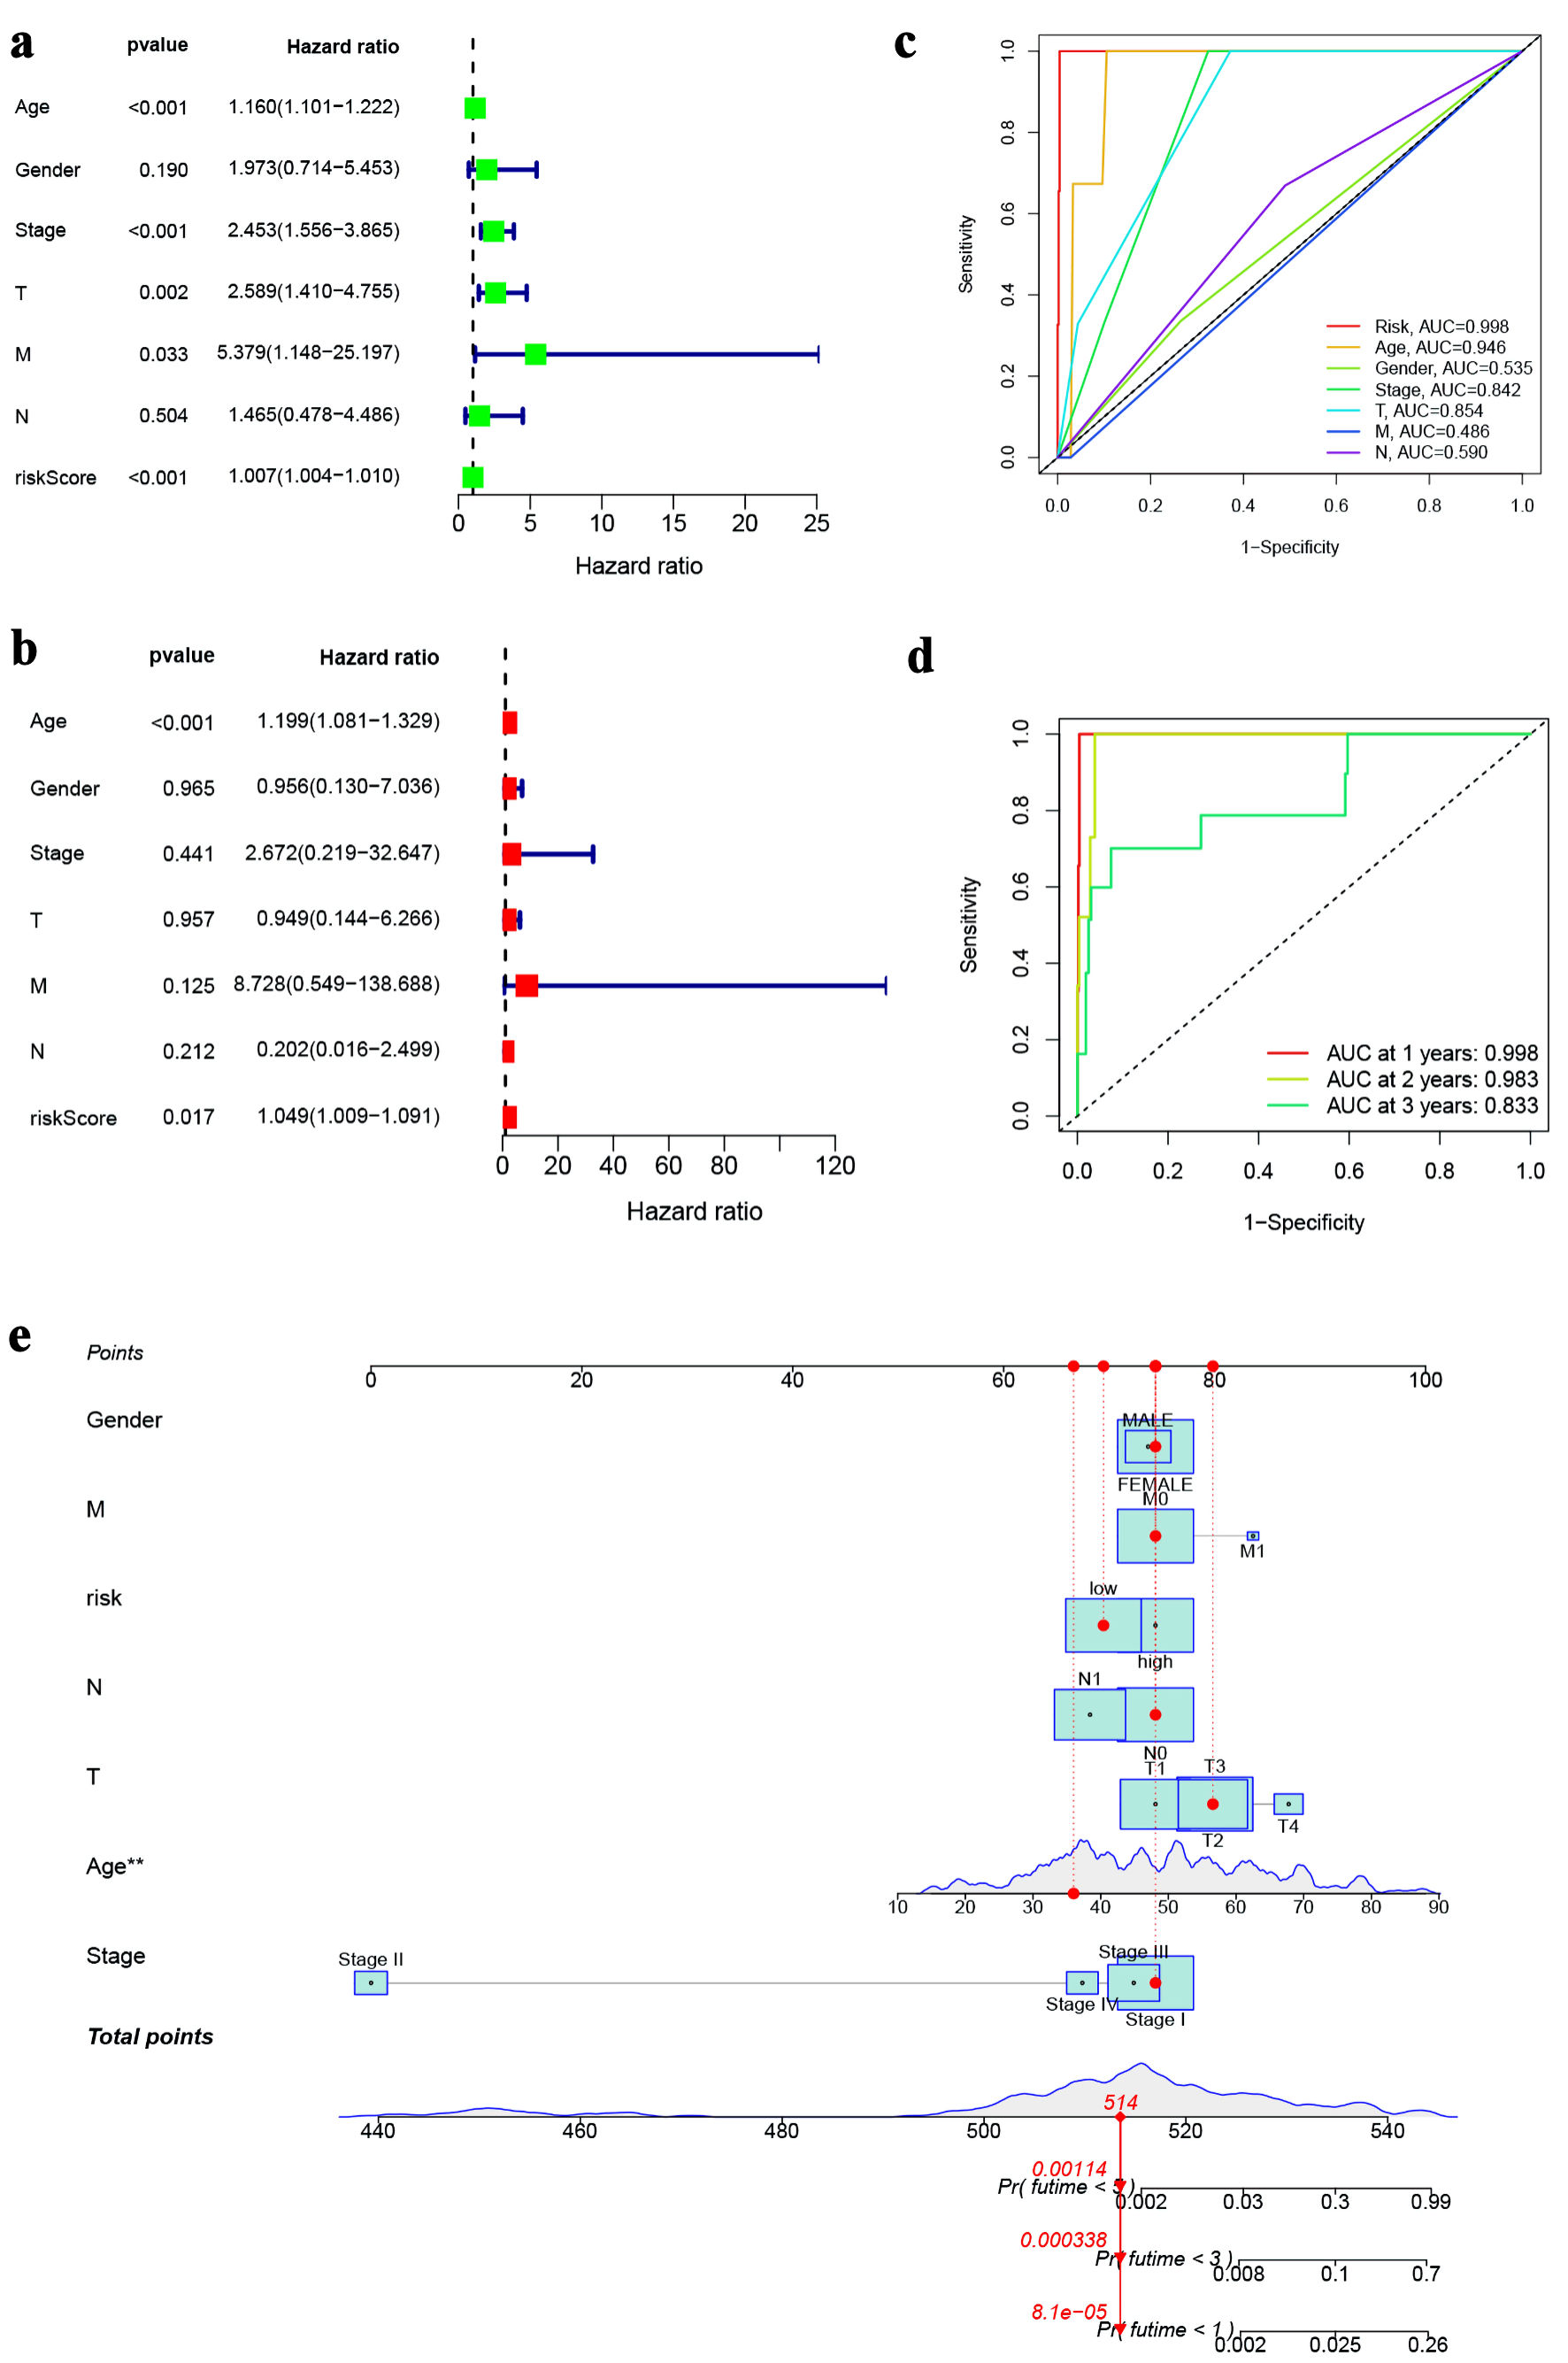
Figure 3. Prognostic value of ferroptosis-associated lncRNA model. (a) Forest plot for univariate cox regression analysis. (b) Forest plot for multivariate Cox regression analysis. (c) ROC curve for the risk score and clinicopathological variables. (d) ROC curve of the risk score at 1, 3, and 5 years. (e) Nomogram based on risk score and clinicopathological variables for predicting 1-, 3-, and 5-year survival rates. lncRNA: long non-coding RNA; ROC: receiver operating characteristic.
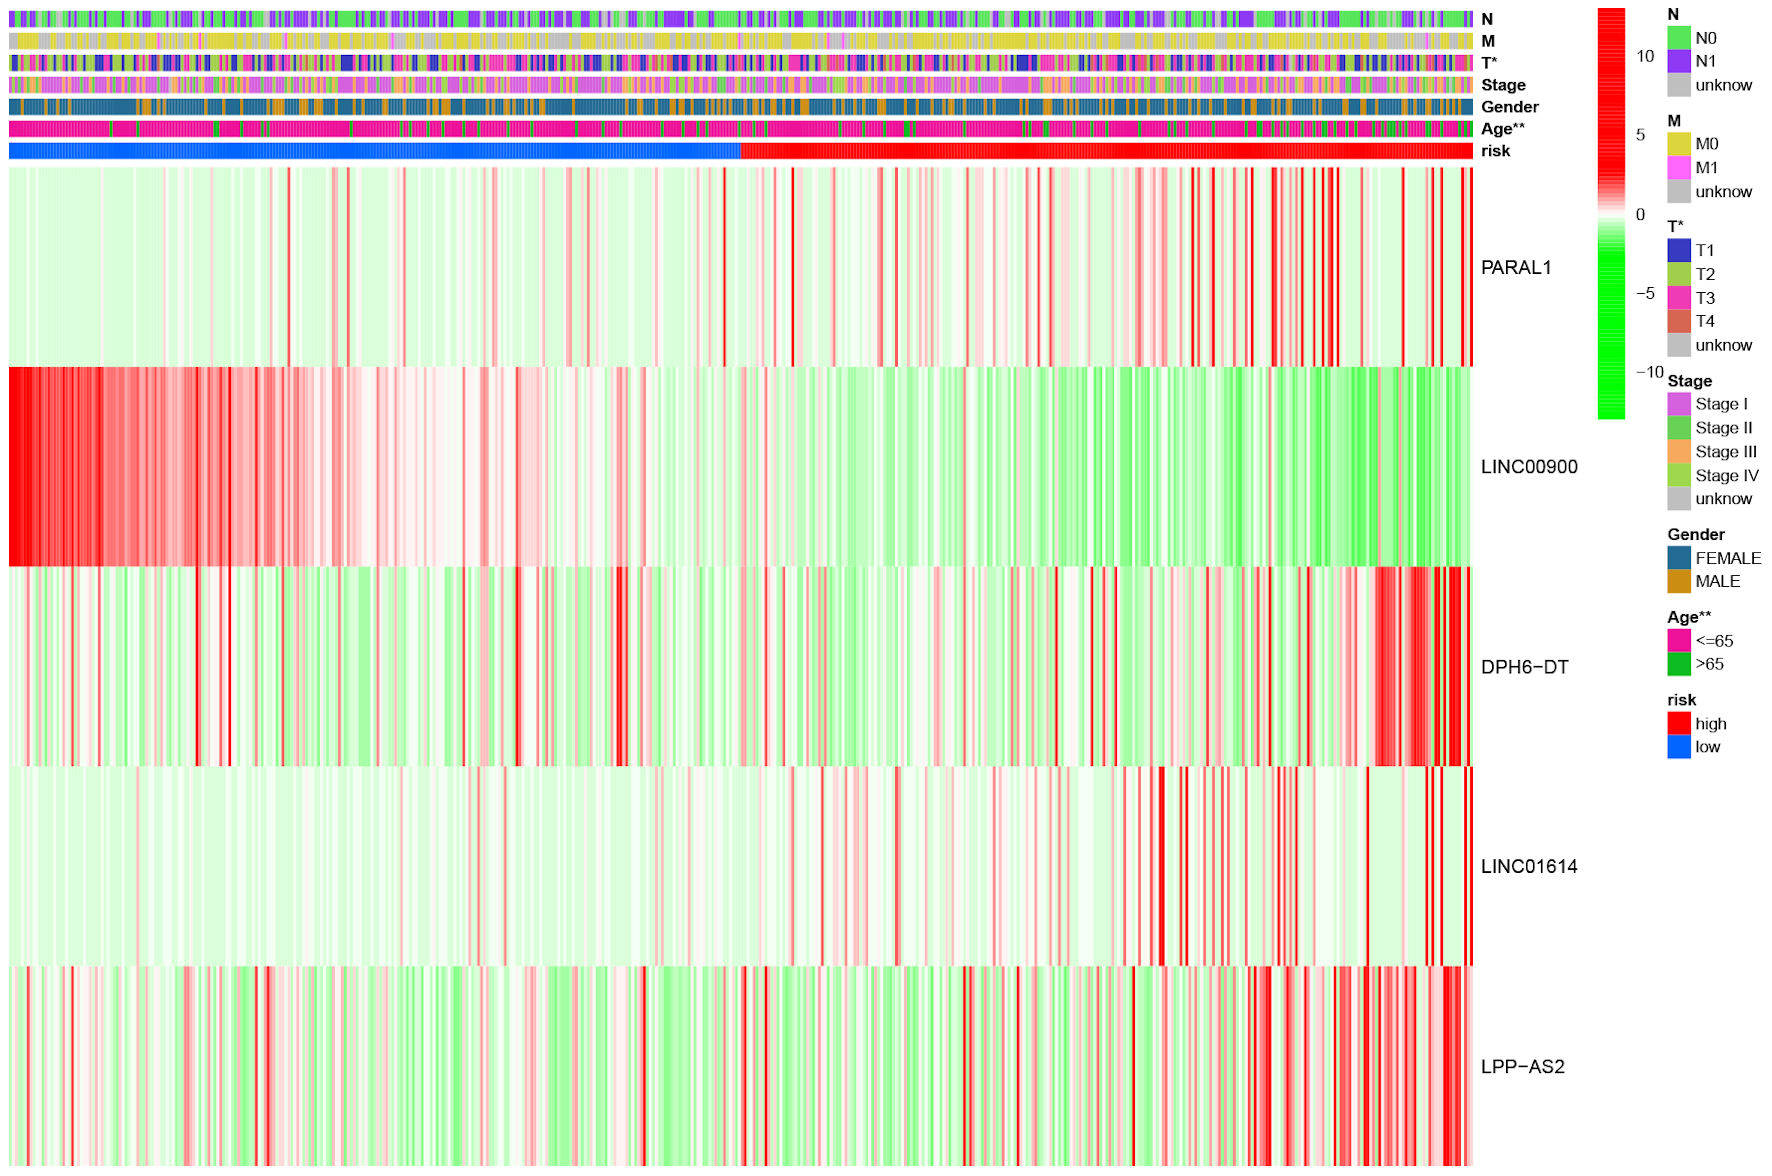
Figure 4. The heat map illustrating the expression of five ferroptosis-related lncRNAs and distribution of clinicopathological variables between high- and low-risk groups. *P < 0.05, **P < 0.01. lncRNA: long non-coding RNA.
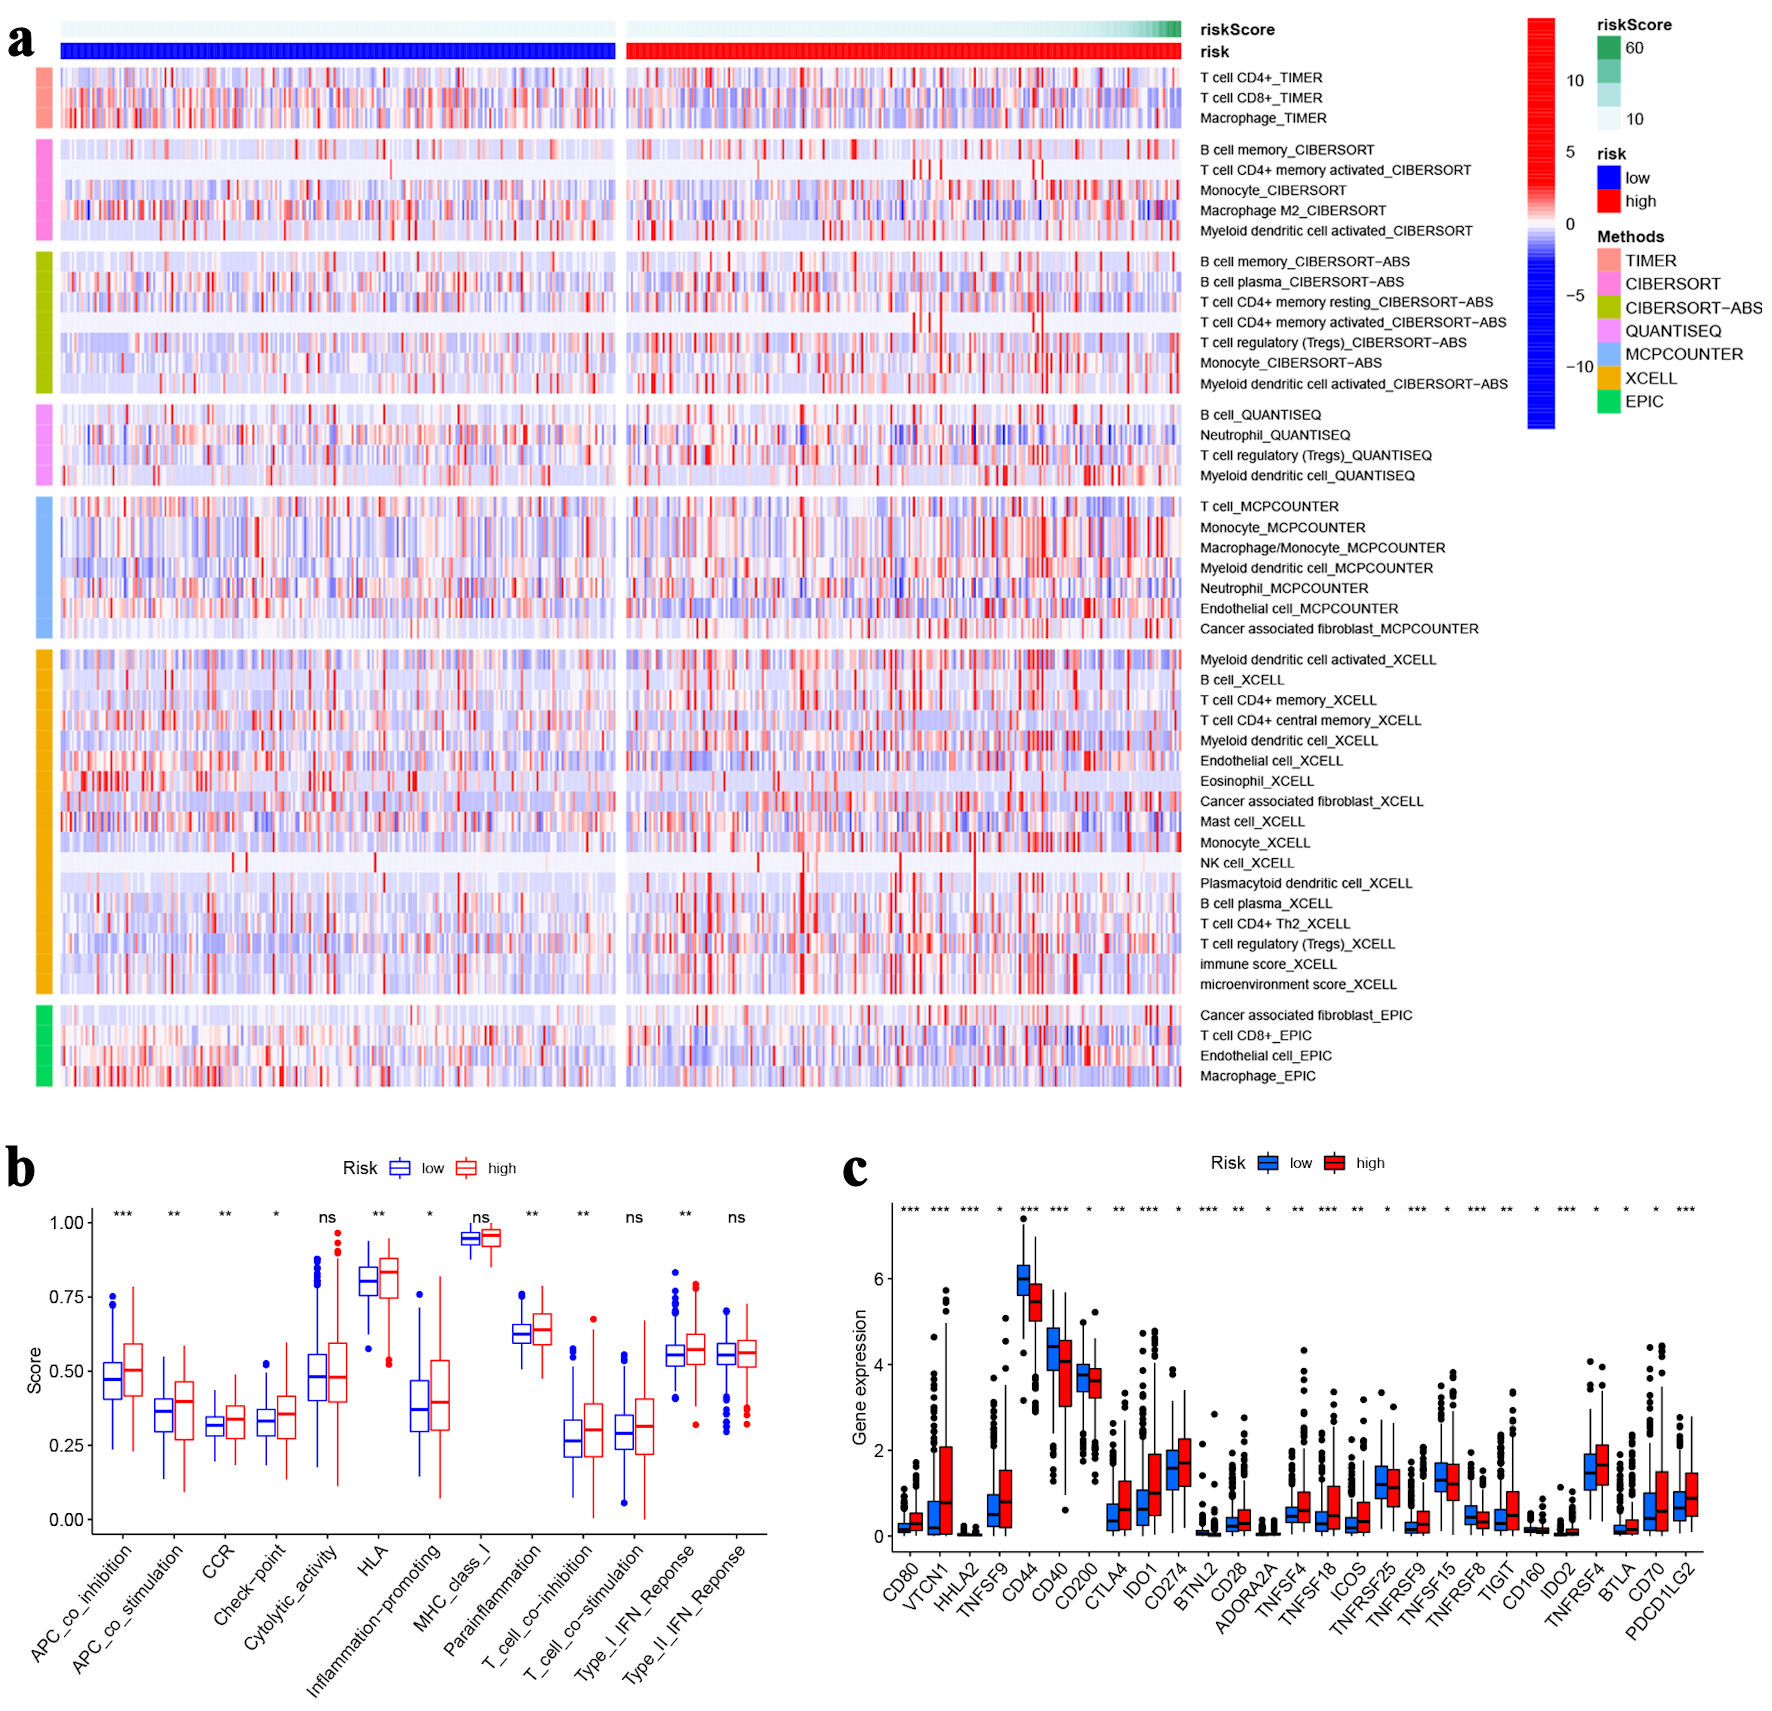
Figure 5. Immune analysis. (a)The heat map visualizing the distribution of immune cells in high- and low-risk groups. (b) Immune function scores between high- and low-risk groups. (c) The expression of immune checkpoint genes in high- and low-risk groups. *P < 0.05, **P < 0.01, ***P < 0.001.
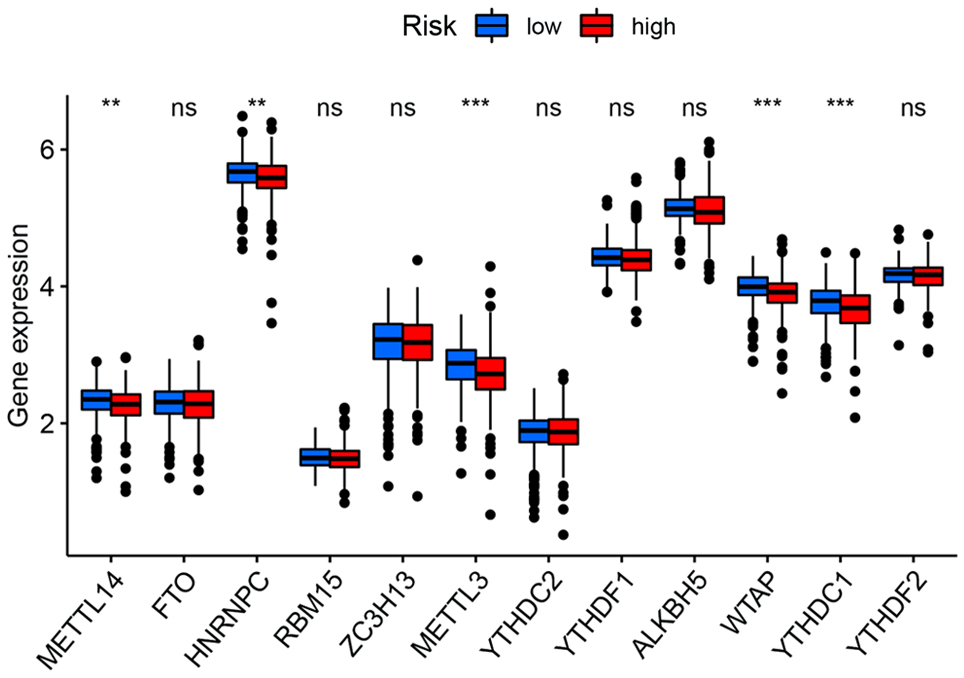
Figure 6. The expression of m6A-related genes between high and low-risk groups. **P < 0.01, ***P < 0.001.
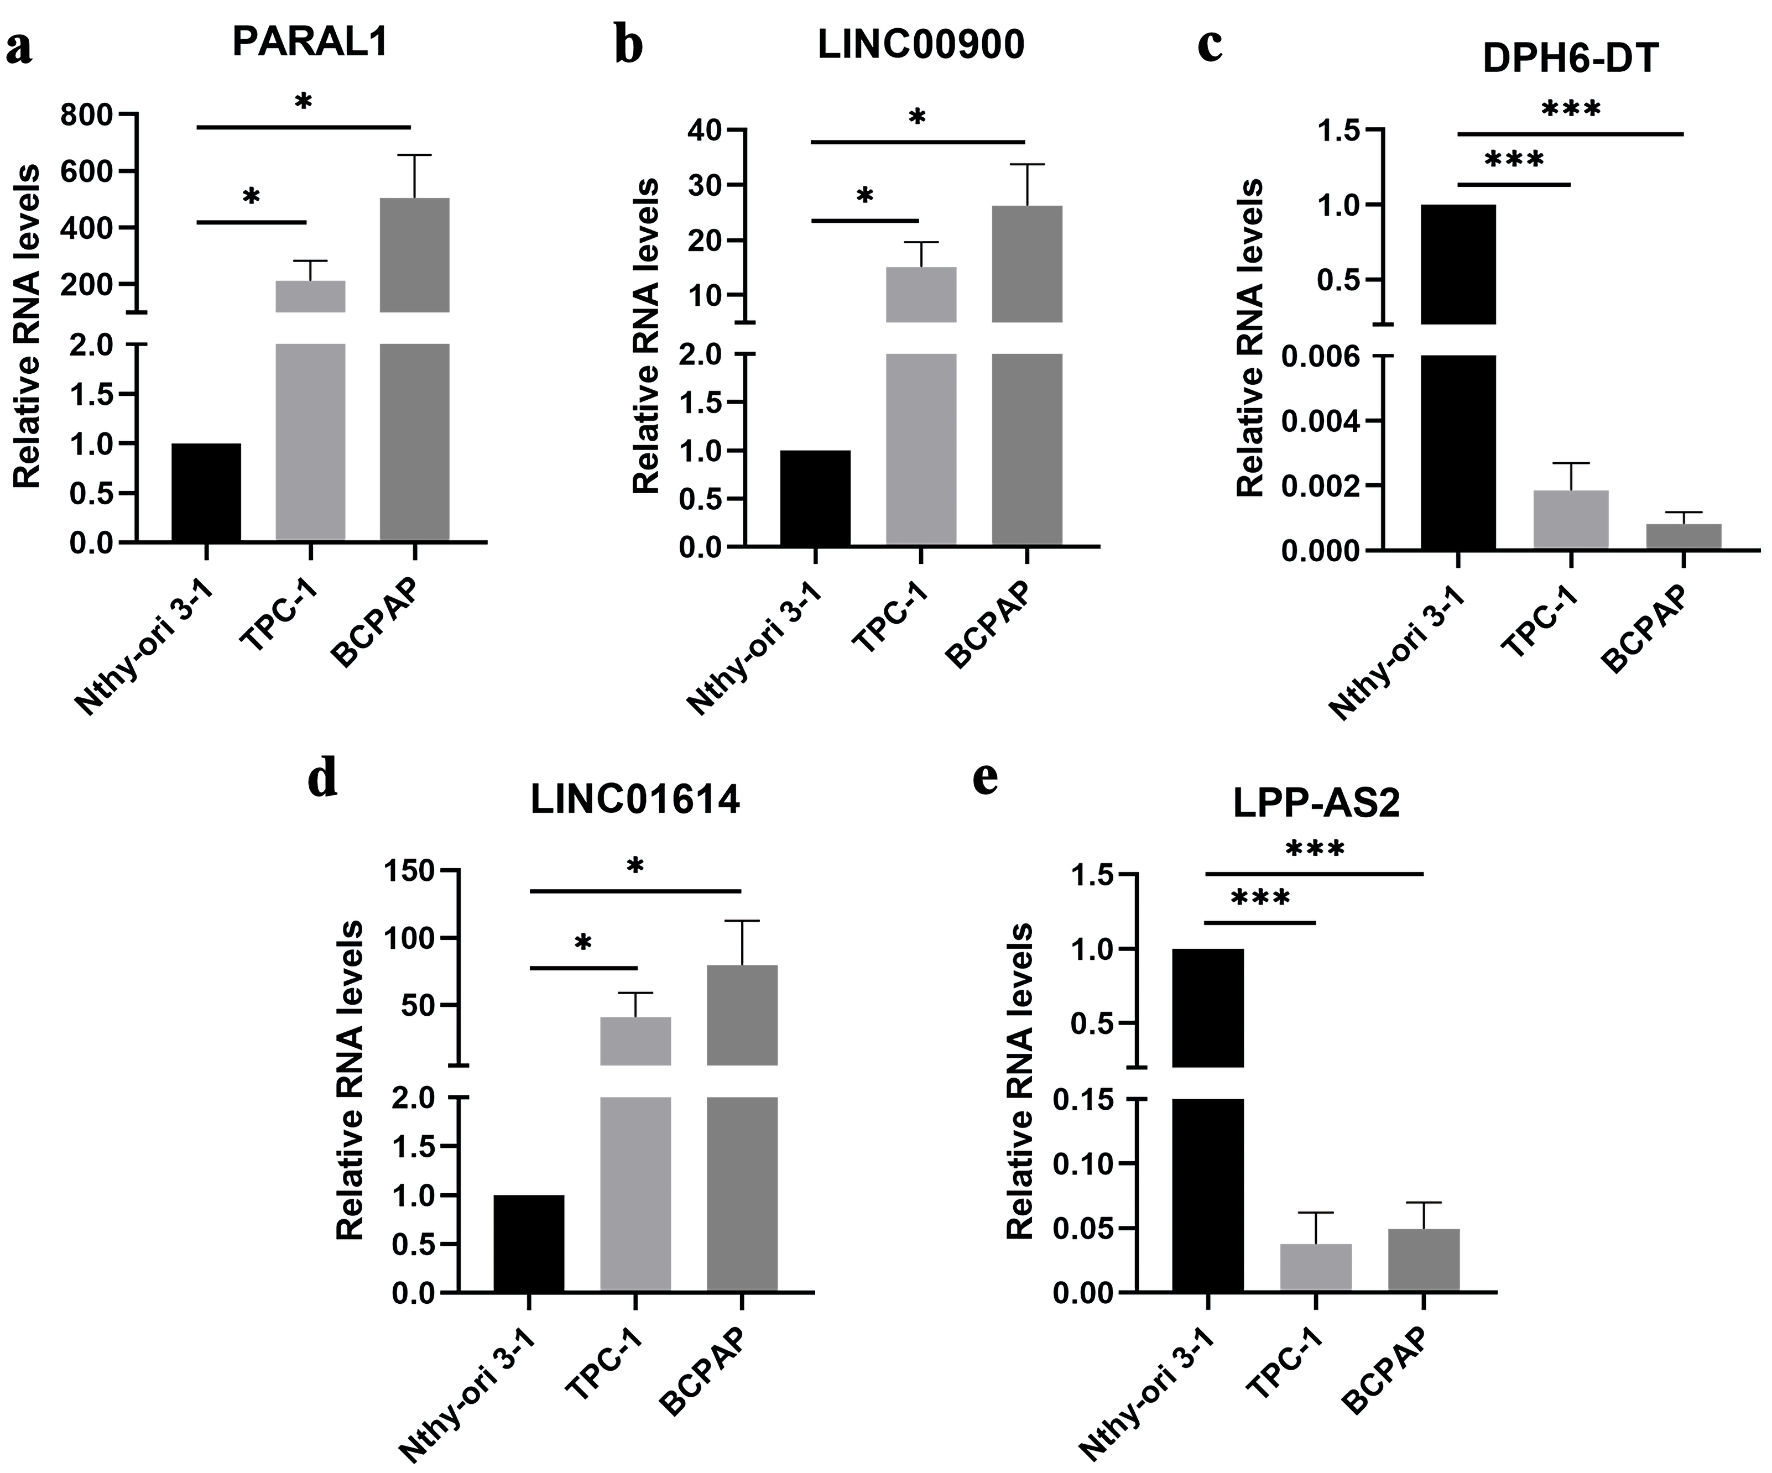
Figure 7. The expression of five ferroptosis-related lncRNAs in Nthy-ori 3-1, TPC-1 and BCPAP cells. Data are presented as mean ± SEM. *P < 0.05, ***P < 0.001. (a) The mRNA expression of PARAL1 in papillary thyroid cancer cell lines. (b) The mRNA expression of LINC00900 in papillary thyroid cancer cell lines. (c) The mRNA expression of DPH6-DT in papillary thyroid cancer cell lines. (d) The mRNA expression of LINC01614 in papillary thyroid cancer cell lines. (e) The mRNA expression of LPP-AS2 in papillary thyroid cancer cell lines. SEM: standard error of the mean. lncRNA: long non-coding RNA.
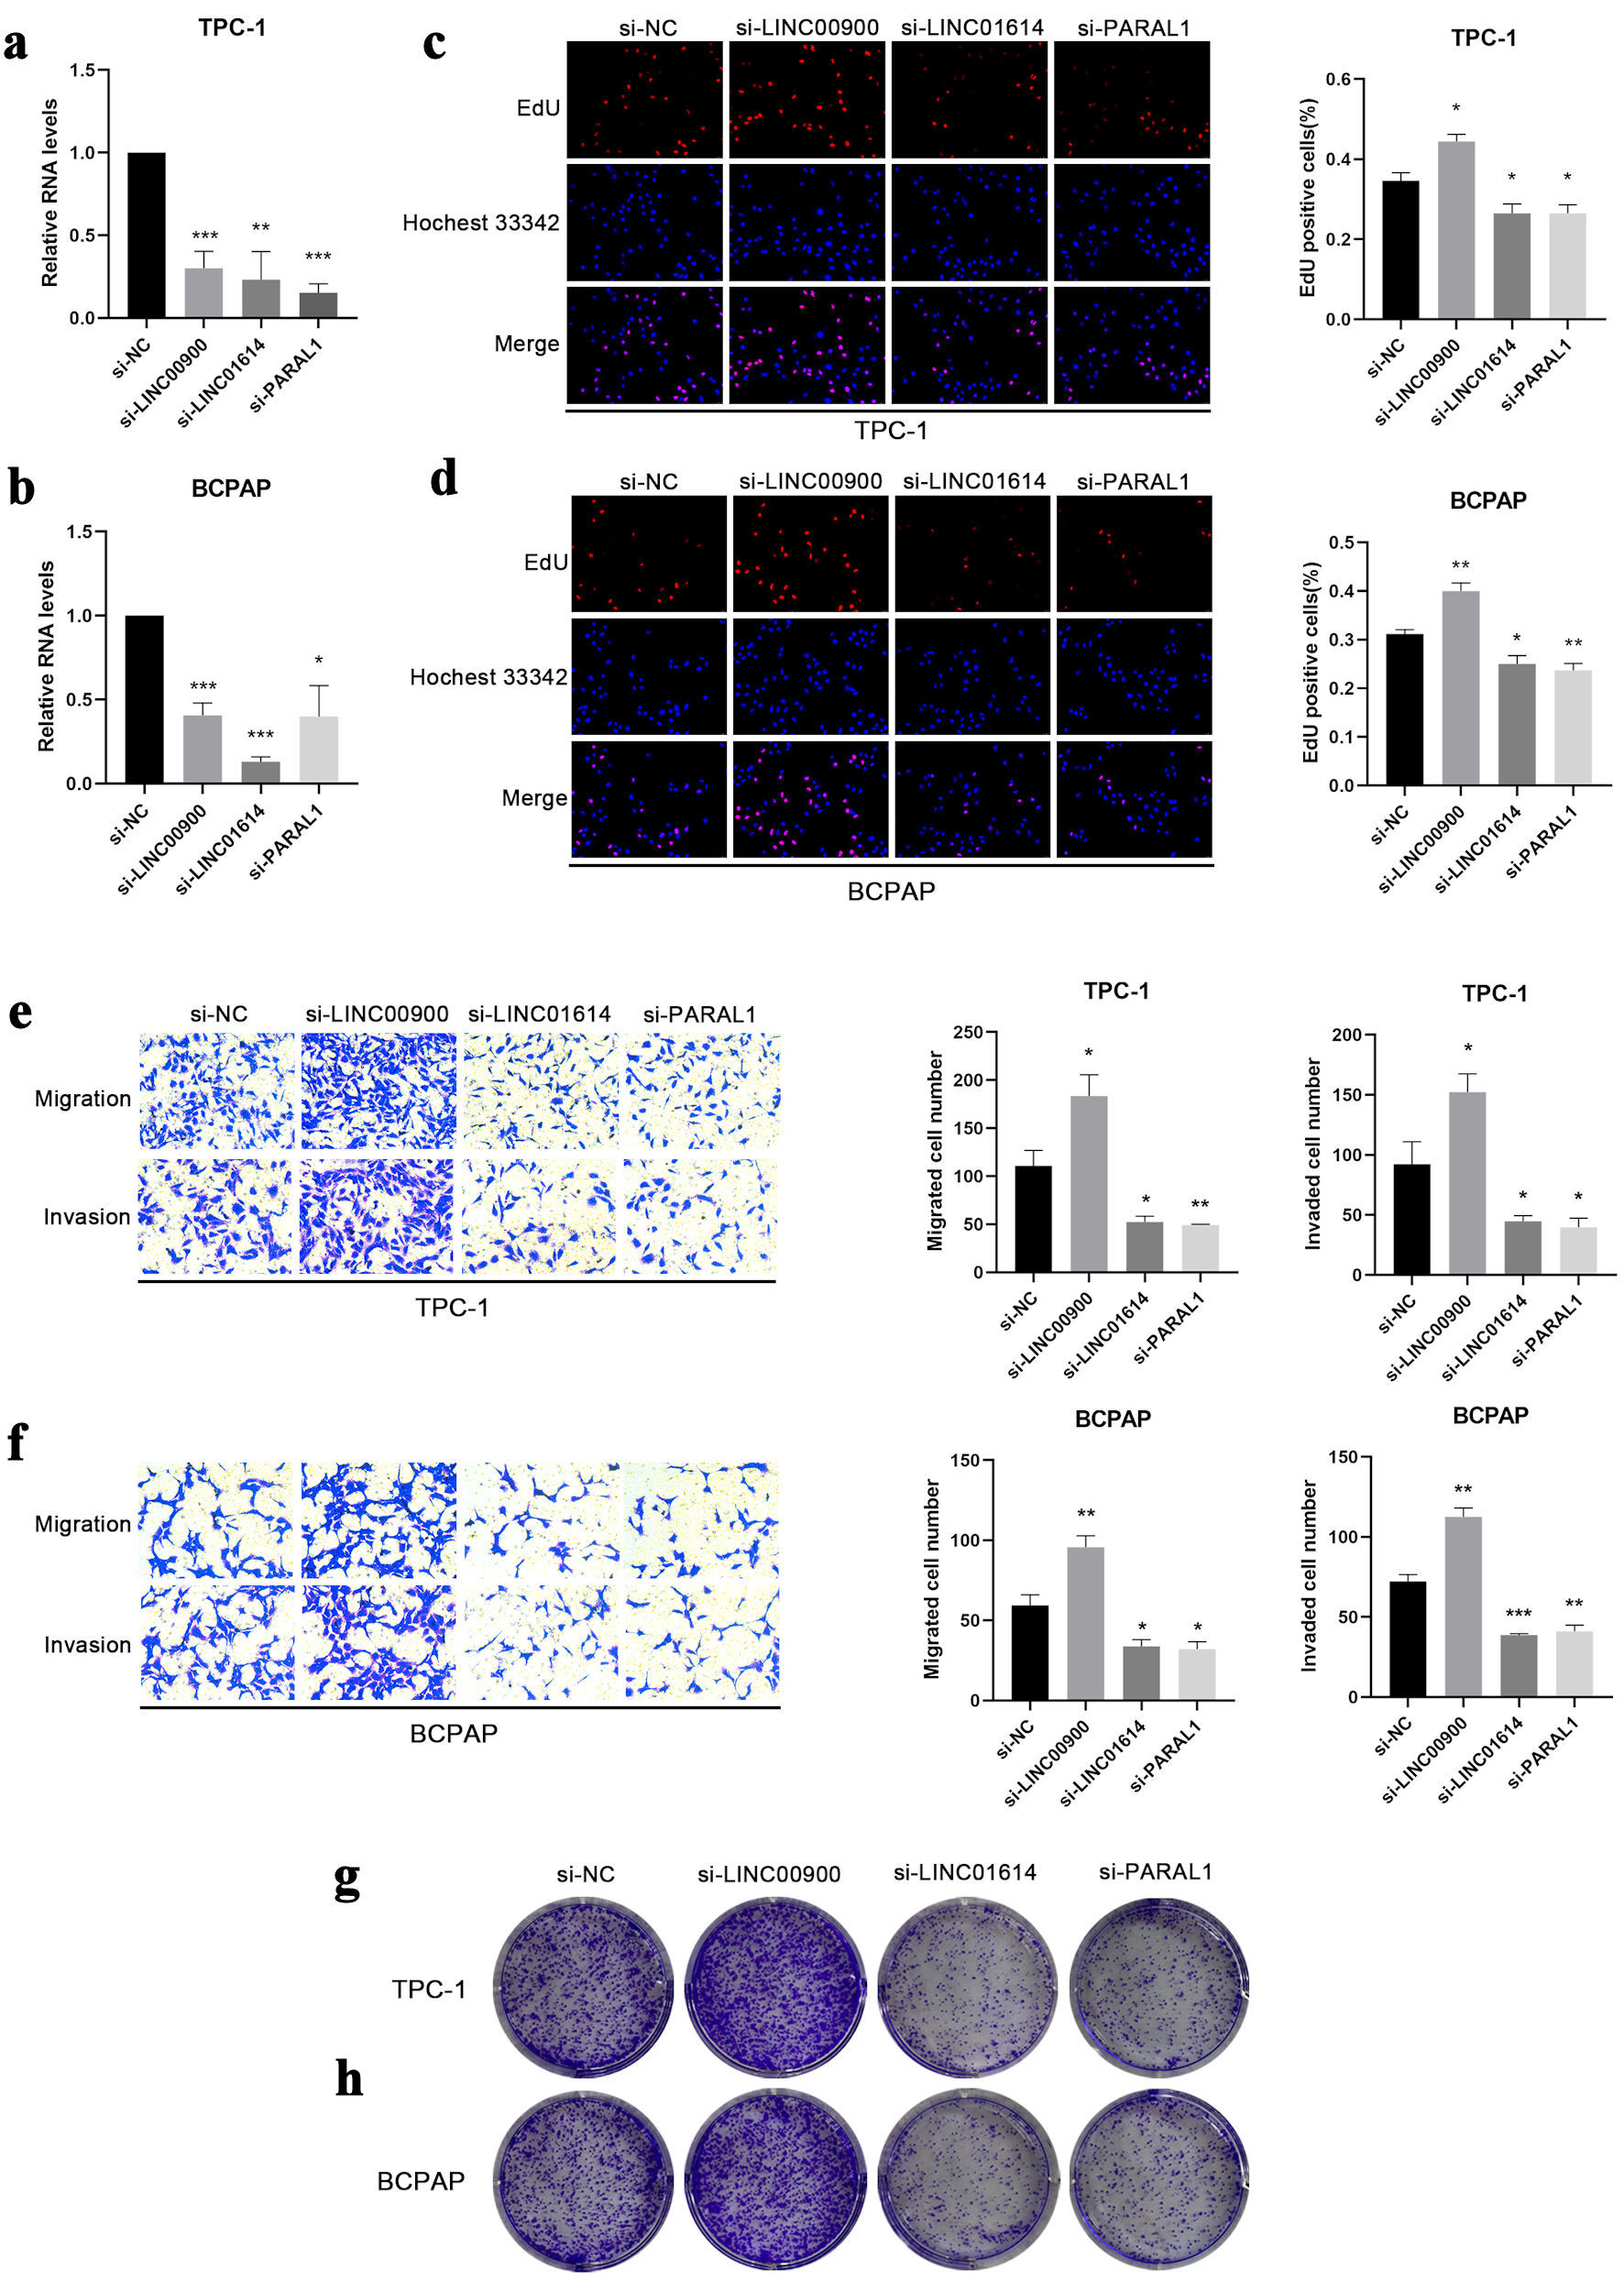
Figure 8. The effect of LINC00900, LINC01614 and PARAL1 on proliferation, colony formation, migration and invasion. (a, b) The expression levels of LINC00900, LINC01614 and PARAL1 after transfected with corresponding siRNA in TPC-1 and BCPAP cells. (c, d) EdU assay illustrating the proliferation of TPC-1 and BCPAP cells following knockdown of LINC00900, LINC01614 and PARAL1. The proliferating cell nuclei were stained with EdU (red), all nuclei were stained with Hoechst 33342 (blue). (e, f) The migration and invasion of TPC-1 and BCPAP cells after suppressing the expression of LINC00900, LINC01614 and PARAL1. (g, h) Cellular clonogenic potential was detected by colony formation assay in TPC-1 and BCPAP cells. Data are presented as mean ± SEM. *P < 0.05, **P < 0.01, ***P < 0.001. SEM: standard error of the mean.
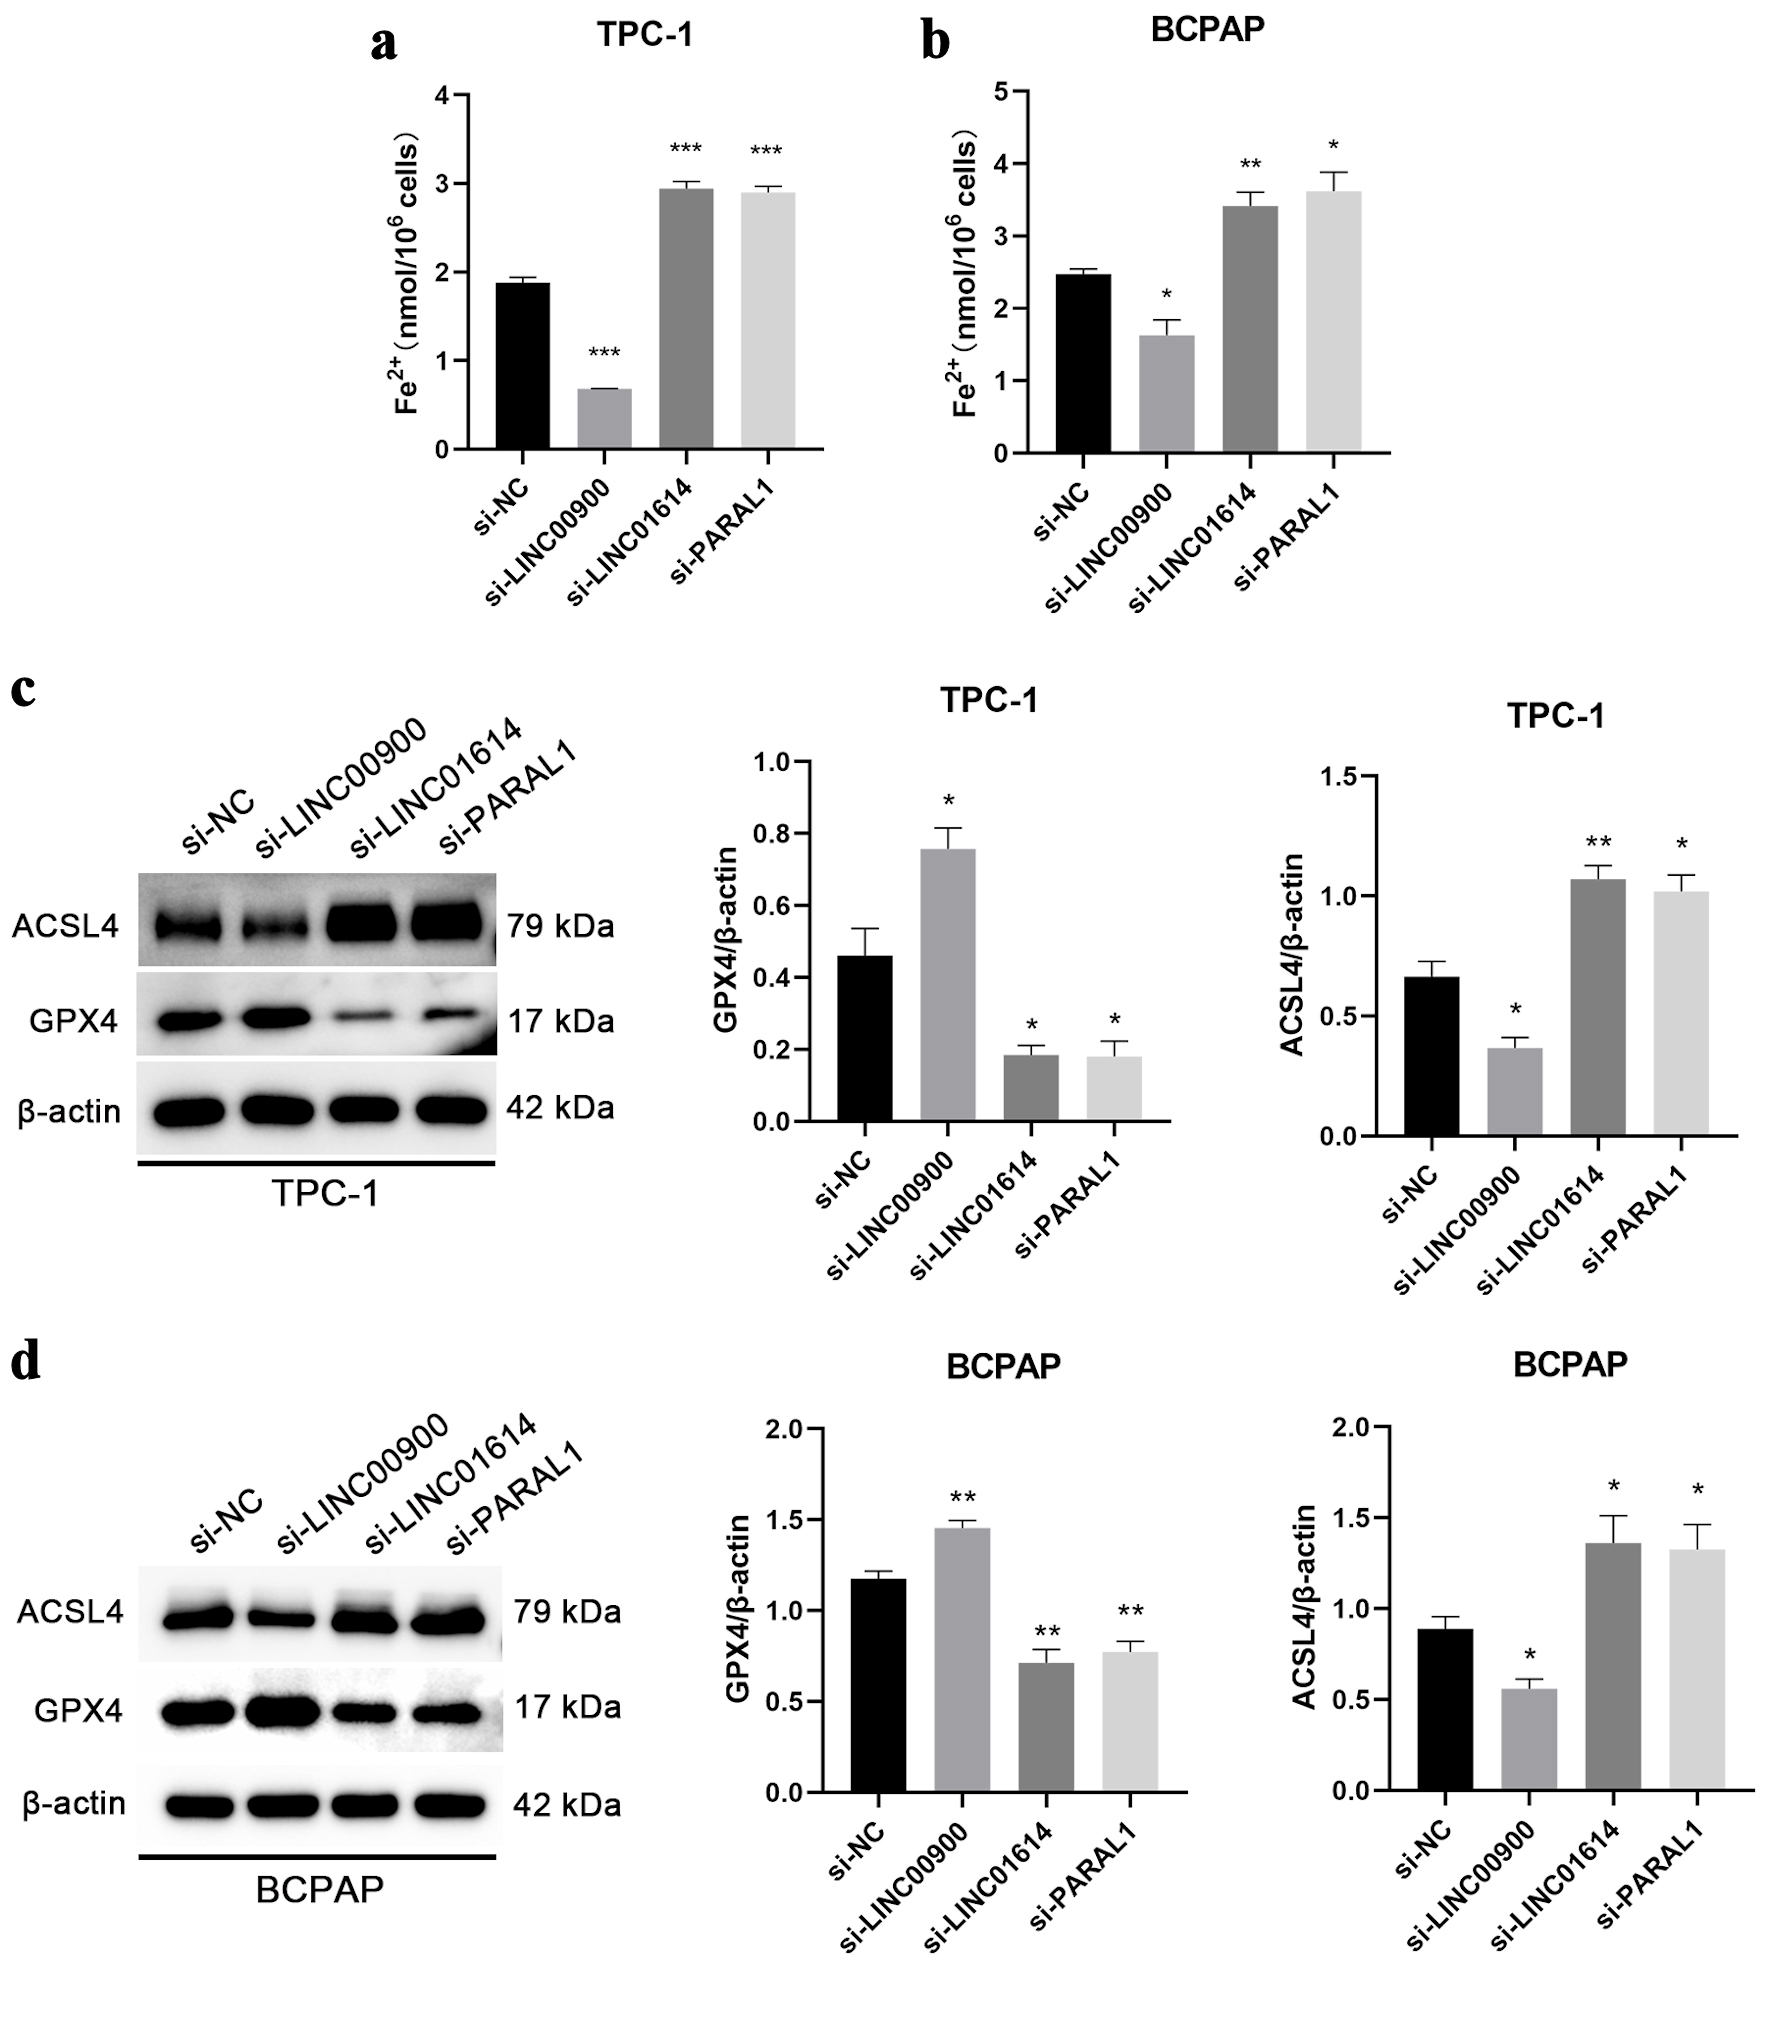
Figure 9. The correlations between LINC00900, LINC01614, PARAL1 and ferroptosis. (a, b) Content of Fe2+ in TPC-1 and BCPAP cells with downregulation of LINC00900, LINC01614 and PARAL1. (c, d) The protein levels of ASCL4 and GPX4 after silencing the expression of LINC00900, LINC01614 and PARAL1. Data are presented as mean ± SEM. *P < 0.05, **P < 0.01, ***P < 0.001. SEM: standard error of the mean.
Table
Table 1. The sequence of Primers
| Gene | Forward (5′ - 3′) | Reverse (5′ - 3′) |
|---|
| PARAL1 | TTGAGATGTCGAGAGCGAGC | CTTGGGCTGTGCTGAGACTA |
| LINC00900 | ATTCGCTCCTCATAGGGACAA | GCTGGGATTAGATGCAGTTCG |
| DPH6-DT | TTGTGAAGGTATGGGCTTGG | GGGATGCCATTCTTCAAACC |
| LINC01614 | TCAGCACTTCGCTCCAAAGG | AGATTCTCCGTGTCTGAAGTCC |
| LPP-AS2 | AACCACCCATTCCACAGACTA | CTCCAAGAGCCCGTATCTC |
| β-actin | GGCTGTATTCCCCTCCATCG | CCAGTTGGTAACAATGCCATGT |