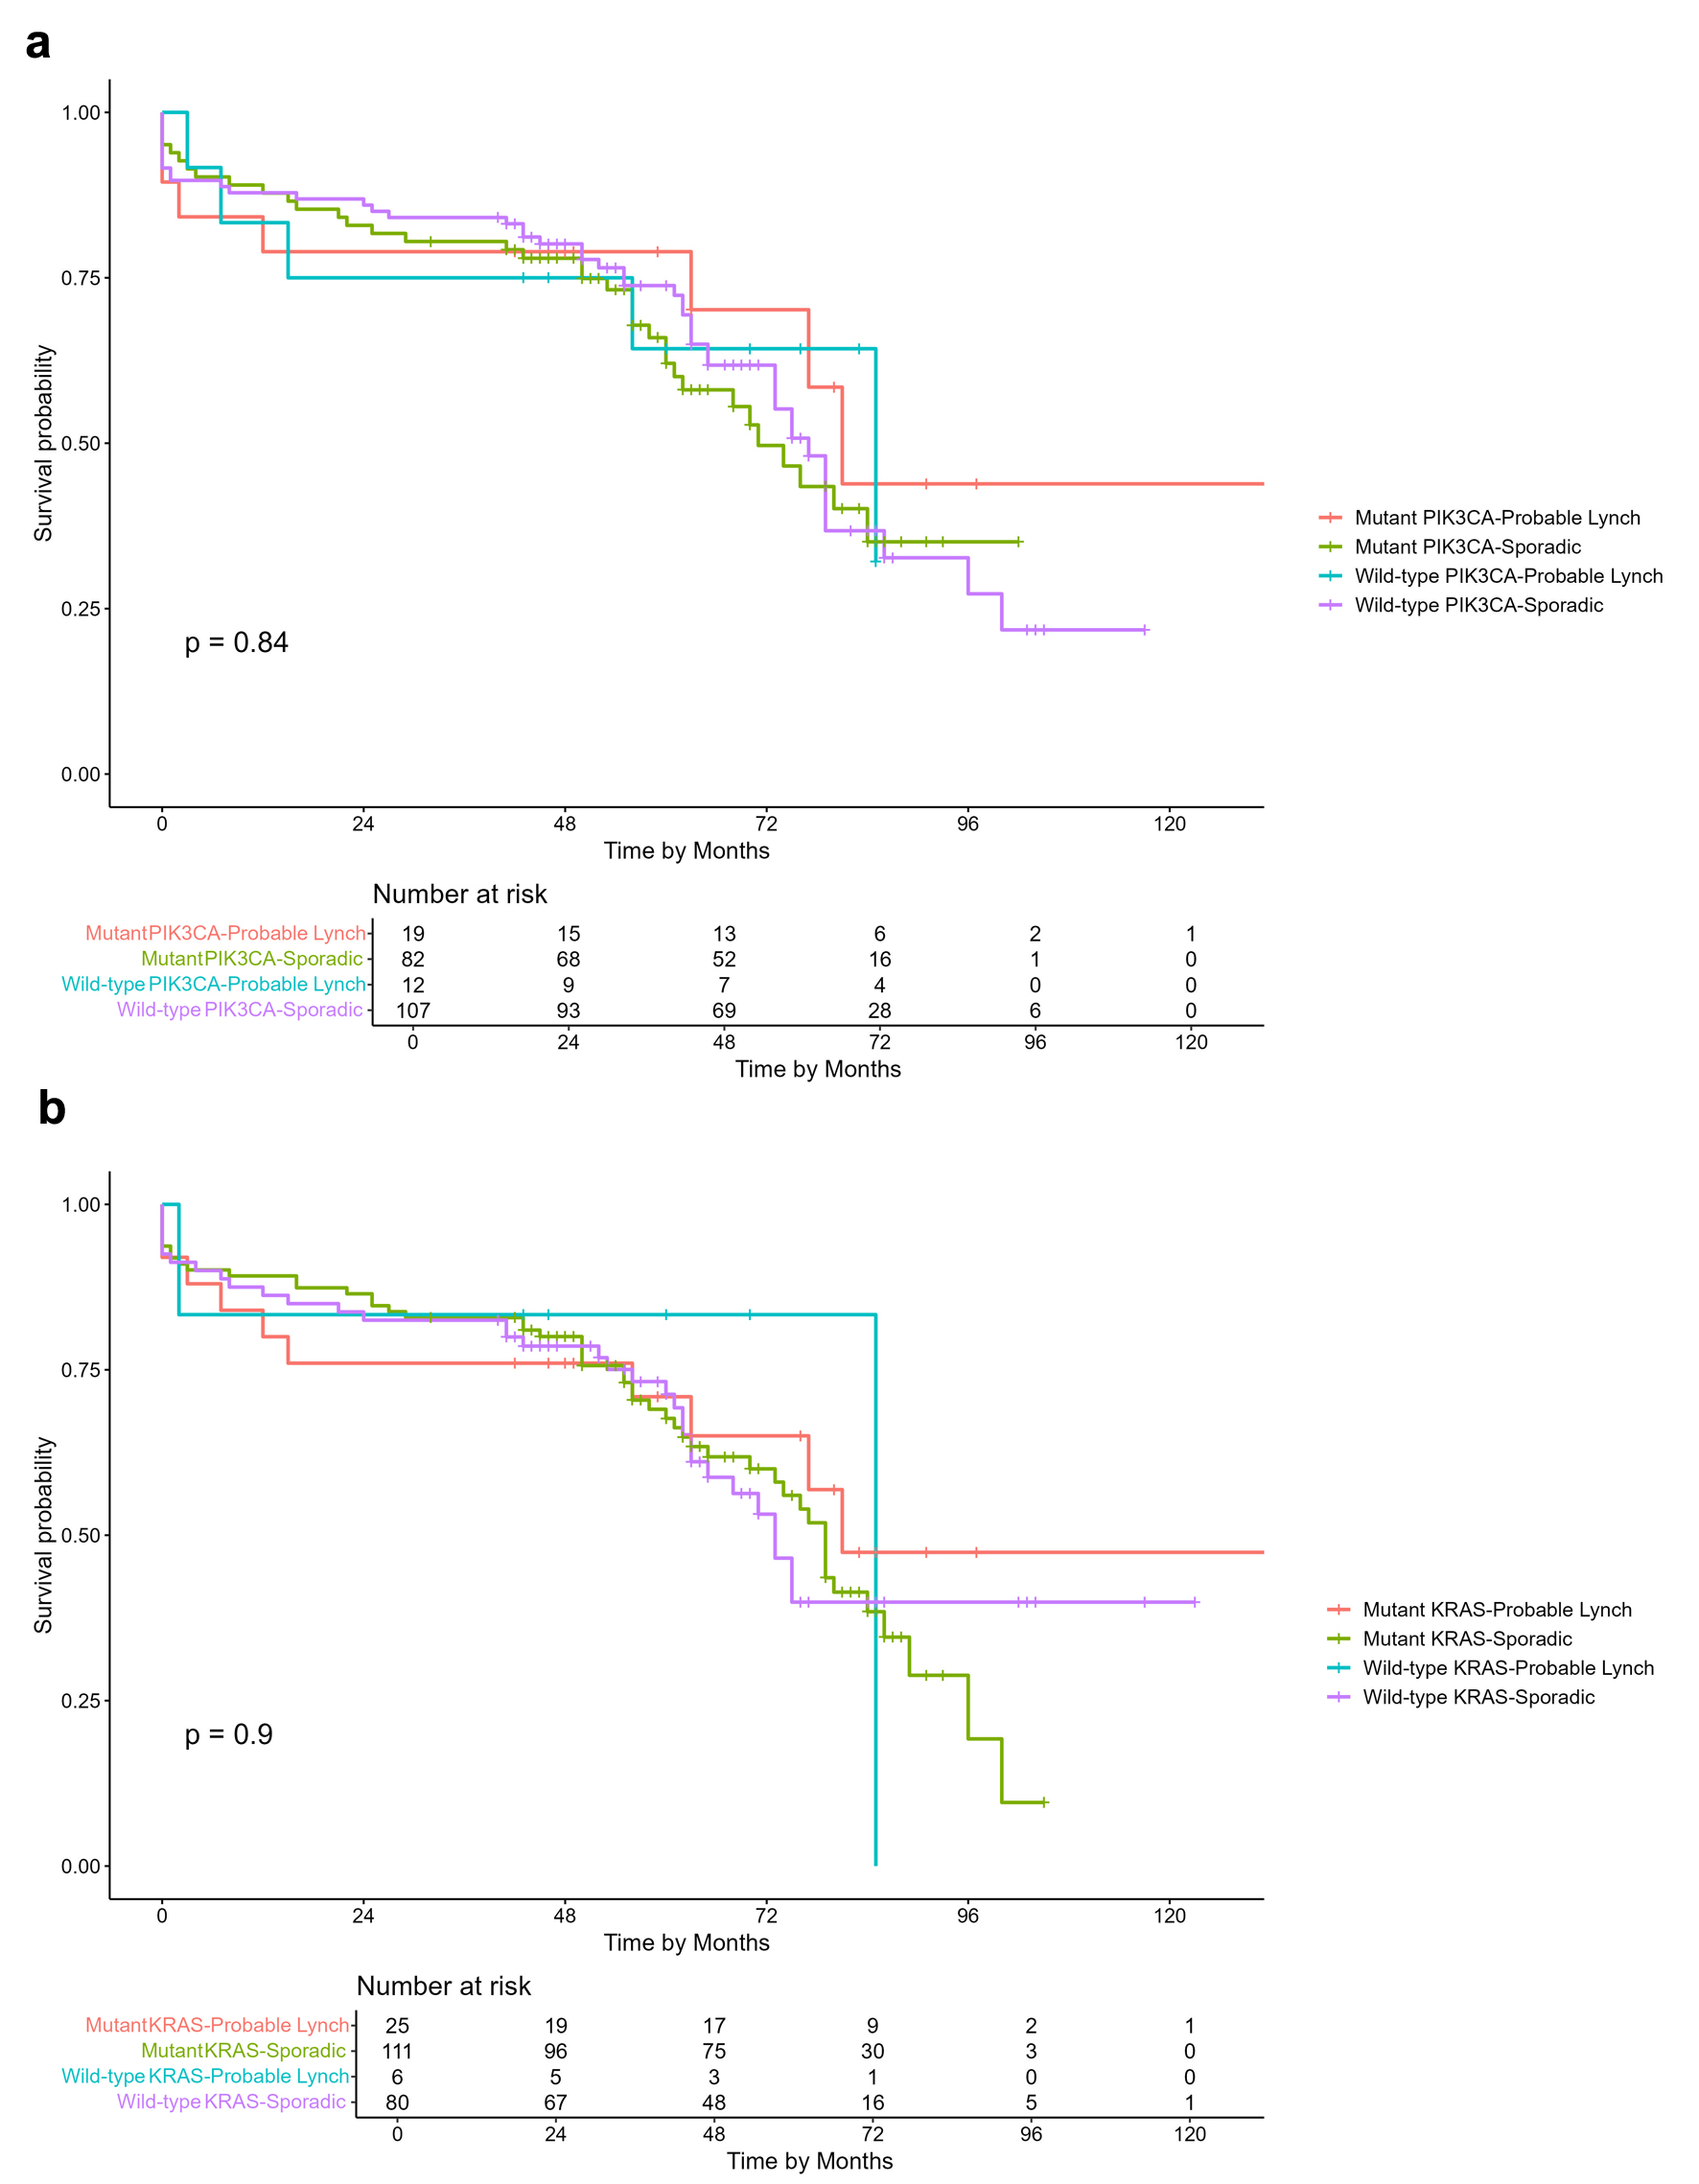
Figure 1. Kaplan-Meier overall survival curves of CRC patients. (a) Overall survival comparison based on PIK3CA mutation and probable Lynch syndrome status. (b) Overall survival comparison based on KRAS mutation and probable Lynch syndrome status.
| World Journal of Oncology, ISSN 1920-4531 print, 1920-454X online, Open Access |
| Article copyright, the authors; Journal compilation copyright, World J Oncol and Elmer Press Inc |
| Journal website https://www.wjon.org |
Original Article
Volume 15, Number 4, August 2024, pages 612-624
High Probability of Lynch Syndrome Among Colorectal Cancer Patients Is Associated With Higher Occurrence of KRAS and PIK3CA Mutations
Figure
Tables
| Characteristic | MSI | |||
|---|---|---|---|---|
| Overall, N = 244a | MSI, N = 42a | MSS, N = 202a | P-valueb | |
| an (%). bFisher’s exact test. *P-value < 0.05. MSI: microsatellite instability. | ||||
| KRAS | 0.038* | |||
| Mutant | 151 (61.88%) | 32 (76.19%) | 119 (58.91%) | |
| Wild-type | 93 (38.11%) | 10 (23.81%) | 83 (41.09%) | |
| KRAS CO BRAF | 0.7 | |||
| Yes | 14 (5.73%) | 3 (7.14%) | 11 (5.45%) | |
| No | 230 (94.26%) | 39 (92.86%) | 191 (94.55%) | |
| PIK3CA | 0.027* | |||
| Mutant | 107 (43.85%) | 25 (59.52%) | 82 (40.59%) | |
| Wild-type | 137 (56.14%) | 17 (40.48%) | 120 (59.41%) | |
| Characteristic | Probable Lynch | |||
|---|---|---|---|---|
| Overall, N = 223a | Yes, N = 32a | No, N = 191a | P-valueb | |
| an (%). bFisher’s exact test. *P-value < 0.05. | ||||
| KRAS | 0.018* | |||
| Mutant | 138 (61.88%) | 26 (81.25%) | 112 (58.64%) | |
| Wild-type | 85 (38.12%) | 6 (18.75%) | 79 (41.36%) | |
| PIK3CA | 0.13 | |||
| Mutant | 103 (46.19%) | 19 (59.38%) | 84 (43.98%) | |
| Wild-type | 120 (53.81%) | 13 (40.63%) | 107 (56.02%) | |
| Characteristic | Overall, N = 244a | PIK3CA | KRAS | ||||
|---|---|---|---|---|---|---|---|
| Mutant, N = 107a | Wild-type, N = 137a | P-valueb | Mutant, N = 151a | Wild-type, N = 93a | P-valueb | ||
| an (%). bFisher’s exact test. *P-value < 0.05. BMI: body mass index; ECOG: Eastern Cooperative Oncology Group; TILs: tumor-infiltrating lymphocytes. | |||||||
| Age | 0.8 | 0.3 | |||||
| < 50 | 53 (21.72%) | 22 (20.56%) | 31 (22.63%)) | 36 (23.84%) | 17 (18.28%) | ||
| ≥ 50 | 191 (78.28%) | 85 (79.44%) | 106 (77.37%) | 115 (76.16%) | 76 (81.72%) | ||
| Sex | 0.040* | 0.6 | |||||
| Female | 123 (50.41%) | 62 (57.94%) | 61 (44.53%) | 74 (49.01%) | 49 (52.69%) | ||
| Male | 121 (49.59%) | 45 (42.06%) | 76 (55.47%) | 77 (50.99%) | 44 (47.31%) | ||
| Tumor site | 0.083 | 0.022* | |||||
| Left | 192 (79.01%) | 79 (73.83%) | 113 (83.09%) | 112 (74.17%) | 80 (86.96%) | ||
| Right | 51 (20.99%) | 28 (26.17%) | 23 (16.91%) | 39 (25.83%) | 12 (13.04%) | ||
| Unknown | 1 | 0 | 1 | 0 | 1 | ||
| Stage | 0.6 | > 0.9 | |||||
| I | 12 (5.08%) | 5 (4.76%) | 7 (5.34%) | 7 (4.86%) | 5 (5.43%) | ||
| II | 70 (29.66%) | 33 (31.43%) | 37 (28.24%) | 43 (29.86%) | 27 (29.35%) | ||
| III | 56 (23.73%) | 28 (26.67%) | 28 (21.37%) | 35 (24.31%) | 21 (22.83%) | ||
| IV | 98 (41.53%) | 39 (37.14%) | 59 (45.04%) | 59 (40.97%) | 39 (42.39%) | ||
| Unknown | 8 | 2 | 6 | 7 | 1 | ||
| Tumor (T) status | > 0.9 | > 0.9 | |||||
| 1 | 3 (1.23%) | 1 (0.94%) | 2 (1.46%) | 2 (1.33%) | 1 (1.08%) | ||
| 2 | 25 (10.29%) | 10 (9.43%) | 15 (10.95%) | 17 (11.33%) | 8 (8.60%) | ||
| 3 | 156 (64.20%) | 71 (66.98%) | 85 (62.04%) | 94 (62.67%) | 62 (66.67%) | ||
| 4 | 59 (24.28%) | 24 (22.64%) | 35 (25.55%) | 37 (24.67%) | 22 (23.66%) | ||
| Unknown | 1 | 1 | 0 | 1 | 0 | ||
| Lymph node (N) status | 0.3 | 0.7 | |||||
| 0 | 121 (51.05%) | 49 (46.67%) | 72 (54.55%) | 77 (53.10%) | 44 (47.83%) | ||
| 1 | 84 (35.44%) | 38 (36.19%) | 46 (34.85%) | 49 (33.79%) | 35 (38.04%) | ||
| 2 | 32 (13.50%) | 18 (17.14%) | 14 (10.61%) | 19 (13.10%) | 13 (14.13%) | ||
| Unknown | 7 | 2 | 5 | 6 | 1 | ||
| Metastasis (M) status | 0.3 | 0.8 | |||||
| 0 | 139 (58.90%) | 66 (62.86%) | 73 (55.73%) | 86 (59.72%) | 53 (57.61%) | ||
| 1 | 97 (41.10%) | 39 (37.14%) | 58 (44.27%) | 58 (40.28%) | 39 (42.39%) | ||
| Unknown | 8 | 2 | 6 | 7 | 1 | ||
| Histological grading | 0.4 | 0.038* | |||||
| 1 | 107 (44.77%) | 47 (45.19%) | 60 (44.44%) | 67 (45.89%) | 40 (43.01%) | ||
| 2 | 99 (41.42%) | 40 (38.46%) | 59 (43.70%) | 55 (37.67%) | 44 (47.31%) | ||
| 3 | 31 (12.97%) | 17 (16.35%) | 14 (10.37%) | 24 (16.44%) | 7 (7.53%) | ||
| 4 | 2 (0.84%) | 0 (0.00%) | 2 (1.48%) | 0 (0.00%) | 2 (2.15%) | ||
| Unknown | 5 | 3 | 2 | 5 | 0 | ||
| Lymphovascular invasion status | 0.3 | > 0.9 | |||||
| 0 | 51 (46.36%) | 27 (51.92%) | 24 (41.38%) | 29 (46.77%) | 22 (45.83%) | ||
| 1 | 59 (53.64%) | 25 (48.08%) | 34 (58.62%) | 33 (53.23%) | 26 (54.17%) | ||
| Unknown | 134 | 55 | 79 | 89 | 45 | ||
| Pathological morphology | 0.2 | 0.7 | |||||
| Adenocarcinoma | 239 (97.95%) | 103 (96.26%) | 136 (99.27%) | 147 (97.35%) | 92 (98.92%) | ||
| Mucinous carcinoma | 5 (2.05%) | 4 (3.74%) | 1 (0.73%) | 4 (2.65%) | 1 (1.08%) | ||
| TILs | 0.023* | 0.6 | |||||
| High | 80 (39.41%) | 26 (30.23%) | 54 (46.15%) | 46 (36.80%) | 34 (43.59%) | ||
| Medium | 78 (38.42%) | 34 (39.53%) | 44 (37.61%) | 51 (40.80%) | 27 (34.62%) | ||
| Low | 45 (22.17%) | 26 (30.23%) | 19 (16.24%) | 28 (22.40%) | 17 (21.79%) | ||
| Unknown | 41 | 21 | 20 | 26 | 15 | ||
| BMI (kg/m2) | 0.3 | 0.081 | |||||
| < 18.5 | 72 (30.77%) | 33 (32.67%) | 39 (29.32%) | 42 (28.97%) | 30 (33.71%) | ||
| ≥ 25 | 33 (14.10%) | 18 (17.82%) | 15 (11.28%) | 18 (12.41%) | 15 (16.85%) | ||
| 18.5 - 22.9 | 97 (41.45%) | 36 (35.64%) | 61 (45.86%) | 69 (47.59%) | 28 (31.46%) | ||
| 23 - 24.9 | 32 (13.68%) | 14 (13.86%) | 18 (13.53%) | 16 (11.03%) | 16 (17.98%) | ||
| Unknown | 10 | 6 | 4 | 6 | 4 | ||
| Hemoglobin level (g/dL) | > 0.9 | 0.9 | |||||
| < 10 | 48 (20.51%) | 21 (20.59%) | 27 (20.45%) | 30 (21.13%) | 18 (19.57%) | ||
| ≥ 10 | 186 (79.49%) | 81 (79.41%) | 105 (79.55%) | 112 (78.87%) | 74 (80.43%) | ||
| Unknown | 10 | 5 | 5 | 9 | 1 | ||
| ECOG | 0.5 | 0.7 | |||||
| 0 - 1 | 154 (73.33%) | 72 (75.79%) | 82 (71.30%) | 98 (75.38%) | 56 (70.00%) | ||
| 2 | 38 (18.10%) | 14 (14.74%) | 24 (20.87%) | 22 (16.92%) | 16 (20.00%) | ||
| 3 - 4 | 18 (8.57%) | 9 (9.47%) | 9 (7.83%) | 10 (7.69%) | 8 (10.00%) | ||
| Unknown | 34 | 12 | 22 | 21 | 13 | ||