World Journal of Oncology, ISSN 1920-4531 print, 1920-454X online, Open Access
Article copyright, the authors; Journal compilation copyright, World J Oncol and Elmer Press Inc
Journal website https://www.wjon.org

Original Article

Volume 15, Number 3, June 2024, pages 432-453


Epidemiology of Adenosquamous Carcinomas

Figures

Figure 1.
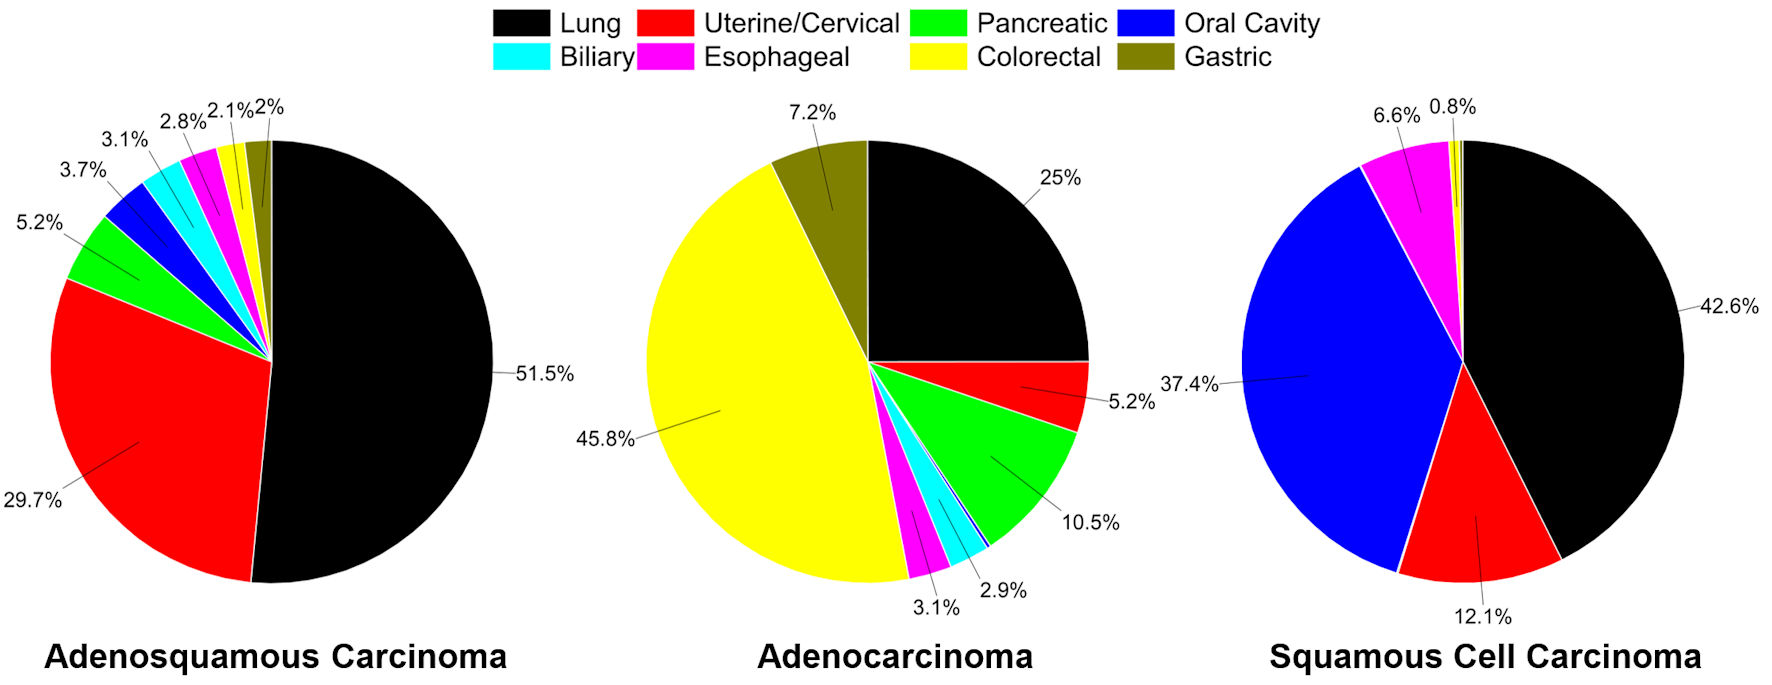
Figure 1. Distribution of cancers in SEER, 1975 - 2020 for sites analyzed. Distribution of adenosquamous carcinoma cases in all major sites examined (total of 26,525 cases (92.7% of all adenosquamous carcinoma cases in SEER)) (left). Distribution of all conventional adenocarcinoma cases in sites examined (total of 1,535,527 cases) (middle). Distribution of all conventional squamous cell carcinoma cases in sites examined (total of 588,802 cases) (right).
Figure 2.
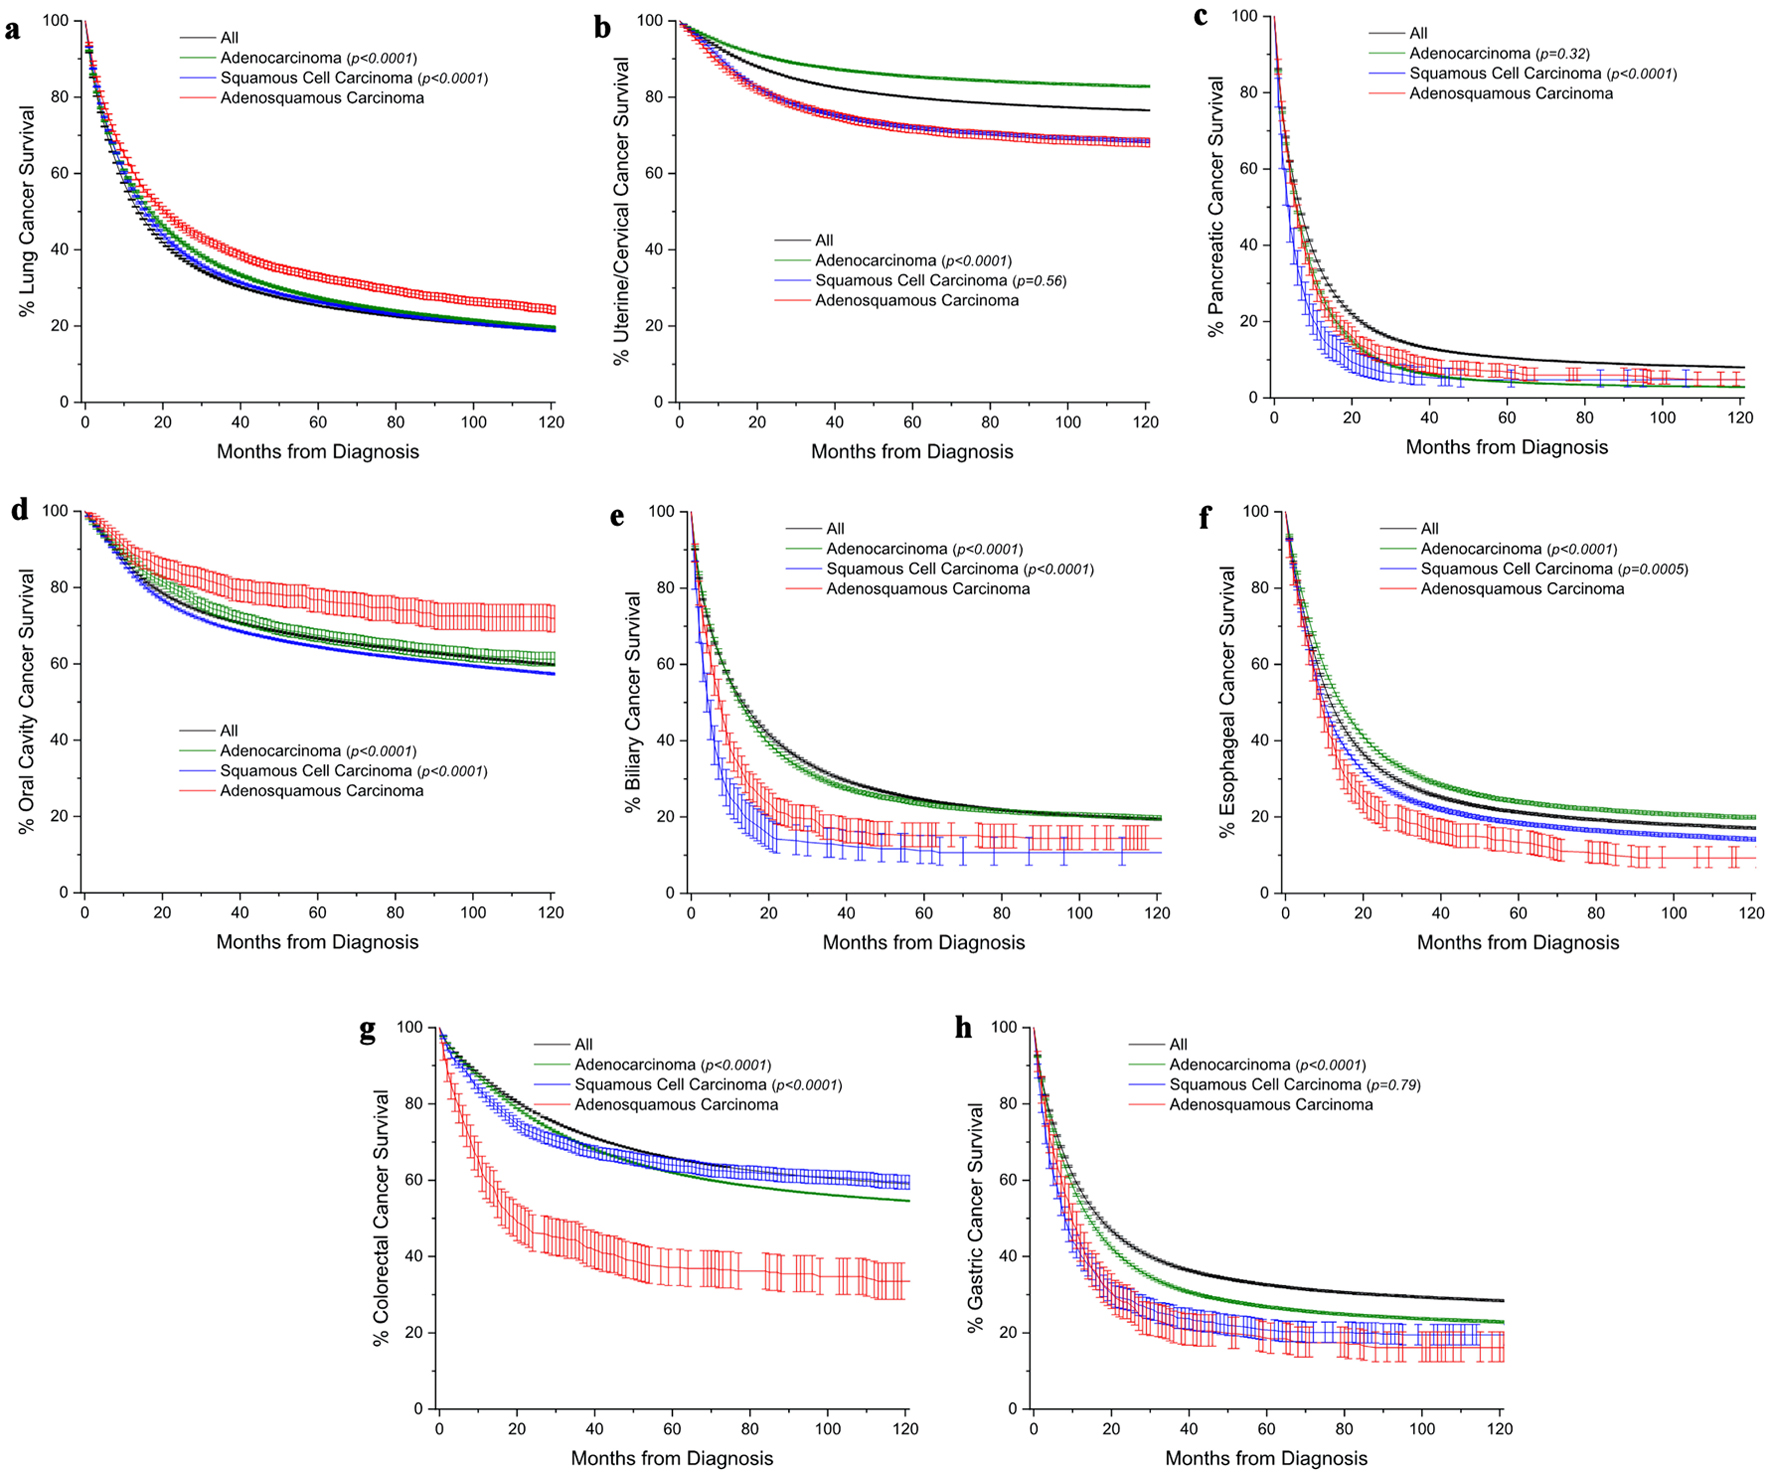
Figure 2. Kaplan-Meier survival curves comparing overall survival of adenosquamous carcinomas patients to those with either conventional adenocarcinomas or squamous cell carcinomas. The black line represents a comparative survival curve for all malignancies within that site. (a) Lung cancer. (b) Uterine/cervical cancer. (c) Pancreatic cancer. (d) Oral cavity cancer. (e) Biliary cancer. (f) Esophageal cancer. (g) Colorectal cancer. (h) Gastric cancer. All survival curves are shown with 95% confidence interval. Among subtypes, pairwise statistical comparisons by the log-rank test are shown relative to adenosquamous carcinomas.

Tables

Table 1. Demographics and Clinical Characteristics for Lung Cancer by Histology
 
LungAllAdenocarcinomaSquamousAdenosquamousP value
P < 0.05 for all comparisons between adenocarcinoma, squamous cell carcinoma and adenosquamous cell carcinoma comparisons. Incidence rates were expressed per 100,000. CSS: cause-specific survival; RS: relative survival; CI: confidence interval; SD: standard deviation.
N (%)1,124,192 (100)357,273 (31.8)226,774 (20.2)12,498 (1.1)
Age (years) (%)
  0 - 14180 (< 1)5 (< 1)2 (< 1)0 (0.0)< 0.001
  15 - 291,393 (0.1)248 (0.1)86 (< 1)10 (0.1)
  30 - 4948,725 (4.3)18,354 (5.1)5,840 (2.6)540 (4.3)
  50 - 69496,997 (44.2)166,617 (46.6)96,877 (42.7)5,489 (43.9)
  70 - 89576,897 (51.3)172,049 (48.2)123,969 (54.7)6,459 (51.7)
  Mean (SD)69.0 (10.7)68.2 (10.8)69.9 (9.6)68.9 (10.4)< 0.001
  Median70697170
Sex (%)
  Male603,851 (53.7)178,466 (50.0)145,474 (64.1)6,960 (55.7)< 0.001
  Female520,341 (46.3)178,807 (50.0)81,300 (35.9)5,538 (44.3)
Race (%)
  White938,501 (83.5)288,603 (80.8)190,397 (84.0)10,391 (83.1)< 0.001
  Black111,668 (9.9)37,065 (10.4)24,883 (11.0)1,216 (9.7)
  Other74,023 (6.6)31,605 (8.8)11,494 (5.1)891 (7.1)
Detection stage (%)
  Localized222,677 (19.8)71,010 (19.9)55,571 (24.5)3,265 (26.1)< 0.001
  Regional260,684 (23.2)73,042 (20.4)75,034 (22.1)4,127 (22.0)
  Distant573,501 (51.0)202,024 (56.5)86,151 (38.0)4,844 (38.8)
  Unstaged67,330 (6.0)11,191 (3.1)10,018 (4.4)262 (2.1)
Grade differentiation (%)
  Well49,946 (4.4)20,356 (5.7)5,284 (2.3)124 (1.0)< 0.001
  Moderate151,654 (13.5)63,230 (17.7)57,028 (25.1)2,445 (19.6)
  Poor310,089 (27.6)93,380 (26.1)74,361 (32.8)5,614 (44.9)
  Unknown612,503 (54.5)180,307 (50.5)90,101 (39.7)4,315 (34.5)
Surgery (%)
  Yes260,926 (23.2)92,593 (25.9)62,602 (27.6)6,247 (50.0)< 0.001
  No863,266 (76.8)264,680 (74.1)164,172 (72.4)6,251 (50.0)
Chemotherapy (%)
  Yes433,894 (38.6)146,491 (41.0)80,278 (35.4)4,284 (34.3)< 0.001
  No690,298 (61.4)210,782 (59.0)146,496 (64.6)8,214 (65.7)
Radiotherapy (%)
  Yes430,333 (38.3)140,587 (39.4)106,011 (46.7)4,491 (35.9)< 0.001
  No693,859 (61.7)216,686 (60.6)120,763 (53.3)8,007 (64.1)
Incidence rate (95% CI)-
  All565 (564 - 566)179 (178 - 180)109.5 (109.0 - 110.0)5.9 (5.8 - 6.0)
  Male675 (673 - 677)198 (197 - 199)155.6 (154.8 - 156.5)7.4 (7.2 - 7.6)
  Female482 (481 - 484)165 (164 - 166)73.2 (72.7 - 73.8)4.8 (4.7 - 5.0)
CSS (95% CI)-
  1-year47.8 (47.6 - 47.9)52.9 (52.7 - 53.1)52.8 (52.5 - 53.1)57.6 (56.4 - 58.7)
  2-year33.6 (33.5 - 33.8)38.7 (38.5 - 38.9)37.3 (37.1 - 37.6)42.7 (41.5 - 43.8)
  5-year21.7 (21.6 - 21.9)24.0 (23.8 - 24.2)24.2 (24.0 - 24.5)30.0 (28.9 - 31.2)
  10-year16.1 (16.0 - 16.3)17.1 (16.9 - 17.3)17.4 (17.2 - 17.7)22.4 (21.2 - 23.5)
  Median (months)10.913.713.516.6
RS (95% CI)-
  1-year44.2 (44.1 - 44.3)50.0 (49.8 - 50.2)48.7 (48.5 - 49.0)54.4 (53.3 - 55.5)
  2-year29.7 (29.6 - 29.8)35.3 (35.1 - 35.5)32.4 (32.2 - 32.7)38.6 (37.5 - 39.7)
  5-year16.8 (16.7 - 16.9)19.5 (19.4 - 19.7)17.5 (17.3 - 17.8)23.2 (22.2 - 24.2)
  10-year9.5 (9.4 - 9.5)11.0 (10.8 - 11.1)8.4 (8.2 - 8.6)13.0 (12.1 - 13.9)
  Median (months)9.412.011.414.3


Table 2. Univariate and Multivariable Cox-Proportional Hazard Ratios (HRs) of Mortality for Lung Cancer
 
LungAdenosquamous vs. adenocarcinomaAdenosquamous vs. squamous
Univariate, HR (95% CI)Multivariable, HR (95% CI)Univariate, HR (95% CI)Multivariable, HR (95% CI)
P < 0.05 relative to reference unless noted by aP ≥ 0.05. Reference categories: sex (Male), race (White), detection stage (Localized), grade differentiation (Well), surgery (no), radiotherapy (no), and chemotherapy (no). CI: confidence interval.
Adenosquamous histology0.87 (0.85 - 0.89)1.14 (1.11 - 1.16)0.84 (0.82 - 0.86)1.08 (1.05 - 1.10)
Age (per 10 years)1.051 (1.047 - 1.055)1.067 (1.062 - 1.071)1.08 (1.07 - 1.09)1.05 (1.04 - 1.06)
Sex
  Female0.78 (0.77 - 0.79)0.81 (0.80 - 0.82)0.87 (0.86 - 0.88)0.88 (0.87 - 0.89)
Race
  Black1.08 (1.07 - 1.10)0.97 (0.96 - 0.99)1.16 (1.14 - 1.18)1.00 (0.99 - 1.02)a
  Other0.93 (0.91 - 0.94)0.77 (0.76 - 0.78)1.10 (1.08 - 1.13)0.95 (0.93 - 0.97)
Detection stage
  Regional2.16 (2.13 - 2.19)2.28 (2.25 - 2.32)2.00 (1.97 - 2.03)2.03 (2.00 - 2.06)
  Distant6.05 (5.97 - 6.13)4.79 (4.72 - 4.86)4.76 (4.69 - 4.83)3.65 (3.59 - 3.71)
  Unstaged3.56 (3.47 - 3.52)2.31 (2.25 - 2.37)2.96 (2.86 - 3.04)1.84 (1.79 - 1.89)
Grade differentiation
  Moderate1.42 (1.39 - 1.45)1.36 (1.32 - 1.39)0.87 (0.84 - 0.90)0.96 (0.93 - 1.00)a
  Poor2.46 (2.41 - 2.51)1.73 (1.69 - 1.77)1.05 (1.01 - 1.09)1.04 (1.00 - 1.07)
  Unknown3.26 (3.19 - 3.33)1.41 (1.38 - 1.44)1.48 (1.43 - 1.53)0.93 (0.90 - 0.97)
Surgery (yes)0.244 (0.241 - 0.247)0.395 (0.389 - 0.400)0.267 (0.263 - 0.270)0.319 (0.314 - 0.324)
Chemotherapy (yes)1.33 (1.32 - 1.34)0.635 (0.629 - 0.641)1.16 (1.15 - 1.18)0.66 (0.65 - 0.67)
Radiotherapy (yes)1.45 (1.44 - 1.46)1.03 (1.02 - 1.04)1.42 (1.41 - 1.44)0.89 (0.88 - 0.90)


Table 3. Demographics and Clinical Characteristics for Uterine/Cervical Cancer by Histology
 
Uterus/cervixAllAdenocarcinomaSquamousAdenosquamousP value
P < 0.05 for all comparisons between adenocarcinoma, squamous cell carcinoma and adenosquamous cell carcinoma comparisons. Incidence rates were expressed per 100,000. CSS: cause-specific survival; RS: relative survival; CI: confidence interval; SD: standard deviation.
N (%)400,543 (100.0)74,765 (18.7)64,391 (16.1)7,206 (1.8)
Age (years) (%)
  0 - 1443 (< 1)1 (< 1)0 (0.0)0 (0.0)< 0.001
  15 - 297,539 (1.9)886 (1.2)4,034 (6.3)217 (3.0)
  30 - 4983,563 (20.9)14,070 (18.8)29,498 (45.8)2,345 (32.5)
  50 - 69209,049 (52.2)39,016 (52.2)22,344 (34.7)3,174 (44.0)
  70 - 89100,349 (25.1)20,792 (27.8)8,515 (13.2)1,470 (20.4)
  Mean (SD)59.6 (13.9)60.8 (13.5)50.4 (15.3)55.7 (15.1)< 0.001
  Median60624956
Race (%)
  White326,288 (81.5)65,547 (87.7)48,509 (75.3)5,945 (82.5)< 0.001
  Black37,776 (9.4)3,891 (5.2)9,112 (14.2)568 (7.9)
  Other36,479 (9.1)5,327 (7.1)6,770 (10.5)693 (9.6)
Detection stage (%)
  Localized258,276 (64.5)55,762 (74.6)29,930 (46.5)3,752 (52.1)< 0.001
  Regional83,626 (20.9)9,809 (13.1)24,731 (38.4)2,156 (29.9)
  Distant42,433 (10.6)5,786 (7.7)7,266 (11.3)1,077 (14.9)
  Unstaged16,208 (4.0)3,408 (4.6)2,464 (3.8)221 (3.1)
Grade differentiation (%)
  Well115,050 (28.7)28,758 (38.5)3,556 (5.5)568 (7.9)< 0.001
  Moderate98,038 (24.5)22,567 (30.2)17,940 (27.9)1,886 (26.2)
  Poor91,240 (22.8)12,950 (17.3)18,407 (28.6)3,203 (44.4)
  Unknown96,215 (24.0)10,490 (14.0)24,488 (38.0)1,549 (21.5)
Surgery (%)
  Yes333,390 (83.2)63,980 (85.6)34,884 (54.2)5,678 (78.8)< 0.001
  No67,153 (16.8)10,785 (14.4)29,507 (45.8)1,528 (21.2)
Chemotherapy (%)
  Yes83,350 (20.8)6,778 (9.1)23,795 (37.0)1,872 (26.0)< 0.001
  No317,193 (79.2)67,987 (90.0)40,596 (63.0)5,334 (74.0)
Radiotherapy (%)
  Yes136,342 (34.0)24,045 (32.2)36,777 (57.1)4,037 (56.0)< 0.001
  No264,201 (66.0)50,720 (67.8)27,614 (42.9)3,169 (44.0)
Incidence rate (95% CI)-
  All175 (174 - 176)17.1 (17.0 - 17.4)26.6 (26.4 - 26.8)2.27 (2.20 - 2.35)
  Female331 (330 - 332)32.6 (32.2 - 33.0)51.7 (51.3 - 52.2)4.39 (4.26 - 4.53)
CSS (95% CI)-
  1-year91.3 (91.2 - 91.4)90.4 (90.1 - 90.8)88.3 (88.0 - 88.6)87.0 (85.9 - 88.1)
  2-year85.9 (85.7 - 86.0)85.7 (85.3 - 86.2)79.5 (79.1 - 79.9)78.8 (77.4 - 80.1)
  5-year79.0 (78.9 - 79.2)80.4 (79.9 - 80.9)70.7 (70.2 - 71.1)69.5 (67.9 - 71.1)
  10-year75.6 (75.4 - 75.8)77.7 (77.2 - 78.2)67.0 (66.5 - 67.5)65.9 (64.2 - 67.6)
  Median (months)----
RS (95% CI)-
  1-year89.6 (89.5 - 89.7)88.4 (88.0 - 88.8)86.7 (86.4 - 87.0)85.8 (84.6 - 86.9)
  2-year83.1 (83.0 - 83.3)82.6 (82.2 - 83.1)76.8 (76.4 - 77.3)76.6 (75.1 - 77.9)
  5-year73.3 (73.1 - 73.4)74.2 (73.6 - 74.7)65.5 (65.0 - 66.0)64.9 (63.2 - 66.5)
  10-year63.9 (63.7 - 64.1)65.6 (65.0 - 66.2)57.9 (57.3 - 58.4)56.8 (55.0 - 58.5)
  Median (months)----


Table 4. Univariate and Multivariable Cox-Proportional Hazard Ratios (HRs) of Mortality for Uterine/Cervical Cancer
 
Uterus/cervixAdenosquamous vs. adenocarcinomaAdenosquamous vs. squamous
Univariate, HR (95% CI)Multivariable, HR (95% CI)Univariate, HR (95% CI)Multivariable, HR (95% CI)
P < 0.05 relative to reference unless noted by aP ≥ 0.05. Reference categories: race (White), detection stage (Localized), grade differentiation (Well), surgery (no), radiotherapy (no), and chemotherapy (no). CI: confidence interval.
Adenosquamous histology1.99 (1.90 - 2.08)1.06 (1.01 - 1.11)1.02 (0.97 - 1.06)a1.18 (1.13 - 1.23)
Age (per 10 years)1.36 (1.34 - 1.38)1.34 (1.32 - 1.35)1.29 (1.28 - 1.30)1.12 (1.11 - 1.14)
Race
  Black2.56 (2.43 - 2.70)1.49 (1.41 - 1.57)1.36 (1.31 - 1.41)1.20 (1.15 - 1.24)
  Other1.04 (0.98 - 1.10)a1.00 (0.94 - 1.06)a0.89 (0.85 - 0.93)0.82 (0.78 - 0.86)
Detection stage
  Regional5.11 (4.91 - 5.32)3.02 (2.89 - 3.16)4.93 (4.75 - 5.12)3.24 (3.10 - 3.39)
  Distant19.5 (18.7 - 20.2)8.79 (8.38 - 9.22)16.8 (16.1 - 17.5)10.6 (10.1 - 11.1)
  Unstaged4.35 (4.07 - 4.65)2.07 (1.92 - 2.22)4.85 (4.53 - 5.20)2.96 (2.75 - 3.18)
Grade differentiation
  Moderate2.43 (2.31 - 2.56)1.77 (1.68 - 1.87)1.77 (1.64 - 1.92)1.26 (1.16 - 1.36)
  Poor7.76 (7.39 - 8.15)3.50 (3.31 - 3.69)2.57 (2.38 - 2.77)1.56 (1.45 - 1.69)
  Unknown4.71 (4.45 - 4.97)2.21 (2.08 - 2.34)1.51 (1.40 - 1.64)1.12 (1.04 - 1.21)
Surgery (yes)0.162 (0.156 - 0.167)0.35 (0.34 - 0.37)0.233 (0.227 - 0.240)0.44 (0.43 - 0.46)
Chemotherapy (yes)5.15 (4.97 - 5.34)1.25 (1.20 - 1.31)2.24 (2.17 - 2.30)0.84 (0.82 - 0.87)
Radiotherapy (yes)2.41 (2.33 - 2.48)1.04 (1.00 - 1.07)3.13 (3.03 - 3.23)1.02 (0.98 - 1.06)


Table 5. Demographics and Clinical Characteristics for Pancreatic Cancer by Histology
 
PancreasAllAdenocarcinomaSquamousAdenosquamousP value
P < 0.05 for all comparisons between adenocarcinoma, squamous cell carcinoma and adenosquamous cell carcinoma comparisons. Incidence rates were expressed per 100,000. CSS: cause-specific survival; RS: relative survival; CI: confidence interval; SD: standard deviation.
N (%)250,034 (100.0)149,409 (59.8)530 (0.2)1,273 (0.5)
Age (years) (%)
  0 - 1494 (< 1)1 (< 1)0 (0.0)0 (0.0)0.66
  15 - 29696 (0.3)94 (0.1)0 (0.0)0 (0.0)
  30 - 4914,416 (5.8)7,915 (5.3)33 (6.2)70 (5.5)
  50 - 69105,829 (42.3)68,078 (45.6)220 (41.5)564 (44.3)
  70 - 89128,999 (51.6)73,321 (49.1)277 (52.3)639 (50.2)
  Mean (SD)68.9 (11.8)68.4 (11.1)68.6 (11.5)68.4 (10.5)0.91
  Median70697070
Sex (%)
  Male128,060 (51.2)77,717 (52.0)282 (53.2)671 (52.7)0.76
  Female121,974 (48.8)71,692 (48.0)248 (46.8)602 (47.3)
Race (%)
  White203,422 (81.4)121,475 (81.3)403 (76.0)1,027 (80.7)0.032
  Black26,897 (10.8)16,531 (11.1)74 (14.0)140 (11.0)
  Other19,715 (7.9)11,403 (7.6)53 (10.0)106 (8.3)
Detection stage (%)
  Localized26,418 (10.6)11,737 (7.9)30 (5.7)112 (8.8)< 0.001
  Regional68,912 (27.6)43,426 (29.1)133 (25.1)488 (38.3)
  Distant129,160 (51.7)86,543 (57.9)329 (62.1)632 (49.6)
  Unstaged25,544 (10.2)7,703 (5.2)38 (7.2)41 (3.2)
Grade differentiation (%)
  Well14,289 (5.7)5,895 (3.9)14 (2.6)6 (0.5)< 0.001
  Moderate31,406 (12.6)19,930 (13.3)42 (7.9)148 (11.6)
  Poor34,609 (13.8)22,413 (15.0)163 (30.8)429 (33.7)
  Unknown169,730 (67.9)101,171 (67.7)311 (58.7)690 (54.2)
Surgery (%)
  Yes44,939 (18.0)19,802 (13.3)45 (8.5)461 (36.2)< 0.001
  No205,095 (82.0)129,607 (86.7)485 (91.5)812 (63.8)
Chemotherapy (%)
  Yes105,126 (42.0)75,021 (50.2)219 (41.3)703 (55.2)< 0.001
  No144,908 (58.0)74,388 (49.2)311 (58.7)570 (44.8)
Radiotherapy (%)
  Yes34,417 (13.8)24,021 (16.1)86 (16.2)207 (16.3)0.98
  No215,617 (86.2)125,388 (83.9)444 (83.8)1,066 (83.7)
Incidence rate (95% CI)-
  All123.6 (123.1 - 124.1)71.2 (70.9 - 71.7)0.23 (0.21 - 0.25)0.63 (0.59 - 0.66)
  Male140.3 (139.4 - 141.1)82.1 (81.5 - 82.8)0.28 (0.24 - 0.32)0.73 (0.67 - 0.79)
  Female109.7 (109.1 - 110.4)62.3 (61.8 - 62.8)0.19 (0.16 - 0.22)0.54 (0.50 - 0.59)
CSS (95% CI)-
  1-year32.0 (31.8 - 32.2)28.0 (27.7 - 28.3)17.7 (13.5 - 22.4)27.7 (24.7 - 30.8)
  2-year17.6 (17.4 - 17.8)11.5 (11.3 - 11.7)7.2 (4.5 - 10.7)13.4 (11.1 - 16.0)
  5-year9.6 (9.4 - 9.7)3.9 (3.8 - 4.0)3.3 (1.6 - 6.2)6.7 (4.9 - 8.8)
  10-year7.3 (7.1 - 7.4)2.6 (2.5 - 2.7)3.3 (1.6 - 6.2)4.7 (3.0 - 7.0)
  Median (months)5.95.73.75.9
RS (95% CI)-
  1-year30.3 (30.0 - 30.5)26.6 (26.3 - 26.9)16.4 (12.5 - 20.9)26.5 (23.6 - 29.5)
  2-year16.1 (16.0 - 16.3)10.5 (10.4 - 10.7)6.4 (4.0 - 9.7)12.4 (10.2 - 14.8)
  5-year8.1 (7.9 - 8.2)3.3 (3.1 - 3.4)2.7 (1.2 - 5.2)5.7 (4.1 - 7.6)
  10-year5.1 (5.0 - 5.3)1.7 (1.6 - 1.9)2.7 (1.2 - 5.2)3.2 (1.9 - 5.1)
  Median (months)5.45.43.65.7


Table 6. Univariate and Multivariable Cox-Proportional Hazard Ratios (HRs) of Mortality for Pancreatic Cancer
 
PancreasAdenosquamous vs. adenocarcinomaAdenosquamous vs. squamous
Univariate, HR (95% CI)Multivariable, HR (95% CI)Univariate, HR (95% CI)Multivariable, HR (95% CI)
P < 0.05 relative to reference unless noted by aP ≥ 0.05. Reference categories: sex (Male), race (White), detection stage (Localized), grade differentiation (Well), surgery (no), radiotherapy (no), and chemotherapy (no). CI: confidence interval.
Adenosquamous histology0.97 (0.91 - 1.03)a1.25 (1.18 - 1.34)0.77 (0.68 - 0.86)1.16 (1.02 - 1.31)
Age (per 10 years)1.116 (1.110 - 1.122)1.084 (1.079 - 1.091)1.13 (1.08 - 1.19)1.11 (1.06 - 1.17)
Sex
  Female0.98 (0.97 - 0.99)0.96 (0.95 - 0.97)0.96 (0.86 - 1.07)a1.01 (0.91 - 1.12)
Race
  Black1.05 (1.03 - 1.07)1.05 (1.03 - 1.07)1.18 (1.00 - 1.39)1.16 (0.98 - 1.38)a
  Other0.97 (0.95 - 0.99)0.94 (0.92 - 0.96)0.88 (0.73 - 1.08)a0.95 (0.78 - 1.16)a
Detection stage
  Regional1.06 (1.03 - 1.08)1.32 (1.29 - 1.36)1.07 (0.86 - 1.34)a1.43 (1.14 - 1.79)
  Distant2.16 (2.11 - 2.21)2.16 (2.11 - 2.21)2.40 (1.94 - 2.98)2.03 (1.63 - 2.54)
  Unstaged1.54 (1.49 - 1.60)1.15 (1.11 - 1.19)1.67 (1.21 - 2.30)0.91 (0.65 - 1.27)a
Grade differentiation
  Moderate1.06 (1.03 - 1.10)1.26 (1.22 - 1.30)0.72 (0.42 - 1.23)a1.01 (0.58 - 1.73)a
  Poor1.48 (1.43 - 1.53)1.57 (1.52 - 1.62)0.91 (0.55 - 1.53)1.11 (0.65 - 1.87)a
  Unknown1.60 (1.55 - 1.64)1.25 (1.21 - 1.29)1.41 (0.85 - 2.35)1.17 (0.70 - 1.98)a
Surgery (yes)0.36 (0.35 - 0.37)0.43 (0.42 - 0.44)0.32 (0.28 - 0.37)0.36 (0.31 - 0.43)
Chemotherapy (yes)0.56 (0.55 - 0.57)0.525 (0.518 - 0.532)0.55 (0.50 - 0.62)0.52 (0.46 - 0.58)
Radiotherapy (yes)0.61 (0.60 - 0.62)0.93 (0.91 - 0.94)0.66 (0.57 - 0.76)0.88 (0.76 - 1.10)a


Table 7. Demographics and Clinical Characteristics for Oral Cavity Cancer by Histology
 
Oral cavityAllAdenocarcinomaSquamousAdenosquamousP value
P < 0.05 for all comparisons between adenocarcinoma, squamous cell carcinoma and adenosquamous cell carcinoma comparisons. Incidence rates were expressed per 100,000. CSS: cause-specific survival; RS: relative survival; CI: confidence interval; SD: standard deviation.
N (%)249,224 (100.0)3,863 (1.6)199,190 (79.9)888 (0.4)
Age (years) (%)
  0 - 14677 (0.3)9 (0.2)58 (< 1)4 (0.5)< 0.001
  15 - 293,502 (1.4)65 (1.7)1,174 (0.6)15 (1.7)
  30 - 4934,002 (3.6)557 (14.4)24,397 (12.2)114 (12.8)
  50 - 69134,349 (53.9)1,750 (45.3)111,842 (56.1)419 (47.2)
  70 - 8976,694 (30.8)1,482 (38.4)61,719 (31.0)336 (37.8)
  Mean (SD)62.4 (13.4)63.8 (14.5)63.1 (31.0)63.7 (14.5)< 0.001
  Median63656366
Sex (%)
  Male173,732 (69.7)2,240 (58.0)144,537 (72.6)472 (53.2)< 0.001
  Female75,492 (30.3)1,623 (42.0)54,653 (27.4)416 (46.8)
Race (%)
  White209,572 (84.1)3,195 (82.7)170,640 (85.7)731 (82.3)< 0.001
  Black20,512 (8.2)390 (10.1)15,952 (8.0)84 (9.5)
  Other19,140 (7.7)278 (7.2)12,598 (6.3)73 (8.2)
Detection stage (%)
  Localized81,048 (32.5)1,499 (38.8)60,949 (30.6)472 (53.2)< 0.001
  Regional118,479 (47.5)1,290 (33.4)100,544 (50.5)275 (31.0)
  Distant35,025 (14.1)790 (20.5)27,525 (13.8)113 (12.7)
  Unstaged14,672 (5.9)284 (7.4)10,172 (5.1)28 (3.2)
Grade differentiation (%)
  Well32,962 (13.2)389 (10.1)27,681 (13.9)88 (9.9)< 0.001
  Moderate78,898 (31.7)942 (24.4)70,941 (35.6)185 (20.8)
  Poor61,523 (24.7)1,340 (34.7)47,510 (23.9)225 (25.3)
  Unknown75,841 (30.4)1,192 (30.9)53,058 (26.6)390 (43.9)
Surgery (%)
  Yes143,820 (57.7)3,013 (78.0)110,288 (55.4)746 (84.0)< 0.001
  No105,404 (42.3)850 (22.0)88,902 (44.6)142 (16.0)
Chemotherapy (%)
  Yes82,274 (33.0)568 (14.7)70,643 (35.5)118 (13.3)< 0.001
  No166,950 (67.0)3,295 (85.3)128,547 (64.5)770 (86.7)
Radiotherapy (%)
  Yes144,488 (58.0)1,989 (51.5)118,348 (59.4)461 (51.9)< 0.001
  No104,736 (42.0)1,874 (48.5)80,842 (40.6)427 (48.1)
Incidence rate (95% CI)-
  All111.1 (110.7 - 111.6)1.63 (1.57 - 1.69)87.2 (86.7 - 87.6)0.44 (0.41 - 0.47)
  Male167.2 (166.3 - 168.0)2.10 (2.00 - 2.20)136.3 (135.5 - 137.1)0.49 (0.44 - 0.54)
  Female62.8 (62.3 - 63.3)1.26 (1.19 - 1.33)44.4 (44.0 - 44.8)0.39 (0.35 - 0.43)
CSS (95% CI)-
  1-year85.9 (85.7 - 86.1)87.1 (85.6 - 88.4)85.0 (84.8 - 85.2)89.5 (86.7 - 91.8)
  2-year77.5 (77.3 - 77.7)78.7 (76.9 - 80.4)75.8 (75.6 - 76.1)85.3 (82.0 - 88.0)
  5-year68.5 (68.3 - 68.8)66.8 (64.6 - 68.8)66.7 (66.4 - 66.9)78.5 (74.6 - 81.8)
  10-year62.1 (61.8 - 62.4)61.0 (58.6 - 63.2)60.1 (59.8 - 60.5)74.3 (69.8 - 78.1)
  Median (months)----
RS (95% CI)-
  1-year82.7 (82.5 - 82.9)85.0 (83.4 - 86.4)81.6 (81.4 - 81.8)87.4 (84.4 - 89.8)
  2-year72.6 (72.3 - 72.8)74.6 (72.7 - 76.4)70.7 (70.4 - 73.3)81.4 (77.9 - 84.4)
  5-year58.8 (58.5 - 59.1)87.8 (56.0 - 60.3)56.6 (56.3 - 56.9)70.0 (65.8 - 73.8)
  10-year45.1 (44.8 - 45.4)76.0 (43.2 - 47.9)42.4 (42.0 - 42.7)59.1 (54.2 - 63.6)
  Median (months)96.593.085.6-


Table 8. Univariate and Multivariable Cox-Proportional Hazard Ratios (HRs) of Mortality for Oral Cavity Cancer
 
Oral cavityAdenosquamous vs. adenocarcinomaAdenosquamous vs. squamous
Univariate, HR (95% CI)Multivariable, HR (95% CI)Univariate, HR (95% CI)Multivariable, HR (95% CI)
P < 0.05 relative to reference unless noted by aP ≥ 0.05. Reference categories: sex (Male), race (White), detection stage (Localized), grade differentiation (Well), surgery (no), radiotherapy (no), and chemotherapy (no). CI: confidence interval.
Adenosquamous histology0.70 (0.60 - 0.81)0.88 (0.76 - 1.02)a0.60 (0.52 - 0.68)0.75 (0.66 - 0.86)
Age (per 10 years)1.28 (1.23 - 1.33)1.24 (1.19 - 1.29)1.20 (1.19 - 1.21)1.24 (1.23 - 1.25)
Sex
  Female0.59 (0.53 - 0.65)0.79 (0.71 - 0.88)1.07 (1.05 - 1.08)1.10 (1.08 - 1.11)
Race
  Black0.98 (0.83 - 1.16)1.18 (1.00 - 1.40)1.99 (1.95 - 2.04)1.72 (1.68 - 1.76)
  Other0.81 (0.66 - 1.00)0.79 (0.64 - 0.97)1.11 (1.08 - 1.15)1.06 (1.03 - 1.09)
Detection stage
  Regional4.03 (3.48 - 4.67)2.70 (2.31 - 3.15)2.16 (2.11 - 2.20)2.25 (2.20 - 2.30)
  Distant9.57 (8.22 - 11.1)5.02 (4.23 - 5.95)4.45 (4.34 - 4.55)4.50 (4.39 - 4.62)
  Unstaged3.40 (2.70 - 4.29)1.99 (1.56 - 2.54)2.51 (2.42 - 2.59)1.93 (1.86 - 2.00)
Grade differentiation
  Moderate2.55 (1.85 - 3.51)2.21 (1.60 - 3.05)1.67 (1.63 - 1.71)1.34 (1.31 - 1.38)
  Poor8.89 (6.56 - 12.1)4.71 (3.45 - 6.45)1.64 (1.59 - 1.68)1.16 (1.13 - 1.19)
  Unknown4.15 (3.04 - 5.66)2.61 (1.91 - 3.58)1.37 (1.33 - 1.41)0.94 (0.92 - 0.97)
Surgery (yes)0.26 (0.24 - 0.29)0.38 (0.34 - 0.44)0.484 (0.477 - 0.492)0.52 (0.51 - 0.53)
Chemotherapy (yes)3.00 (2.67 - 3.37)1.04 (0.91 - 1.19)a1.18 (1.16 - 1.20)0.68 (0.67 - 0.69)
Radiotherapy (yes)1.85 (1.66 - 2.05)0.96 (0.86 - 1.08)1.37 (1.35 - 1.39)0.85 (0.83 - 0.86)


Table 9. Demographics and Clinical Characteristics for Biliary Tract Cancer by Histology
 
BiliaryAllAdenocarcinomaSquamousAdenosquamousP value
P < 0.05 for all comparisons between adenocarcinoma, squamous cell carcinoma and adenosquamous cell carcinoma comparisons. Incidence rates were expressed per 100,000. CSS: cause-specific survival; RS: relative survival; CI: confidence interval; SD: standard deviation.
N (%)218,928 (100.0)41,976 (19.2)450 (0.2)749 (0.3)
Age (years) (%)
  0 - 141,392 (0.6)1 (< 1)0 (0.0)0 (0.0)0.23
  15 - 291,064 (0.5)90 (0.2)0 (0.0)0 (0.0)
  30 - 4915,632 (7.1)2,556 (6.1)35 (7.8)46 (6.1)
  50 - 69111,391 (50.9)16,888 (40.2)184 (40.9)333 (44.5)
  70 - 8989,449 (40.9)22,441 (53.5)231 (51.3)370 (49.4)
  Mean (SD)65.9 (12.9)69.3 (11.8)68.3 (11.8)68.5 (11.4)0.041
  Median66717069
Sex (%)
  Male139,293 (63.6)18,403 (43.8)164 (36.4)258 (34.4)< 0.001
  Female79,635 (36.4)23,573 (56.2)286 (63.6)491 (65.6)
Race (%)
  White160,585 (73.4)33,504 (79.8)335 (74.4)600 (80.1)0.039
  Black22,737 (10.4)3,531 (8.4)51 (11.3)70 (9.3)
  Other35,606 (16.3)4,941 (11.8)64 (14.2)79 (10.5)
Detection stage (%)
  Localized73,131 (33.4)7,489 (17.8)44 (9.8)100 (13.4)< 0.001
  Regional65,390 (29.9)16,530 (39.4)154 (34.2)335 (44.7)
  Distant51,708 (23.6)14,588 (34.8)225 (50.0)299 (39.9)
  Unstaged28,699 (13.1)3,369 (8.0)27 (6.0)15 (2.0)
Grade differentiation (%)
  Well18,412 (8.4)3,876 (9.2)21 (4.7)14 (1.9)< 0.001
  Moderate35,006 (16.0)12,125 (28.9)115 (25.6)188 (25.1)
  Poor28,836 (13.2)10,489 (25.0)135 (30.0)328 (43.8)
  Unknown136,674 (62.4)15,486 (36.9)179 (39.8)219 (29.2)
Surgery (%)
  Yes64,309 (29.4)21,527 (51.3)191 (42.4)576 (76.9)< 0.001
  No154,619 (70.6)20,449 (48.7)259 (57.6)173 (23.1)
Chemotherapy (%)
  Yes73,858 (33.7)14,544 (34.6)149 (33.1)284 (37.9)0.14
  No145,070 (66.3)27,432 (65.4)301 (66.9)465 (62.1)
Radiotherapy (%)
  Yes24,015 (11.0)6,488 (15.5)67 (14.9)126 (16.8)0.56
  No194,913 (89.0)35,488 (84.5)383 (85.1)623 (83.2)
Incidence Rate (95% CI)-
  All111.6 (111.1 - 112.1)19.5 (19.3 - 19.7)0.19 (0.17 - 0.22)0.32 (0.29 - 0.35)
  Male156.1 (155.2 - 156.9)19.7 (19.4 - 20.0)0.17 (0.14 - 0.20)0.24 (0.21 - 0.28)
  Female73.4 (72.9 - 74.0)19.4 (19.1 - 19.7)0.22 (0.19 - 0.25)0.38 (0.34 - 0.42)
CSS (95% CI)-
  1-year47.7 (47.5 - 48.0)47.7 (47.1 - 48.3)19.8 (15.1 - 24.9)33.1 (28.7 - 37.7)
  2-year34.3 (34.1 - 34.6)31.8 (31.2 - 32.4)10.2 (6.7 - 14.5)18.4 (14.8 - 22.4)
  5-year21.7 (21.5 - 22.0)20.0 (19.5 - 20.6)7.4 (4.4 - 11.4)13.1 (9.8 - 16.8)
  10-year17.1 (16.9 - 17.3)16.6 (16.1 - 17.2)7.4 (4.4 - 11.4)12.6 (9.3 - 16.3)
  Median (months)10.710.94.27.9
RS (95% CI)-
  1-year43.9 (43.7 - 44.1)44.5 (43.9 - 45.1)18.0 (13.7 - 22.8)31.9 (27.6 - 36.3)
  2-year29.9 (29.7 - 30.1)28.3 (27.7 - 28.8)8.1 (5.1 - 11.8)16.8 (13.4 - 20.6)
  5-year16.7 (16.5 - 16.9)15.6 (15.1 - 16.1)5.8 (3.4 - 9.3)9.9 (7.1 - 13.1)
  10-year11.0 (10.8 - 11.2)10.2 (9.8 - 10.7)5.8 (3.4 - 9.3)7.7 (5.1 - 10.9)
  Median (months)8.99.63.97.4


Table 10. Univariate and Multivariable Cox-Proportional Hazard Ratios (HRs) of Mortality for Biliary Tract Cancer
 
BiliaryAdenosquamous vs. adenocarcinomaAdenosquamous vs. squamous
Univariate, HR (95% CI)Multivariable, HR (95% CI)Univariate, HR (95% CI)Multivariable, HR (95% CI)
P < 0.05 relative to reference unless noted by aP ≥ 0.05. Reference categories: sex (Male), race (White), detection stage (Localized), grade differentiation (Well), surgery (no), radiotherapy (no), and chemotherapy (no). CI: confidence interval.
Adenosquamous histology1.40 (1.28 - 1.52)1.56 (1.43 - 1.71)0.74 (0.64 - 0.85)0.93 (0.80 - 1.09)a
Age (per 10 years)1.10 (1.08 - 1.11)1.08 (1.07 - 1.09)1.12 (1.06 - 1.20)1.10 (1.03 - 1.17)
Sex
  Female1.06 (1.04 - 1.09)1.06 (1.04 - 1.09)0.98 (0.84 - 1.13)a1.04 (0.90 - 1.21)a
Race
  Black1.05 (1.01 - 1.10)1.06 (1.01 - 1.11)1.22 (0.98 - 1.53)a1.05 (0.84 - 1.32)a
  Other0.94 (0.90 - 0.98)0.96 (0.92 - 1.00)a0.97 (0.79 - 1.21)a0.91 (0.73 - 1.13)a
Detection stage
  Regional1.36 (1.31 - 1.42)1.61 (1.55 - 1.68)1.48 (1.17 - 1.88)1.92 (1.50 - 2.45)
  Distant3.56 (3.42 - 3.70)3.06 (2.93 - 3.19)2.59 (2.04 - 3.28)2.99 (2.31 - 3.86)
  Unstaged2.50 (2.37 - 2.64)1.41 (1.33 - 1.49)2.19 (1.41 - 3.40)1.86 (1.19 - 2.91)
Grade differentiation
  Moderate1.28 (1.22 - 1.35)1.26 (1.20 - 1.32)0.96 (0.63 - 1.47)a0.88 (0.57 - 1.35)a
  Poor2.11 (2.00 - 2.22)1.87 (1.78 - 1.97)1.26 (0.83 - 1.91)a1.16 (0.76 - 1.77)a
  Unknown2.82 (2.68 - 2.96)1.42 (1.35 - 1.50)1.62 (1.07 - 2.47)1.06 (0.69 - 1.64)a
Surgery (yes)0.33 (0.32 - 0.34)0.385 (0.372 - 0.398)0.42 (0.37 - 0.49)0.48 (0.40 - 0.58)
Chemotherapy (yes)0.95 (0.93 - 0.98)0.66 (0.65 - 0.68)a0.72 (0.62 - 0.83)0.57 (0.49 - 0.67)
Radiotherapy (yes)0.82 (0.79 - 0.84)1.01 (0.98 - 1.05)0.60 (0.50 - 0.72)0.76 (0.63 - 0.93)


Table 11. Demographics and Clinical Characteristics for Esophageal Cancer by Histology
 
EsophagusAllAdenocarcinomaSquamousAdenosquamousP value
P < 0.05 for all comparisons between adenocarcinoma, squamous cell carcinoma and adenosquamous cell carcinoma comparisons. Incidence rates were expressed per 100,000. CSS: cause-specific survival; RS: relative survival; CI: confidence interval; SD: standard deviation.
N (%)92,290 (100.0)44,971 (48.7)35,215 (38.2)683 (0.7)
Age (years) (%)
  0 - 143 (< 1)0 (0.0)2 (< 1)0 (0.0)< 0.001
  15 - 29143 (0.2)94 (0.2)20 (0.1)0 (0.0)
  30 - 495,857 (6.3)3,128 (7.0)1,966 (5.6)52 (7.6)
  50 - 6946,353 (50.2)22,659 (50.4)18,032 (51.2)375 (54.9)
  70 - 8939,934 (43.3)19,090 (42.4)15,195 (43.1)256 (37.5)
  Mean (SD)67.1 (11.3)66.8 (11.5)67.2 (10.8)65.8 (10.7)< 0.001
  Median67676766
Sex (%)
  Male71,029 (77.0)38,740 (86.1)22,933 (65.1)562 (82.3)< 0.001
  Female21,261 (23.0)6,231 (13.9)12,282 (34.9)121 (17.7)
Race (%)
  White76,729 (83.1)42,643 (94.8)23,426 (66.5)585 (85.7)< 0.001
  Black10,225 (11.1)1,164 (2.6)8,181 (23.2)58 (8.5)
  Other5,336 (5.8)1,164 (2.6)3,608 (10.2)40 (5.9)
Detection stage (%)
  Localized20,381 (22.1)10,255 (22.8)8,130 (23.1)89 (13.0)< 0.001
  Regional27,306 (29.6)13,250 (29.5)11,191 (31.8)249 (36.5)
  Distant31,335 (34.0)17,074 (38.0)9,966 (28.3)283 (41.4)
  Unstaged13,268 (14.4)4,392 (9.8)5,928 (16.8)62 (9.1)
Grade differentiation (%)
  Well4,118 (4.5)2,174 (4.8)1,725 (4.9)7 (1.0)< 0.001
  Moderate25,982 (28.2)13,110 (29.2)12,152 (34.5)79 (11.6)
  Poor34,171 (37.0)16,792 (37.3)11,893 (33.8)410 (60.0)
  Unknown28,019 (30.4)12,895 (28.7)9,445 (26.8)187 (27.4)
Surgery (%)
  Yes24,022 (26.0)14,778 (32.9)6,648 (18.9)226 (33.1)< 0.001
  No68,268 (74.0)30,193 (67.1)28,567 (81.1)457 (66.9)
Chemotherapy (%)
  Yes49,701 (53.9)26,358 (58.6)17,993 (51.1)392 (57.4)< 0.001
  No42,589 (46.1)18,613 (41.4)17,222 (48.9)291 (42.6)
Radiotherapy (%)
  Yes50,446 (54.7)23,192 (51.6)22,270 (63.2)378 (55.3)< 0.001
  No41,844 (45.3)21,779 (41.4)12,945 (36.8)305 (44.7)
Incidence rate (95% CI)-
  All42.9 (42.6 - 43.2)22.8 (22.6 - 23.1)13.8 (13.7 - 14.0)0.29 (0.27 - 0.32)
  Male73.9 (73.3 - 74.5)43.6 (43.1 - 44.0)19.6 (19.3 - 19.9)0.54 (0.49 - 0.59)
  Female17.6 (17.3 - 17.8)5.9 (5.7 - 6.1)9.1 (8.9 - 9.3)0.09 (0.07 - 0.11)
CSS (95% CI)-
  1-year49.4 (49.0 - 49.8)54.2 (53.7 - 54.8)44.4 (43.7 - 45.2)40.1 (35.2 - 44.8)
  2-year32.8 (32.4 - 33.2)36.5 (36.0 - 37.1)29.0 (28.3 - 29.7)21.4 (17.4 - 25.7)
  5-year21.1 (20.7 - 21.5)23.3 (22.8 - 23.8)19.0 (18.4 - 19.6)13.7 (10.3 - 17.7)
  10-year17.2 (16.9 - 17.6)19.3 (18.8 - 19.8)14.9 (14.3 - 15.6)9.6 (6.6 - 13.3)
  Median (months)11.814.09.99.2
RS (95% CI)-
  1-year46.0 (45.6 - 46.4)50.8 (50.3 - 51.4)41.1 (40.3 - 41.8)36.4 (31.8 - 40.9)
  2-year29.2 (28.8 - 29.6)32.8 (32.3 - 33.4)25.4 (24.8 - 26.1)18.1 (14.6 - 22.0)
  5-year16.5 (16.1 - 16.8)18.6 (18.2 - 19.1)14.2 (13.7 - 14.8)10.6 (7.8 - 13.9)
  10-year10.5 (10.2 - 10.8)12.5 (12.0 - 12.9)8.1 (7.6 - 8.6)6.4 (4.1 - 9.3)
  Median (months)10.512.48.98.5


Table 12. Univariate and Multivariable Cox-Proportional Hazard Ratios (HRs) of Mortality for Esophageal Cancer
 
EsophagusAdenosquamous vs. adenocarcinomaAdenosquamous vs. squamous
Univariate, HR (95% CI)Multivariable, HR (95% CI)Univariate, HR (95% CI)Multivariable, HR (95% CI)
P < 0.05 relative to reference unless noted by aP ≥ 0.05. Reference categories: sex (Male), race (White), detection stage (Localized), grade differentiation (Well), surgery (no), radiotherapy (no), and chemotherapy (no). CI: confidence interval.
Adenosquamous histology1.47 (1.35 - 1.60)1.30 (1.19 - 1.42)1.16 (1.07 - 1.27)1.21 (1.10 - 1.32)
Age (per 10 years)1.10 (1.09 - 1.11)1.08 (1.07 - 1.09)1.05 (1.04 - 1.07)1.02 (1.01 - 1.03)
Sex
  Female1.04 (1.01 - 1.08)0.97 (0.93 - 1.00)0.84 (0.81 - 0.86)0.86 (0.84 - 0.89)
Race
  Black1.16 (1.08 - 1.24)1.05 (0.98 - 1.13)a1.21 (1.17 - 1.24)1.13 (1.09 - 1.16)
  Other0.99 (0.93 - 1.07)a0.88 (0.82 - 0.95)1.02 (0.98 - 1.06)a0.97 (0.93 - 1.10)a
Detection stage
  Regional1.92 (1.85 - 1.99)2.22 (2.13 - 2.30)1.21 (1.16 - 1.25)1.44 (1.39 - 1.50)
  Distant4.59 (4.43 - 4.75)3.84 (3.69 - 4.00)2.36 (2.28 - 2.45)2.34 (2.26 - 2.43)
  Unstaged2.95 (2.82 - 3.10)1.86 (1.77 - 1.95)1.60 (1.54 - 1.67)1.26 (1.21 - 1.32)
Grade differentiation
  Moderate1.54 (1.45 - 1.64)1.27 (1.19 - 1.35)1.17 (1.10 - 1.24)1.16 (1.09 - 1.24)
  Poor2.23 (2.10 - 2.37)1.68 (1.58 - 1.79)1.33 (1.25 - 1.41)1.24 (1.17 - 1.32)
  Unknown1.62 (1.52 - 1.73)1.18 (1.10 - 1.25)1.16 (1.09 - 1.24)1.03 (0.96 - 1.10)a
Surgery (yes)0.294 (0.286 - 0.302)0.39 (0.37 - 0.40)0.51 (0.49 - 0.53)0.47 (0.45 - 0.49)
Chemotherapy (yes)0.98 (0.96 - 1.01)0.56 (0.54 - 0.58)0.61 (0.60 - 0.63)0.53 (0.51 - 0.55)
Radiotherapy (yes)0.96 (0.94 - 0.98)1.03 (1.00 - 1.06)0.72 (0.70 - 0.74)0.80 (0.78 - 0.83)


Table 13. Demographics and Clinical Characteristics for Colorectal Cancer by Histology
 
ColorectalAllAdenocarcinomaSquamousAdenosquamousP value
P < 0.05 for all comparisons between adenocarcinoma, squamous cell carcinoma and adenosquamous cell carcinoma comparisons. Incidence rates were expressed per 100,000. CSS: cause-specific survival; RS: relative survival; CI: confidence interval; SD: standard deviation.
N (%)976,218 (100.0)654,583 (67.1)4,099 (0.4)499 (0.1)
Age (years) (%)
  0 - 14388 (< 1)18 (< 1)0 (0.0)0 (0.0)< 0.001
  15 - 296,306 (0.6%)2,517 (0.4)14 (0.3)7 (1.4)
  30 - 4991,261 (9.3)59,034 (9.0)567 (13.8)69 (13.8)
  50 - 69417,273 (42.7)276,839 (42.3)2,237 (54.6)217 (43.5)
  70 - 89460,990 (47.2)316,175 (48.3)1,281 (31.3)206 (41.3)
  Mean (SD)67.1 (13.2)67.5 (12.8)62.9 (12.6)64.6 (14.2)< 0.001
  Median68696366
Sex (%)
  Male508,045 (52.0)344,212 (52.6)1,367 (33.3)239 (47.9)< 0.001
  Female468,173 (48.0)310,371 (47.4)2,732 (66.7)260 (52.1)
Race (%)
  White797,944 (81.7)535,324 (81.8)3,535 (86.2)416 (83.4)< 0.001
  Black96,336 (9.9)62,425 (9.5)451 (11.0)55 (11.0)
  Other81,938 (8.4)56,834 (8.7)113 (2.8)28 (5.6)
Detection stage (%)
  Localized382,652 (39.2)211,323 (32.3)1,563 (38.1)68 (13.6)< 0.001
  Regional349,452 (35.8)272,190 (41.6)1,172 (28.6)208 (41.7)
  Distant197,244 (20.2)145,939 (22.3)731 (17.8)211 (42.3)
  Unstaged46,870 (4.8)25,131 (3.8)633 (15.4)12 (2.4)
Grade differentiation (%)
  Well100,493 (10.3)50,960 (7.8)205 (5.0)8 (1.6)< 0.001
  Moderate530,921 (54.4)402,646 (61.5)1,138 (27.8)100 (20.0)
  Poor156,586 (16.0)111,890 (17.1)1,310 (32.0)307 (61.5)
  Unknown188,218 (19.3)89,087 (13.6)1,446 (35.3)84 (16.8)
Surgery (%)
  Yes832,886 (85.3)560,355 (85.6)1,293 (31.5)414 (83.0)< 0.001
  No143,332 (14.7)94,228 (14.4)2,806 (68.5)85 (17.0)
Chemotherapy (%)
  Yes309,619 (31.7)238,979 (36.5)2,536 (61.9)232 (46.5)< 0.001
  No666,599 (68.3)415,604 (63.5)1,563 (38.1)267 (53.5)
Radiotherapy (%)
  Yes117,214 (12.0)91,656 (14.0)2,611 (63.7)101 (20.2)< 0.001
  No859,004 (88.0)562,927 (86.0)1,488 (36.3)398 (79.8)
Incidence rate (95% CI)-
  All427 (426 - 428)279 (278 - 280)2.1 (2.0 - 2.2)0.20 (0.18 - 0.22)
  Male492 (491 - 494)328 (326 - 329)1.5 (1.4 - 1.6)0.22 (0.18 - 0.25)
  Female373 (372 - 374)240 (239 - 241)2.6 (2.5 - 2.7)0.19 (0.16 - 0.22)
CSS (95% CI)-
  1-year84.6 (84.5 - 84.7)84.2 (84.1 - 84.3)81.2 (79.7 - 82.6)61.3 (55.3 - 66.8)
  2-year77.1 (76.9 - 77.2)75.6 (75.5 - 75.8)72.0 (70.2 - 73.7)47.2 (41.1 - 53.1)
  5-year65.3 (65.2 - 65.4)61.7 (61.6 - 61.9)63.9 (61.9 - 65.8)35.7 (29.8 - 41.6)
  10-year58.8 (58.6 - 58.9)54.3 (54.1 - 54.5)59.7 (57.6 - 61.8)32.9 (27.0 - 38.9)
  Median (months)---20.3
RS (95% CI)-
  1-year81.0 (80.9 - 81.1)80.5 (80.4 - 80.7)77.7 (76.1 - 79.2)58.7 (52.7 - 64.1)
  2-year71.9 (71.8 - 72.0)70.4 (70.3 - 70.6)67.3 (65.5 - 69.0)44.4 (38.5 - 50.1)
  5-year55.8 (55.6 - 55.9)52.4 (52.2 - 52.6)55.8 (53.8 - 57.7)32.0 (26.6 - 37.7)
  10-year41.4 (41.2 - 41.5)37.5 (37.3 - 37.6)46.1 (43.9 - 48.2)26.4 (21.0 - 32.0)
  Median (months)80.367.394.517.0


Table 14. Univariate and Multivariable Cox-Proportional Hazard Ratios (HRs) of Mortality for Colorectal Cancer
 
ColorectalAdenosquamous vs. adenocarcinomaAdenosquamous vs. squamous
Univariate, HR (95% CI)Multivariable, HR (95% CI)Univariate, HR (95% CI)Multivariable, HR (95% CI)
P < 0.05 relative to reference unless noted by aP ≥ 0.05. Reference categories: sex (Male), race (White), detection stage (Localized), grade differentiation (Well), surgery (no), radiotherapy (no), and chemotherapy (no). CI: confidence interval.
Adenosquamous histology2.15 (1.91 - 2.42)1.44 (1.28 - 1.63)2.20 (1.93 - 2.50)1.26 (1.08 - 1.47)
Age (per 10 years)1.109 (1.105 - 1.112)1.204 (1.201 - 1.209)1.21 (1.16 - 1.26)1.18 (1.13 - 1.23)
Sex
  Female0.94 (0.93 - 0.95)0.935 (0.928 - 0.943)0.69 (0.63 - 0.76)0.74 (0.67 - 0.82)
Race
  Black1.24 (1.22 - 1.25)1.17 (1.16 - 1.19)1.26 (1.09 - 1.46)1.18 (1.02 - 1.37)
  Other0.90 (0.89 - 0.92)0.92 (0.91 - 0.93)1.19 (0.90 - 1.58)a0.86 (0.65 - 1.14)a
Detection stage
  Regional2.26 (2.23 - 2.29)2.51 (2.48 - 2.54)2.07 (1.80 - 2.38)2.19 (1.90 - 2.53)
  Distant12.0 (11.0 - 12.2)12.0 (11.9 - 12.2)7.41 (6.46 - 8.50)7.17 (6.20 - 8.28)
  Unstaged5.10 (5.00 - 5.21)2.89 (2.83 - 2.96)2.20 (1.85 - 2.61)1.72 (1.44 - 2.06)
Grade differentiation
  Moderate1.17 (1.15 - 1.19)1.04 (1.02 - 1.06)1.31 (1.01 - 1.71)1.26 (0.96 - 1.64)a
  Poor1.92 (1.89 - 1.96)1.48 (1.46 - 1.51)1.73 (1.33 - 2.24)1.40 (1.08 - 1.83)
  Unknown2.43 (2.38 - 2.48)1.17 (1.15 - 1.20)1.39 (1.07 - 1.81)1.09 (0.84 - 1.43)a
Surgery (yes)0.203 (0.201 - 0.205)0.410 (0.405 - 0.414)0.92 (0.83 - 1.02)a0.72 (0.64 - 0.82)
Chemotherapy (yes)1.41 (1.40 - 1.42)0.75 (0.74 - 0.76)0.59 (0.53 - 0.65)0.64 (0.56 - 0.72)
Radiotherapy (yes)1.08 (1.06 - 1.09)1.12 (1.10 - 1.13)0.48 (0.43 - 0.53)0.68 (0.60 - 0.77)


Table 15. Demographics and Clinical Characteristics for Gastric Cancer by Histology
 
GastricAllAdenocarcinomaSquamousAdenosquamousP value
P < 0.05 for all comparisons between adenocarcinoma, squamous cell carcinoma and adenosquamous cell carcinoma comparisons. Incidence rates were expressed per 100,000. CSS: cause-specific survival; RS: relative survival; CI: confidence interval; SD: standard deviation.
N (%)163,791 (100.0)103,143 (63.0)1,306 (0.8)479 (0.3)
Age (years) (%)
  0 - 1445 (< 1)3 (< 1)0 (0.0)0 (0.0)< 0.001
  15 - 291,149 (0.7)493 (0.5)4 (0.3)2 (0.4)
  30 - 4916,632 (10.2)8,103 (7.9)76 (5.8)39 (8.1)
  50 - 6966,842 (40.8)41,002 (39.8)632 (48.4)257 (53.7)
  70 - 8979,123 (48.3)53,542 (51.9)594 (45.5)181 (37.8)
  Mean (SD)67.2 (13.4)68.5 (12.7)67.3 (11.7)65.6 (11.6)< 0.001
  Median69706866
Sex (%)
  Male100,682 (61.5)68,577 (66.5)926 (70.9)346 (72.2)< 0.001
  Female63,109 (38.5)34,566 (33.5)380 (29.1)133 (27.8)
Race (%)
  White118,825 (72.5)74,681 (72.4)951 (72.8)371 (77.5)< 0.001
  Black19,550 (11.9)11,583 (11.2)236 (18.1)61 (12.7)
  Other25,416 (15.5)16,879 (16.4)119 (9.1)47 (9.8)
Detection Stage (%)
  Localized41,461 (25.3)22,366 (21.7)227 (17.4)59 (12.3)< 0.001
  Regional45,864 (28.0)32,103 (31.1)337 (25.8)186 (38.8)
  Distant58,576 (35.8)38,774 (37.6)541 (41.4)206 (43.0)
  Unstaged17,890 (10.9)9,900 (9.6)201 (15.4)28 (5.8)
Grade Differentiation (%)
  Well9,547 (5.8)4,779 (4.6)64 (4.9)3 (0.6)< 0.001
  Moderate30,480 (18.6)25,698 (24.9)330 (25.3)63 (13.2)
  Poor75,552 (46.1)49,344 (47.8)542 (41.5)306 (63.9)
  Unknown48,212 (29.4)23,322 (22.6)370 (28.3)107 (22.3)
Surgery (%)
  Yes81,339 (49.7)50,124 (48.6)342 (26.2)263 (54.9)< 0.001
  No82,452 (50.3)53,019 (51.4)964 (73.8)216 (45.1)
Chemotherapy (%)
  Yes63,961 (39.1)42,283 (41.0)575 (44.0)244 (50.9)< 0.001
  No99,830 (60.9)60,860 (59.0)731 (56.0)235 (49.1)
Radiotherapy (%)
  Yes31,035 (18.9)22,608 (21.9)505 (38.7)160 (33.4)< 0.001
  No132,756 (81.1)80,535 (78.1)801 (61.3)319 (66.6)
Incidence Rate (95% CI)-
  All73.7 (73.3 - 74.1)43.6 (43.3 - 43.9)0.57 (0.54 - 0.61)0.19 (0.17 - 0.21)
  Male99.9 (99.2 - 100.7)65.2 (64.7 - 65.8)0.90 (0.83 - 0.97)0.29 (0.26 - 0.34)
  Female53.1 (52.6 - 53.5)26.4 (26.1 - 26.7)0.30 (0.27 - 0.34)0.10 (0.08 - 0.12)
CSS (95% CI)-
  1-year56.8 (56.5 - 57.1)53.3 (52.9 - 53.7)38.2 (34.6 - 41.8)44.3 (38.2 - 50.3)
  2-year43.1 (42.7 - 43.4)37.7 (37.3 - 38.1)24.9 (21.7 - 28.2)23.7 (18.6 - 29.2)
  5-year32.5 (32.1 - 32.8)26.0 (25.7 - 26.4)18.4 (15.4 - 21.6)16.9 (12.5 - 22.0)
  10-year28.5 (28.2 - 28.8)22.3 (21.9 - 22.7)17.1 (14.1 - 20.4)14.0 (9.7 - 19.0)
  Median (Months)16.613.77.710.3
RS (95% CI)-
  1-year53.5 (53.2 - 53.8)49.9 (49.5 - 50.3)35.3 (31.9 - 38.7)41.4 (35.5 - 47.2)
  2-year39.1 (38.8 - 39.4)33.9 (33.5 - 34.3)22.8 (19.8 - 25.9)21.7 (16.9 - 26.8)
  5-year26.5 (26.2 - 26.8)20.7 (20.3 - 21.0)14.6 (12.0 - 17.5)14.7 (10.7 - 19.4)
  10-year19.0 (18.8 - 19.3)13.9 (13.6 - 14.3)10.9 (8.5 - 13.6)9.5 (6.1 - 13.9)
  Median (Months)14.012.06.89.4


Table 16. Univariate and Multivariable Cox-Proportional Hazard Ratios (HRs) of Mortality for Gastric Cancer
 
GastricAdenosquamous vs. adenocarcinomaAdenosquamous vs. squamous
Univariate, HR (95% CI)Multivariable, HR (95% CI)Univariate, HR (95% CI)Multivariable, HR (95% CI)
P < 0.05 relative to reference unless noted by aP ≥ 0.05. Reference categories: sex (Male), race (White), detection stage (Localized), grade differentiation (Well), surgery (no), radiotherapy (no), and chemotherapy (no). CI: confidence interval.
Adenosquamous histology1.29 (1.16 - 1.44)1.24 (1.11 - 1.38)0.98 (0.87 - 1.12)a1.11 (0.96 - 1.27)a
Age (per 10 years)1.05 (1.04 - 1.06)1.07 (1.06 - 1.08)1.09 (1.04 - 1.15)1.09 (1.03 - 1.14)
Sex
  Female0.97 (0.95 - 0.98)0.95 (0.93 - 0.96)0.89 (0.78 - 1.01)a0.88 (0.77 - 1.00)a
Race
  Black0.97 (0.95 - 0.99)0.98 (0.96 - 1.01)a1.43 (1.22 - 1.66)1.32 (1.13 - 1.54)
  Other0.74 (0.73 - 0.76)0.82 (0.81 - 0.84)1.09 (0.89 - 1.33)a0.97 (0.79 - 1.19)a
Detection stage
  Regional2.33 (2.27 - 2.39)2.81 (2.74 - 2.89)1.40 (1.16 - 1.70)1.68 (1.37 - 2.05)
  Distant6.10 (5.95 - 6.26)4.91 (4.77 - 5.05)3.32 (2.76 - 4.00)3.09 (2.52 - 3.77)
  Unstaged3.85 (3.72 - 3.98)2.07 (2.00 - 2.15)2.12 (1.68 - 2.68)1.51 (1.18 - 1.92)
Grade differentiation
  Moderate1.48 (1.41 - 1.55)1.20 (1.15 - 1.26)1.55 (1.10 - 2.17)1.33 (0.94 - 1.87)a
  Poor2.08 (1.99 - 2.17)1.60 (1.53 - 1.67)2.07 (1.49 - 2.86)1.72 (1.23 - 2.40)
  Unknown2.10 (2.01 - 2.20)1.26 (1.21 - 1.32)1.67 (1.19 - 2.34)1.21 (0.86 - 1.70)a
Surgery (yes)0.298 (0.293 - 0.303)0.367 (0.360 - 0.375)0.45 (0.40 - 0.51)0.50 (0.42 - 0.58)
Chemotherapy (yes)1.05 (1.03 - 1.07)0.59 (0.57 - 0.60)0.72 (0.64 - 0.81)0.56 (0.49 - 0.64)
Radiotherapy (yes)0.89 (0.87 - 0.91)0.98 (0.96 - 0.99)0.71 (0.63 - 0.80)0.87 (0.76 - 0.99)