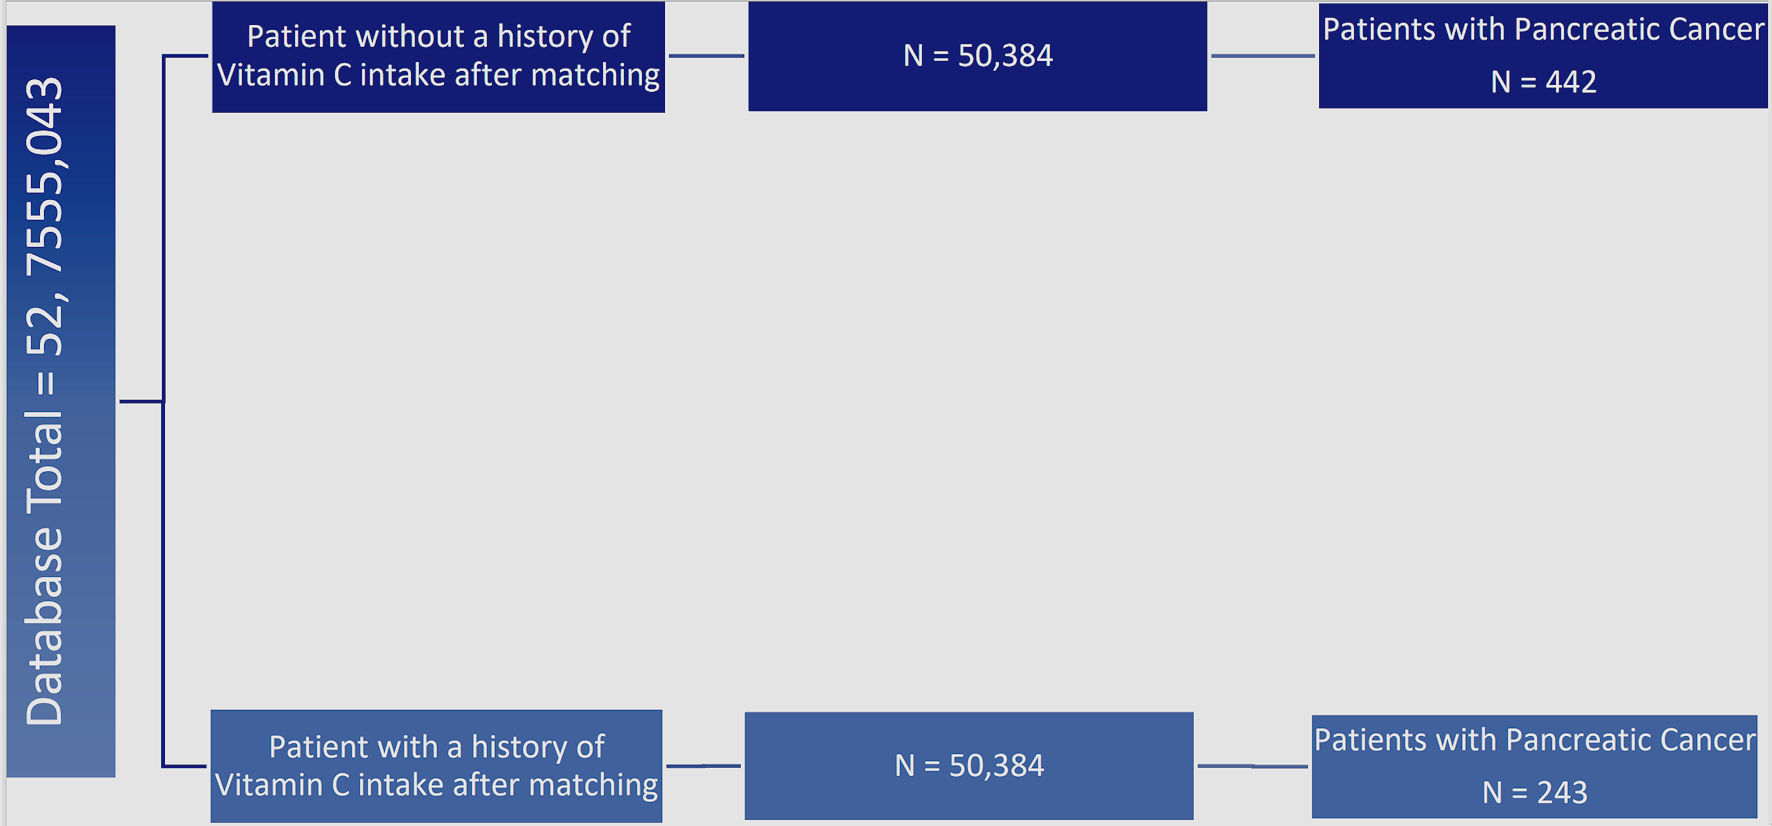
Figure 1. Flowchart of incidence of pancreatic cancer in patients with and without history of prescribed vitamin C. Left side: total patients in the database (n = 52,755,043). First and second column from the left: evaluation of incidence of pancreatic cancer in patients without a prior history of being prescribed vitamin C (dark blue, n = 50,384) and with prior prescription of vitamin C (light blue, n = 50,384). Third column from left: additional stratification and matching were done based on patient comorbidities and age, illustrating the incidence of pancreatic cancer in matched groups with and without vitamin C prescription (light blue and dark blue respectively, n = 243 and n = 442). The difference between experimental and control group was statistically significant by P < 3.174 × 10⁻¹⁴ with an odds ratio of 0.548 (95% confidence interval (CI): 0.468 - 0.641).
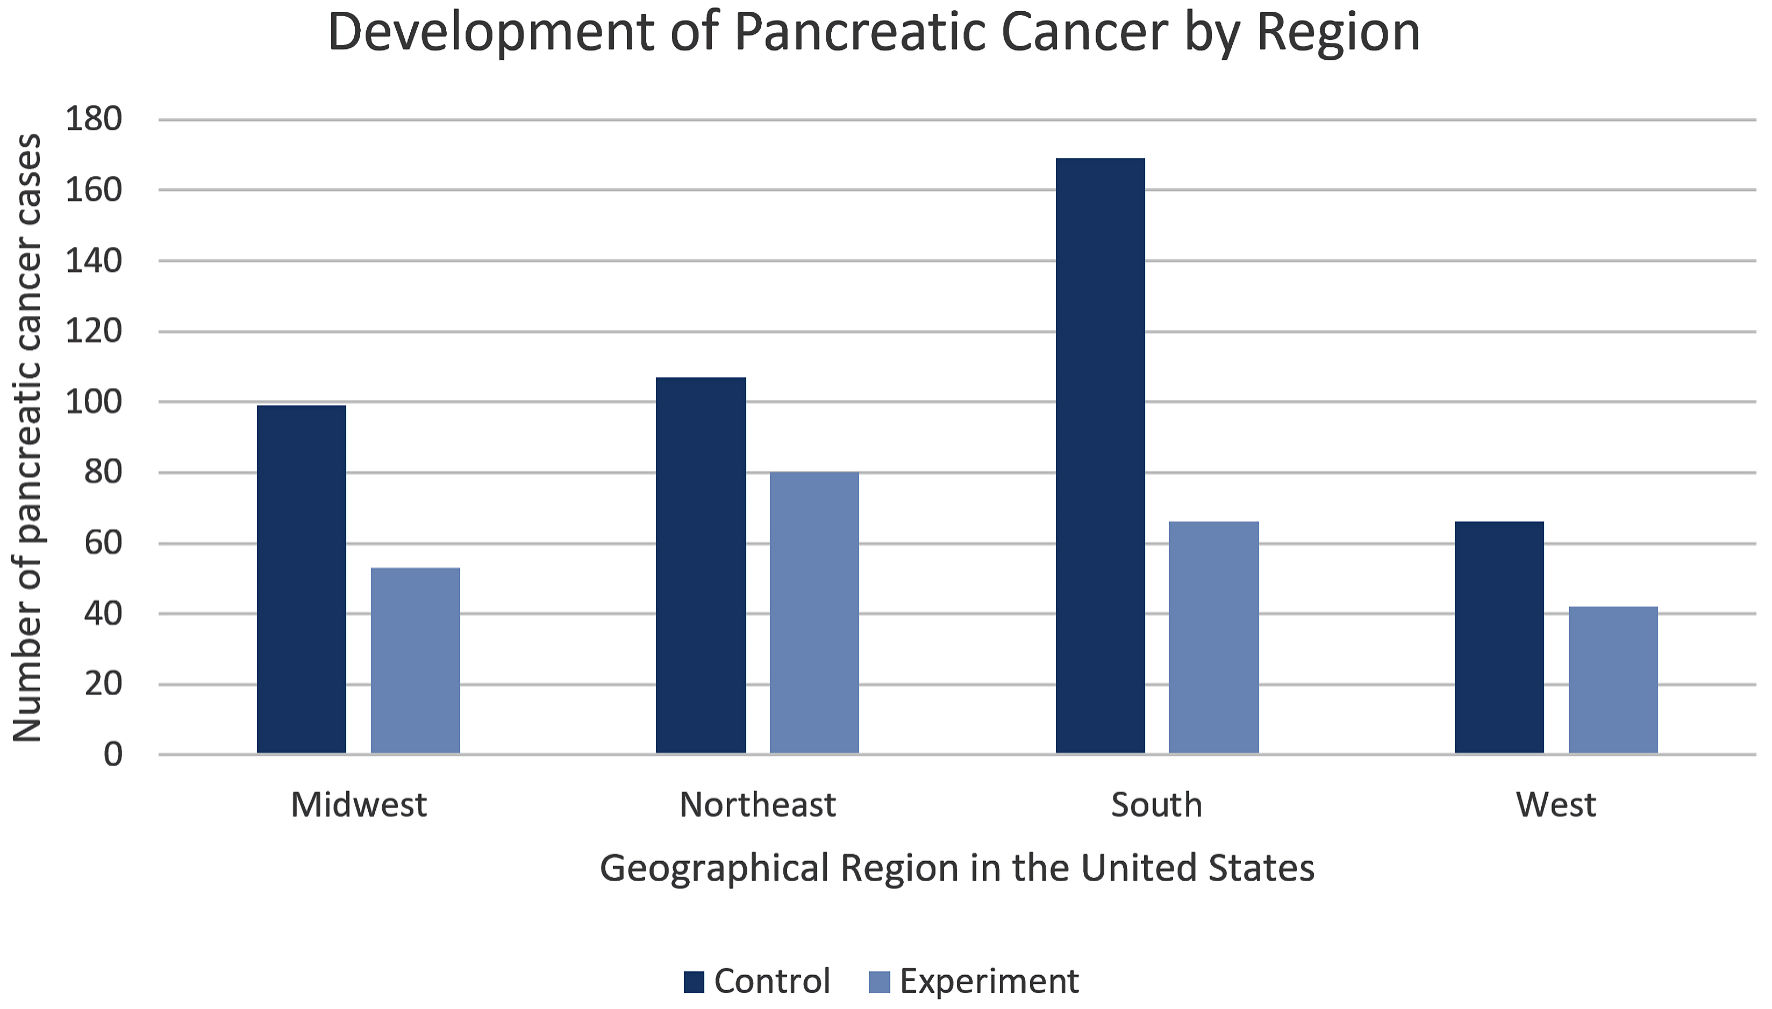
Figure 2. Regional Distribution. This bar chart shows the number of patients with pancreatic cancer sorted by United States region without prior history of prescribed vitamin C (dark blue) and with prior history of prescribed vitamin C (light blue). Patients from the control group located in the southern region display the highest incidence of pancreatic cancer in both groups.
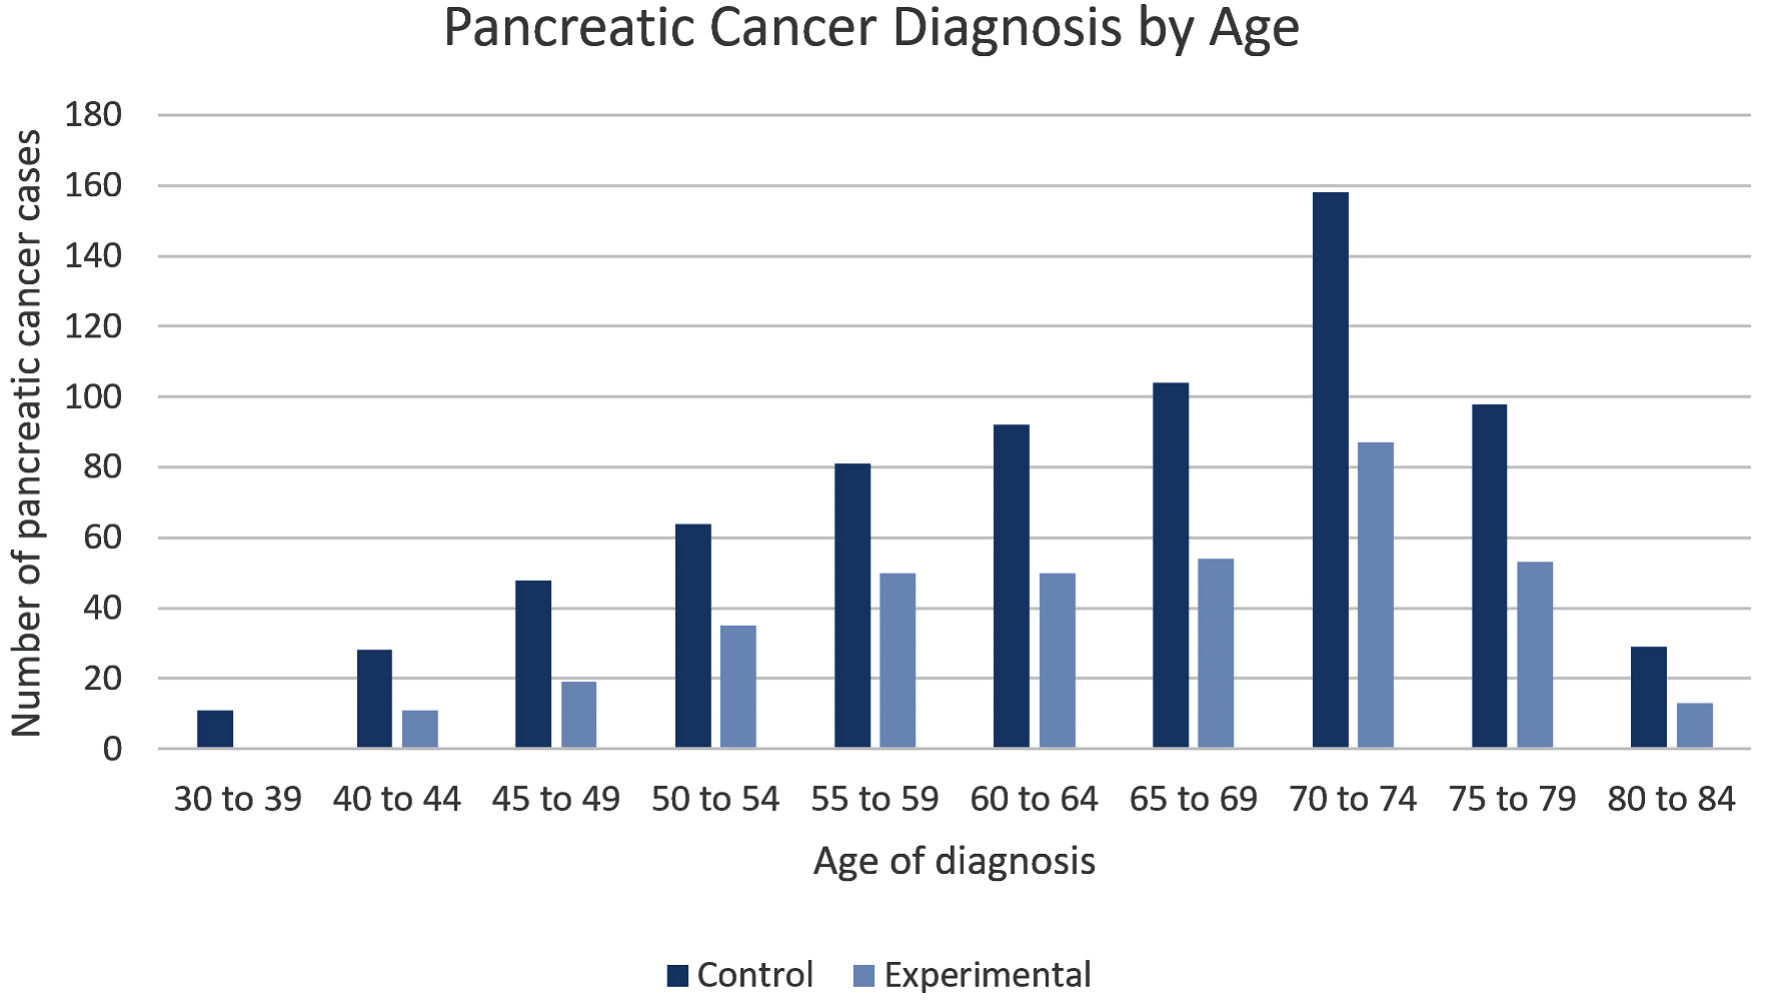
Figure 3. Age Distribution. Incidence of pancreatic cancer is sorted by age in patients without history of prescribed vitamin C (dark blue) and no history of prescribed vitamin C (light blue) groups. Patients in the experimental group showed consistently lower numbers of pancreatic cancer cases in all age ranges and the number of pancreatic cancer cases peaked in the age range 70 - 74 for both groups. The difference between experimental and control group was statistically significant by P < 3.174 × 10⁻¹⁴ with an odds ratio of 0.548 (95% confidence interval (CI): 0.468 - 0.641).
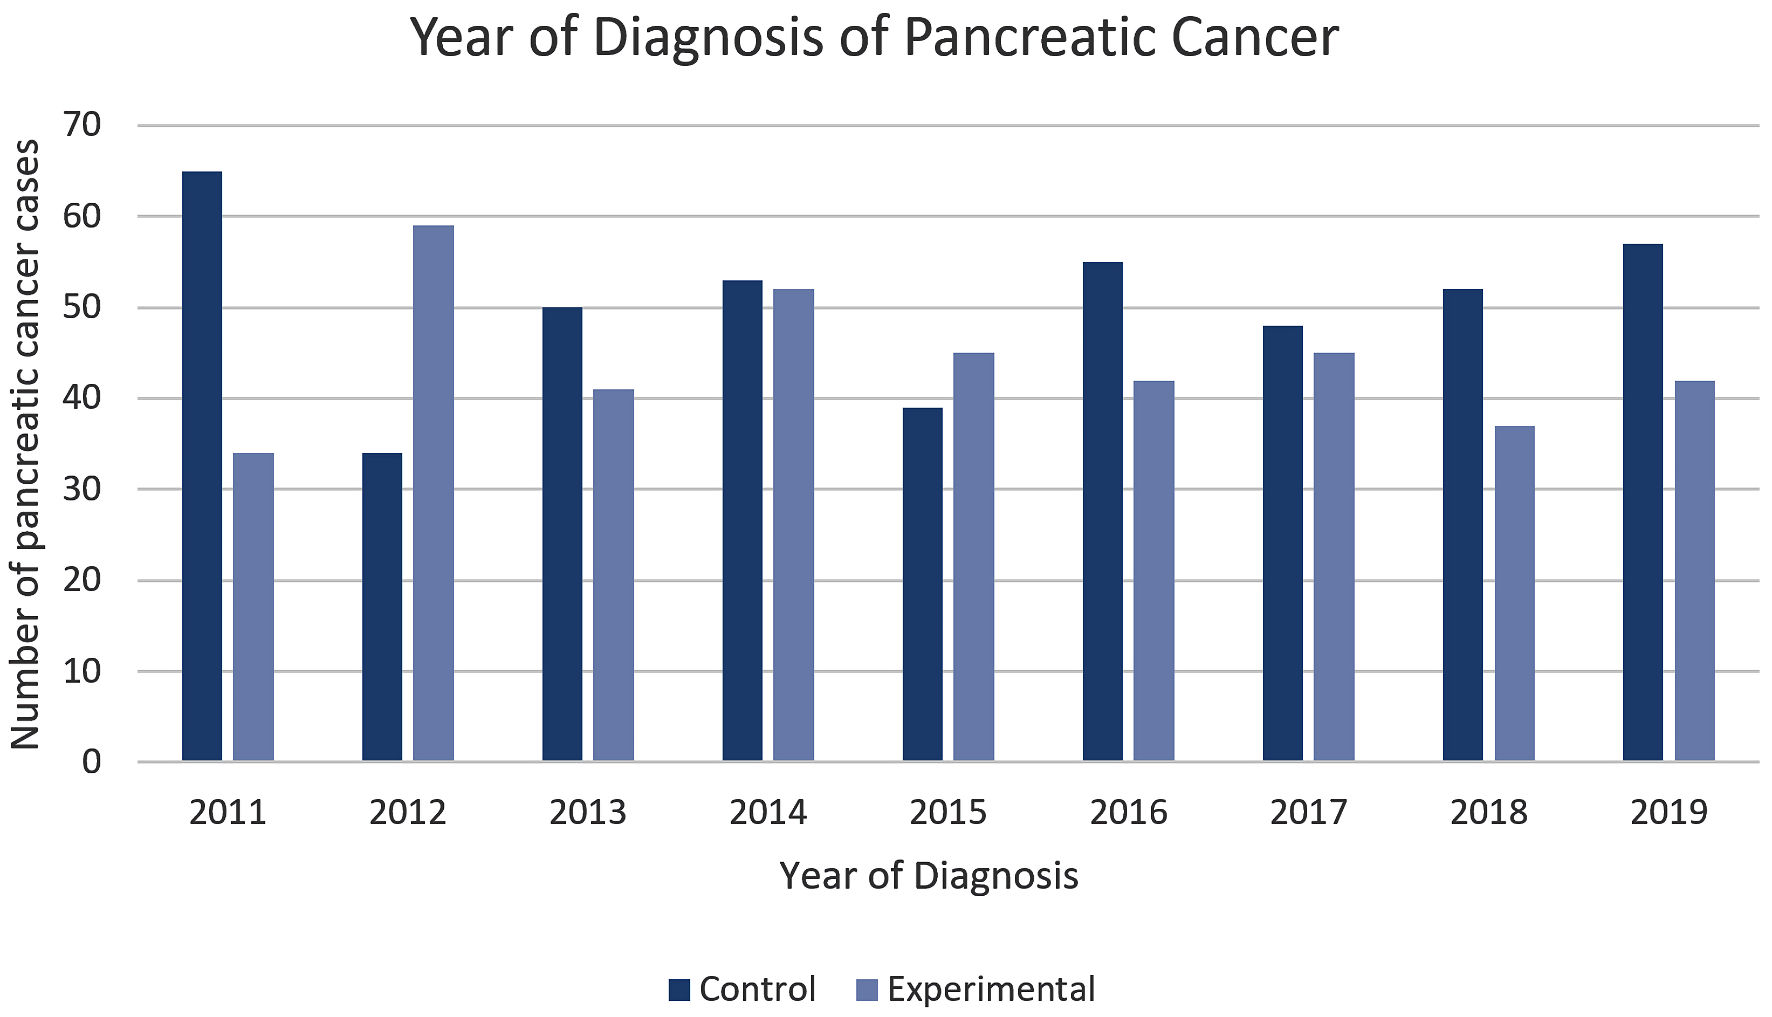
Figure 4. Incidence of pancreatic cancer by year. This figure illustrates the incidence of pancreatic cancer in both the experimental and control group by year. The control group was shown to have the highest incidence of pancreatic cancer in 6 out of the 8 years. The difference between experimental and control group was statistically significant by P < 3.174 × 10⁻¹⁴ with an odds ratio of 0.548 (95% confidence interval (CI): 0.468 - 0.641).