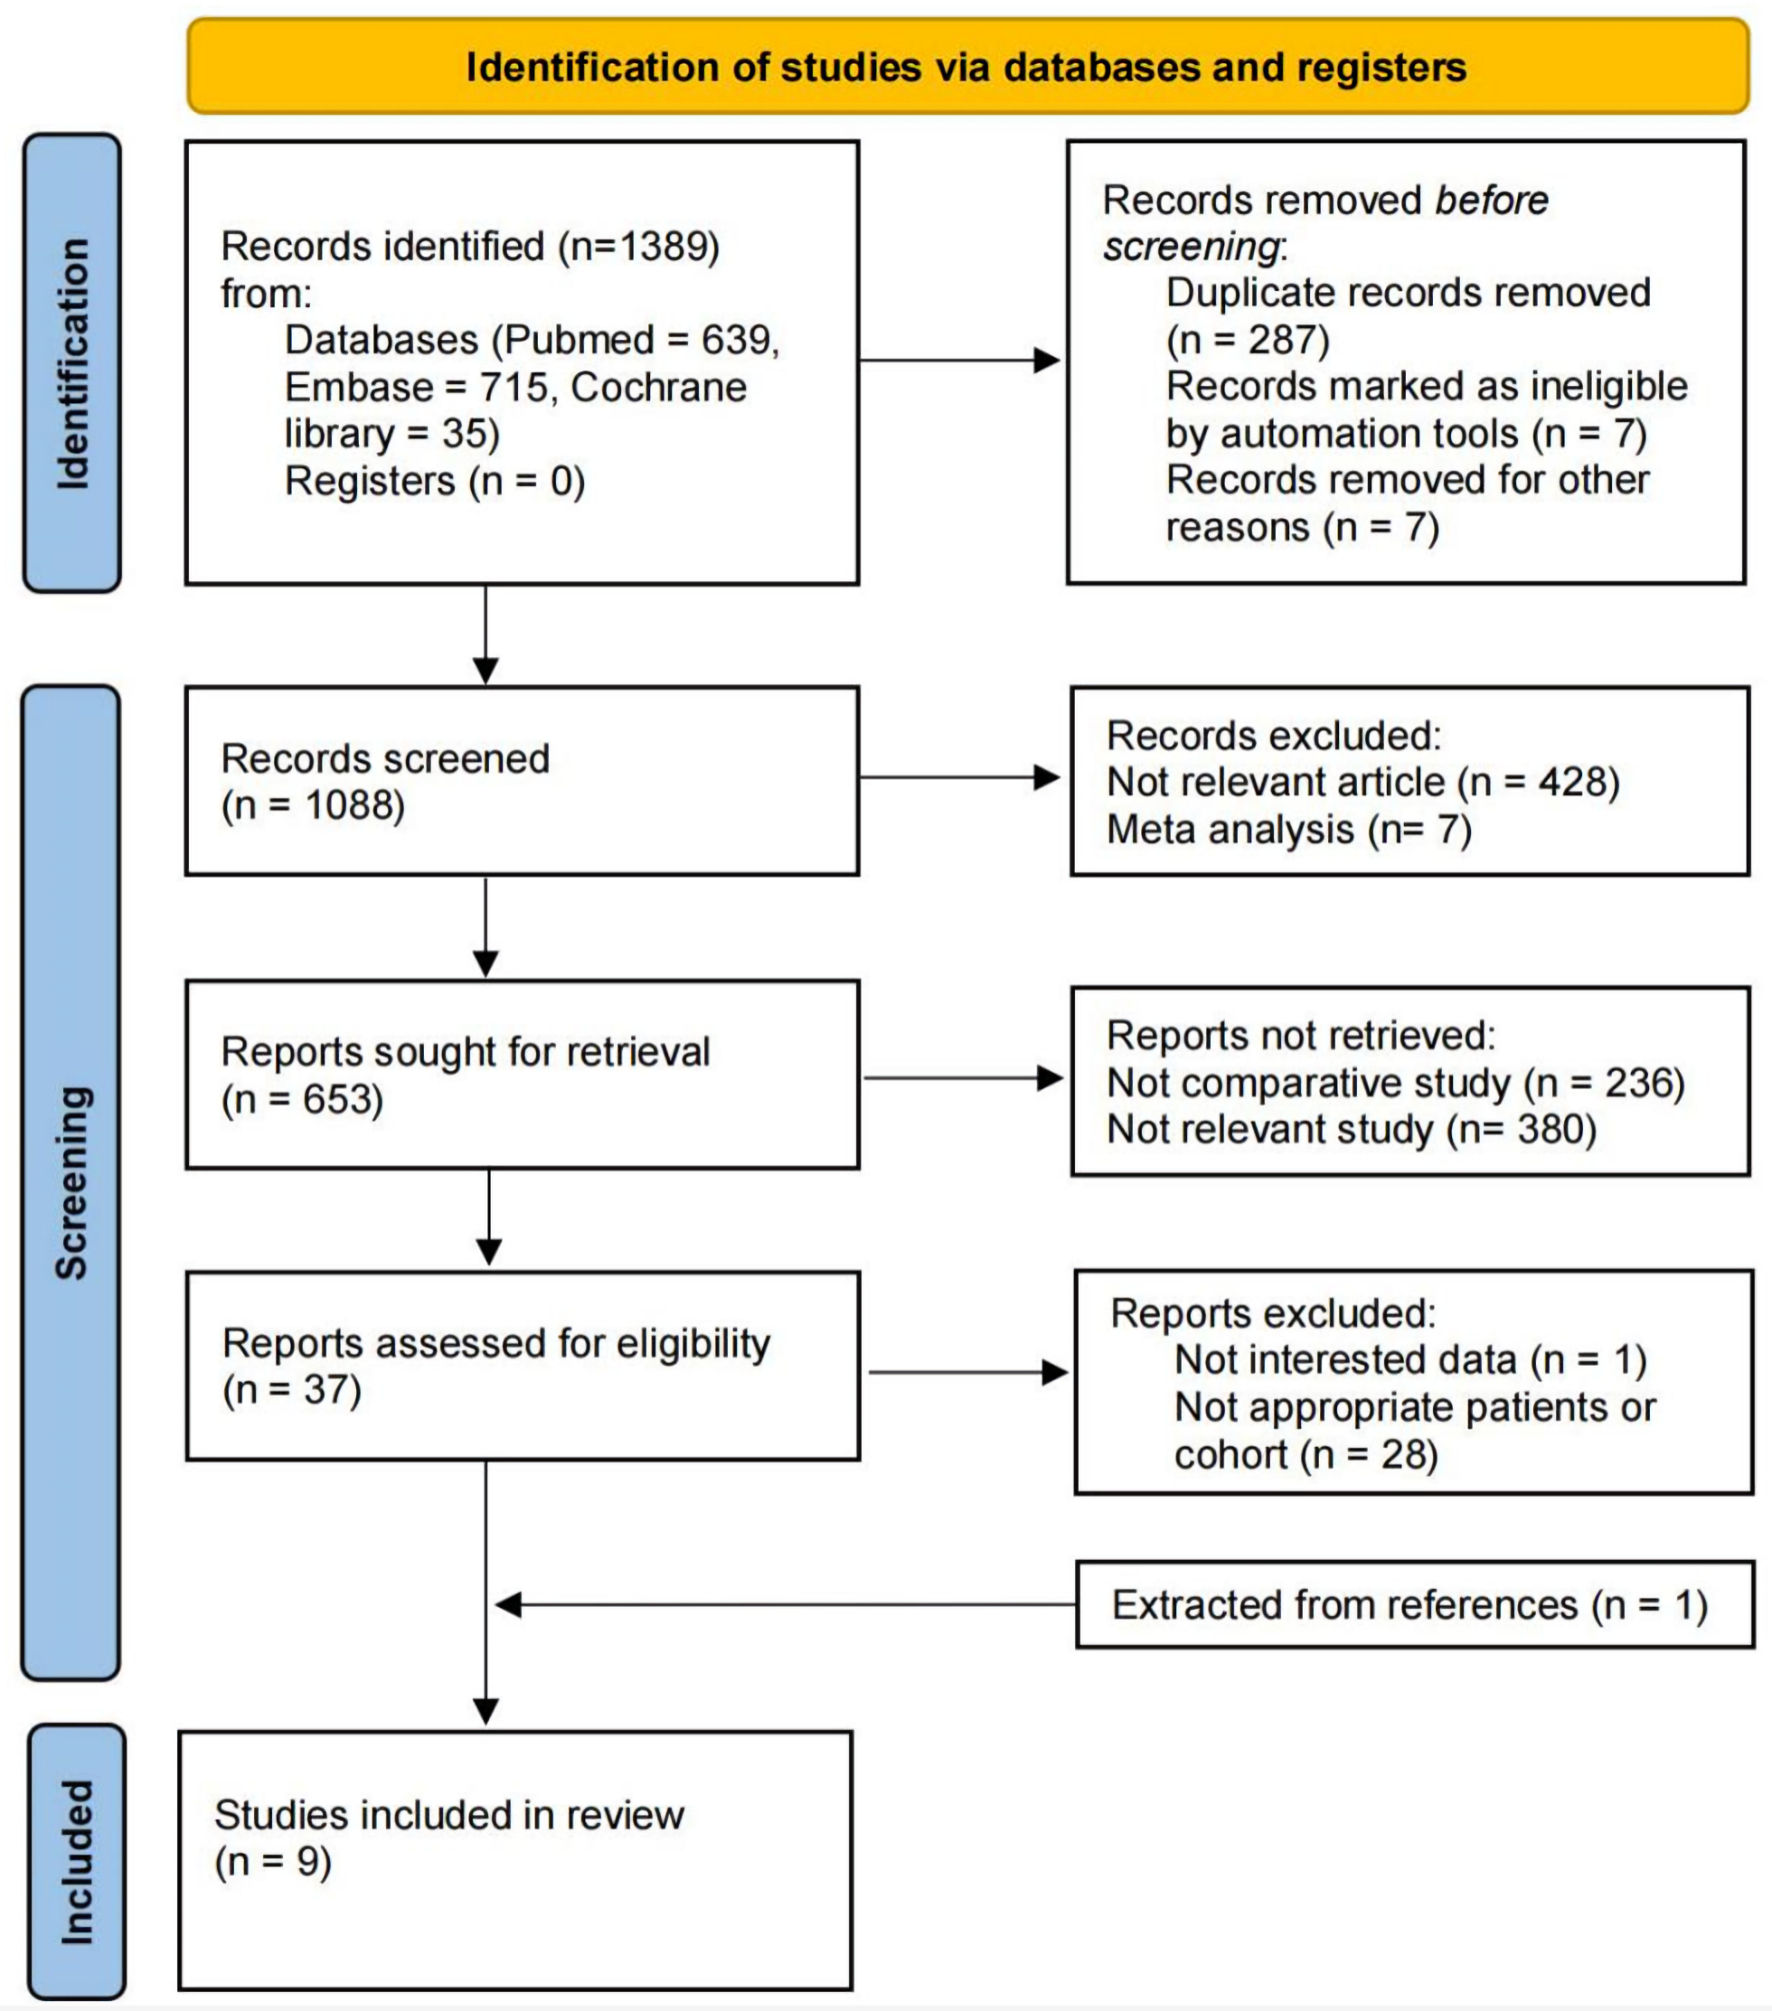
Figure 1. The PRISMA (Preferred Reporting Items for Systematic Reviews and Meta-Analyses) 2020 flow diagram for the systematic review.
| World Journal of Oncology, ISSN 1920-4531 print, 1920-454X online, Open Access |
| Article copyright, the authors; Journal compilation copyright, World J Oncol and Elmer Press Inc |
| Journal website https://www.wjon.org |
Original Article
Volume 15, Number 4, August 2024, pages 625-639
Comparison of Outcomes Between Partial and Radical Laparoscopic Nephrectomy for Localized Renal Tumors Larger Than Four Centimeters: A Systematic Review and Meta-Analysis
Figures

Tables
| Study | Country | Period | Cohort | Cohort size | Age | BMI (kg/m2) | M/F | Tumor side | cT1b | Perioperative eGFR (mL/min) | Perioperative CKD | Follow-up |
|---|---|---|---|---|---|---|---|---|---|---|---|---|
| aThe original data format is not mean ± standard deviation, and the data in the table are obtained after estimation and adjustment of the original data. LPN: laparoscopic partial nephrectomy; LRN: laparoscopic radical nephrectomy; MIPN: minimally invasive partial nephrectomy; MIRN: minimally invasive radical nephrectomy; RLPN: robotic-assisted laparoscopic partial nephrectomy; RLRN: robotic-assisted laparoscopic radical nephrectomy; BMI: body mass index; R/L: right/left; eGFR: estimated glomerular filtration rate; CKD: chronic kidney disease; NA: not available; mo: months; yr: years; M/F: male/female. | ||||||||||||
| Simmons et al, 2009 [10] | USA | 2001 - 2005 | LPN | 35 | 63.5 ± 12 | 32.1 ± 10 | 26/9 | R22/L13 | NA | 74 ± 27 | III 8/35 (22%) | 44 mo |
| IV 3/35 (9%) | ||||||||||||
| V (0) | ||||||||||||
| LRN | 75 | 63.4 ± 12 | 29.5 ± 7 | 39/36 | R37/L38 | NA | 80.4 ± 31 | III 17/75 (23%) | 57 mo | |||
| IV 1/75 (1%) | ||||||||||||
| V (0) | ||||||||||||
| Deklaj et al, 2010 [11] | USA | 2002 - 2008 | LPN | 33 | 59.6 ± 15.0a | 29.0 ± 5.5a | 23/10 | NA | 33 | 87.4 ± 39.4 | ≥ III 6/33 (18%) | 15 mo |
| V (0) | ||||||||||||
| LRN | 52 | 64.4 ± 14.5a | 30.0 ± 5.8a | 28/24 | NA | 52 | 101.4 ± 41.8 | ≥ III 13/52 (25%) | 21 mo | |||
| V (0) | ||||||||||||
| Brewer et al, 2012 [9] | USA | 2004 - 2010 | MIPN | 45 | 62.6 ± 15.2 | 31.5 ± 6.5 | 28/17 | R21/L24 | NA | NA | III - IV 16/45 (36%) | NA |
| MIRN | 108 | 65.1 ± 13.2 | 31.4 ± 7.5 | 69/39 | R51/57 | NA | NA | III - IV 47/108 (44%) | NA | |||
| Cai et al, 2018 [16] | China | 2005 - 2012 | LPN | 39 | 53 ± 9.0a | 23.55 ± 3.82 | 26/13 | R21/L18 | 39 | 78.94 ± 18.74 | NA | 67 mo |
| LRN | 160 | 54 ± 14.8a | 23.25 ± 4.19 | 97/63 | R68/L92 | 160 | 85.27 ± 19.87 | NA | 70 mo | |||
| Mizrahi et al, 2018 [12] | Israel | 2012 - 2017 | LPN | 13 | NA | NA | 8/5 | NA | 0 | NA | NA | 44.5 mo |
| LRN | 16 | NA | NA | 10/6 | NA | 0 | NA | NA | 44.5 mo | |||
| Deng et al, 2019 [13] | China | 2008 - 2017 | RLPN | 74 | 48.5 ± 11.8 | NA | 41/33 | R39/L35 | 52 | 85.2 ± 19.6 | ≥ III 11/74 (14.9%) | 41.0 mo |
| RLRN | 74 | 48.8 ± 12.5 | NA | 42/32 | R40/L34 | 53 | 86.7 ± 18.6 | ≥ III 9/74 (12.2%) | 36.0 mo | |||
| Yang et al, 2020 [14] | China | 2003 - 2016 | LPN | 177 | 56.9 ± 9.81 | 23.8 ± 2.61 | 112/65 | R89/L88 | 177 | 95.3 ± 32.4 | ≥ III 14/177 (7.9%) | 55.0 mo |
| LRN | 154 | 57.1 ± 9.62 | 23.6 ± 2.25 | 99/55 | R75/L79 | 154 | 92.6 ± 23.5 | ≥ III 19/154 (12.3%) | 54.7 mo | |||
| Yu et al, 2020 [17] | China | NA | LPN | 62 | 49.77 ± 5.58 | 24.73 ± 4.59 | 42/20 | R34/L28 | 62 | 83.07 ± 10.47 | NA | 60 mo |
| LRN | 84 | 50.89 ± 5.78 | 25.19 ± 3.99 | 56/28 | R44/L40 | 84 | 83.56 ± 13.66 | NA | 60 mo | |||
| Sun et al, 2023 [15] | China | 2012 - 2017 | LPN | 51 | 56.10 ± 14.47 | 23.77 ± 2.90 | 32/19 | R27/L24 | 47 | 74.14 ± 19.18 | ≥ III 12/51 (23.5%) | 7.5 yr |
| LRN | 51 | 58.24 ± 13.05 | 23.98 ± 2.92 | 36/15 | R25/L26 | 45 | 74.54 ± 20.24 | ≥ III 11/51 (21.6%) | 7.5 yr | |||
| Baseline characteristics | LPN vs. LRN | Heterogeneity | Analysis model | ||
|---|---|---|---|---|---|
| Chi2 | I2 | P | |||
| LPN: laparoscopic partial nephrectomy; LRN: laparoscopic radical nephrectomy; WMD: weighted mean difference; OR: odds ratio; CI: confidence interval; BMI: body mass index; eGFR: estimated glomerular filtration rate; CKD: chronic kidney disease. | |||||
| Age WMD (95% CI) | -0.94 (-2.05, 0.18) | 2.72 | 0% | 0.91 | Random |
| BMI WMD (95% CI) | 0.09 (-0.32, 0.50) | 3.66 | 0% | 0.72 | Random |
| Male OR (95% CI) | 1.1 (0.86, 1.39) | 7.56 | 0% | 0.48 | Random |
| Right side OR (95% CI) | 1.15 (0.90, 1.46) | 2.44 | 0% | 0.88 | Random |
| cT1b OR (95% CI) | 1.05 (0.56, 1.96) | 0.45 | 0% | 0.50 | Random |
| Preoperative eGFR WMD (95% CI) | -1.58 (-4.28, 1.13) | 6.87 | 13% | 0.33 | Random |
| Preoperative CKD OR (95% CI) | 0.91 (0.64, 1.29) | 3.27 | 0% | 0.66 | Random |
| Study | Domain 1 | Domain 2 | Domain 3 | Domain 4 | Domain 5 | Domain 6 | Domain 7 | Overall |
|---|---|---|---|---|---|---|---|---|
| Domain 1: bias due to confounding. Domain 2: bias in selection of participants into the study. Domain 3: bias in classification of interventions. Domain 4: bias due to deviations from intended interventions. Domain 5: bias due to missing data. Domain 6: bias in measurement of outcomes. Domain 7: bias in selection of the reported result. Low risk: the study is judged to be at low risk of bias for all domains. Moderate risk: the study is judged to be at low or moderate risk of bias for all domains. Serious risk: the study is judged to be at serious risk of bias in at least one domain, but not at critical risk of bias in any domain. Critical risk: the study is judged to be at critical risk of bias in at least one domain. No information: there is no clear indication that the study is at serious or critical risk of bias and there is a lack of information in one or more key domains of bias. Low: low risk; Moderate: moderate risk; Serious: serious risk; Critical: critical risk. | ||||||||
| Simmons et al, 2009 [10] | Moderate | Moderate | Moderate | Moderate | Moderate | Low | Low | Moderate |
| Deklaj et al, 2010 [11] | Moderate | Low | Low | Moderate | Low | Low | Moderate | Moderate |
| Brewer et al, 2012 [9] | Moderate | Moderate | Low | Moderate | Moderate | Moderate | Moderate | Moderate |
| Cai et al, 2018 [16] | Moderate | Moderate | Low | Moderate | Moderate | Low | Moderate | Moderate |
| Mizrahi et al, 2018 [12] | Moderate | Moderate | Low | Moderate | Serious | Moderate | Moderate | Serious |
| Deng et al, 2019 [13] | Moderate | Low | Low | Moderate | Serious | Moderate | Moderate | Serious |
| Yang et al, 2020 [14] | Moderate | Low | Low | Moderate | Moderate | Low | Moderate | Moderate |
| Yu et al, 2020 [17] | Moderate | Low | Low | Moderate | Low | Low | Low | Moderate |
| Sun et al, 2023 [15] | Moderate | Low | Low | Moderate | Low | Low | Low | Moderate |
| Effect sizes | Intercept | Intercept P value | Slope | Slope P value | Correlation coefficient, r |
|---|---|---|---|---|---|
| C-D: Clavien-Dindo system; eGFR: estimated glomerular filtration rate; CKD: chronic kidney disease. | |||||
| Tumor size | -3.130 | 0.240 | 0.177 | 0.631 | 0.063 |
| Operative time | 1.800 | 0.210 | 0.501 | 0.939 | 0.002 |
| Intraoperative blood loss | 3.030 | 0.027 | -2.730 | 0.539 | 0.137 |
| Intraoperative complications | 1.769 | 0.376 | -0.929 | 0.48 | 0.271 |
| Postoperative complications | 1.587 | 0.024 | -0.543 | 0.054 | 0.488 |
| Postoperative complications (C-D I - II grade) | 2.248 | 0.047 | -0.755 | 0.071 | 0.717 |
| Postoperative complications (≥ C-D III grade) | 1.420 | 0.301 | -1.003 | 0.426 | 0.220 |
| eGFR decline | 1.360 | 0.511 | 9.130 | 0.202 | 0.255 |
| CKD | -3.790 | 0.007 | 1.110 | 0.041 | 0.688 |
| Tumor recurrence | 0.625 | 0.518 | -0.278 | 0.606 | 0.072 |
| Cancer-specific mortality | 0.506 | 0.359 | -0.699 | 0.172 | 0.929 |
| Overall mortality | 2.351 | 0.220 | -1.075 | 0.229 | 0.876 |
| Study | Period | Included studies | Cohort | cT | Perioperative outcomes | Renal function outcomes | Oncological outcomes | ||||||
|---|---|---|---|---|---|---|---|---|---|---|---|---|---|
| Operative time, WMD (95% CI) | EBL | Complications | eGFR decline | CKD onset | Recurrence | RFS/PFS | CSS/CSM | OS/ACM | |||||
| WMD (95% CI) | OR (95% CI) | WMD (95% CI) | RR (95% CI) | RR (95% CI) | HR (95% CI) | HR (95% CI) | HR (95% CI) | ||||||
| EBL: estimated blood loss; NA: not available; WMD: weighted mean differences; CI: confidence interval; OR: odds rate; RR: relative risk; HR: hazard ratio; RFS: recurrence-free survival; PFS: progression-free survival; CSS: cancer-specific survival; CSM: cancer-specific mortality; ACM: all-cause mortality; OS: overall survival; yr: year; PN: partial nephrectomy; RN: radical nephrectomy. | |||||||||||||
| Mir et al, 2016 [20] | 1970 - 2011 | 21 | PN: 2,584 vs. RN: 8,620 | cT1b - cT2 | 10.93 min (-17.8, 39.6), P = 0.46 | 102.61 mL (45.72, 159.49) P = 0.0004 | 1.74 (1.34, 2.24), P < 0.0001 | -8.68 mL/min (-12.62, -4.74), P < 0.0001 | 0.52 (0.36, 0.76), P = 0.0006 | 0.6 (0.46, 0.79), P = 0.0002 | NA | CSM 0.58 (0.41, 0.81), P = 0.001 | ACM 0.67 (0.51, 0.88), P = 0.005 |
| cT2 | NA | 107.61 mL (84.46, 130.75), P < 0.00001 | 2 (1.50, 2.68), P < 0.00001 | NA | NA | 0.61 (0.44, 0.86), P = 0.004 | NA | CSM 0.65 (0.44, 0.97), P = 0.03 | ACM 0.76 (0.56, 1.03), P = 0.07 | ||||
| Jiang et al, 2019 [18] | NA | 16 | PN: 4,176 vs. RN: 21,794 | cT1b | NA | NA | 1.45 (0.95, 2.21), P = 0.09 | -9.15 mL/min (-10.30, -7.99), P < 0.00001 | NA | 0.68 (0.46, 0.98), P = 0.04 | 5-yr RFS 0.99 (0.98, 1.01), P = 0.31 | 5-yr CSS 1.02 (1.01, 1.03), P = 0.0006 | 5-yr OS 1.02 (1.00, 1.05), P = 0.05 |
| 10-yr RFS 1.00 (0.91, 1.10), P = 0.97 | 10-yr CSS 1.04 (1.03, 1.06), P < 0.00001 | 10-yr OS 1.17 (0.95, 1.44), P = 0.13 | |||||||||||
| Deng et al, 2019 [23] | 1970 - 2017 | 12 | PN: 1,172 vs. RN: 1,734 | ≥ cT2 | 65.33 min (51.93, 78.73), P < 0.00001 | 97.75 mL (84.65, 110.84), P < 0.00001 | 2.82 (2.03, 3.93), P < 0.00001 | -11.59 mL/min (-9.99, -13.20), P < 0.00001 | NA | NA | NA | CSS 0.91, (0.68, 1.21), P = 0.51 | OS 0.76 (0.64, 0.90), P = 0.001 |
| Li et al, 2019 [22] | 1970 - 2017 | 11 | PN: 1,146 vs. RN: 18,135 | ≥ cT2 | NA | 100.44 mL (79.98, 120.90) P < 0.00001 | 1.96 (1.58, 2.44), P < 0.00001 | -9.00 mL/min (-13.72, -4.29), P = 0.0002 | NA | 0.57 (0.42, 0.75), P < 0.0001 | NA | CSM 0.58 (0.39, 0.86), P = 0.007 | ACM 0.78 (0.65, 0.92), P = 0.004 |
| Huang et al, 2021 [21] | 1970 - 2017 | 15 | PN: 1,975 vs. RN: 3,081 | ≥ cT2 | 44.85 min (8.17, 81.52), P = 0.02 | 103.85 mL (77.13, 130.57), P < 0.00001 | 2.09 (1.56, 2.80), P < 0.00001 | -11.74 mL/min (-13.15, -10.32), P < 0.00001 | NA | 0.69 (0.53, 0.90), P = 0.007 | NA | CSM 1.01 (0.46, 2.19), P = 0.99 | OS 0.77 (0.65, 0.90), P = 0.002 |
| CSS 0.91 (0.68, 1.21), P = 0.51 | ACM 0.58 (0.39, 0.88), P = 0.010 | ||||||||||||
| Zhang et al, 2021 [19] | 1979 - 2014 | 13 | PN: 1,974 vs. RN: 5,091 | cT1b | -3.98 min (-14.99, 7.02), P = NA | -16.47 mL (-68.06, 35.13), P = 0.53 | 1.32 (0.95, 1.84), P = 0.10 | -6.60 mL/min (-12.85, -0.35), P = 0.04 | 0.38 (0.19, 0.76), P = 0.006 | 0.53 (0.32, 0.86), P = 0.01 | PFS 0.70 (0.40, 1.24), P = 0.22 | CSS 0.91 (0.66, 1.26), P = 0.57 | OS 1.01 (0.81, 1.26), P = 0.96 |