Figures
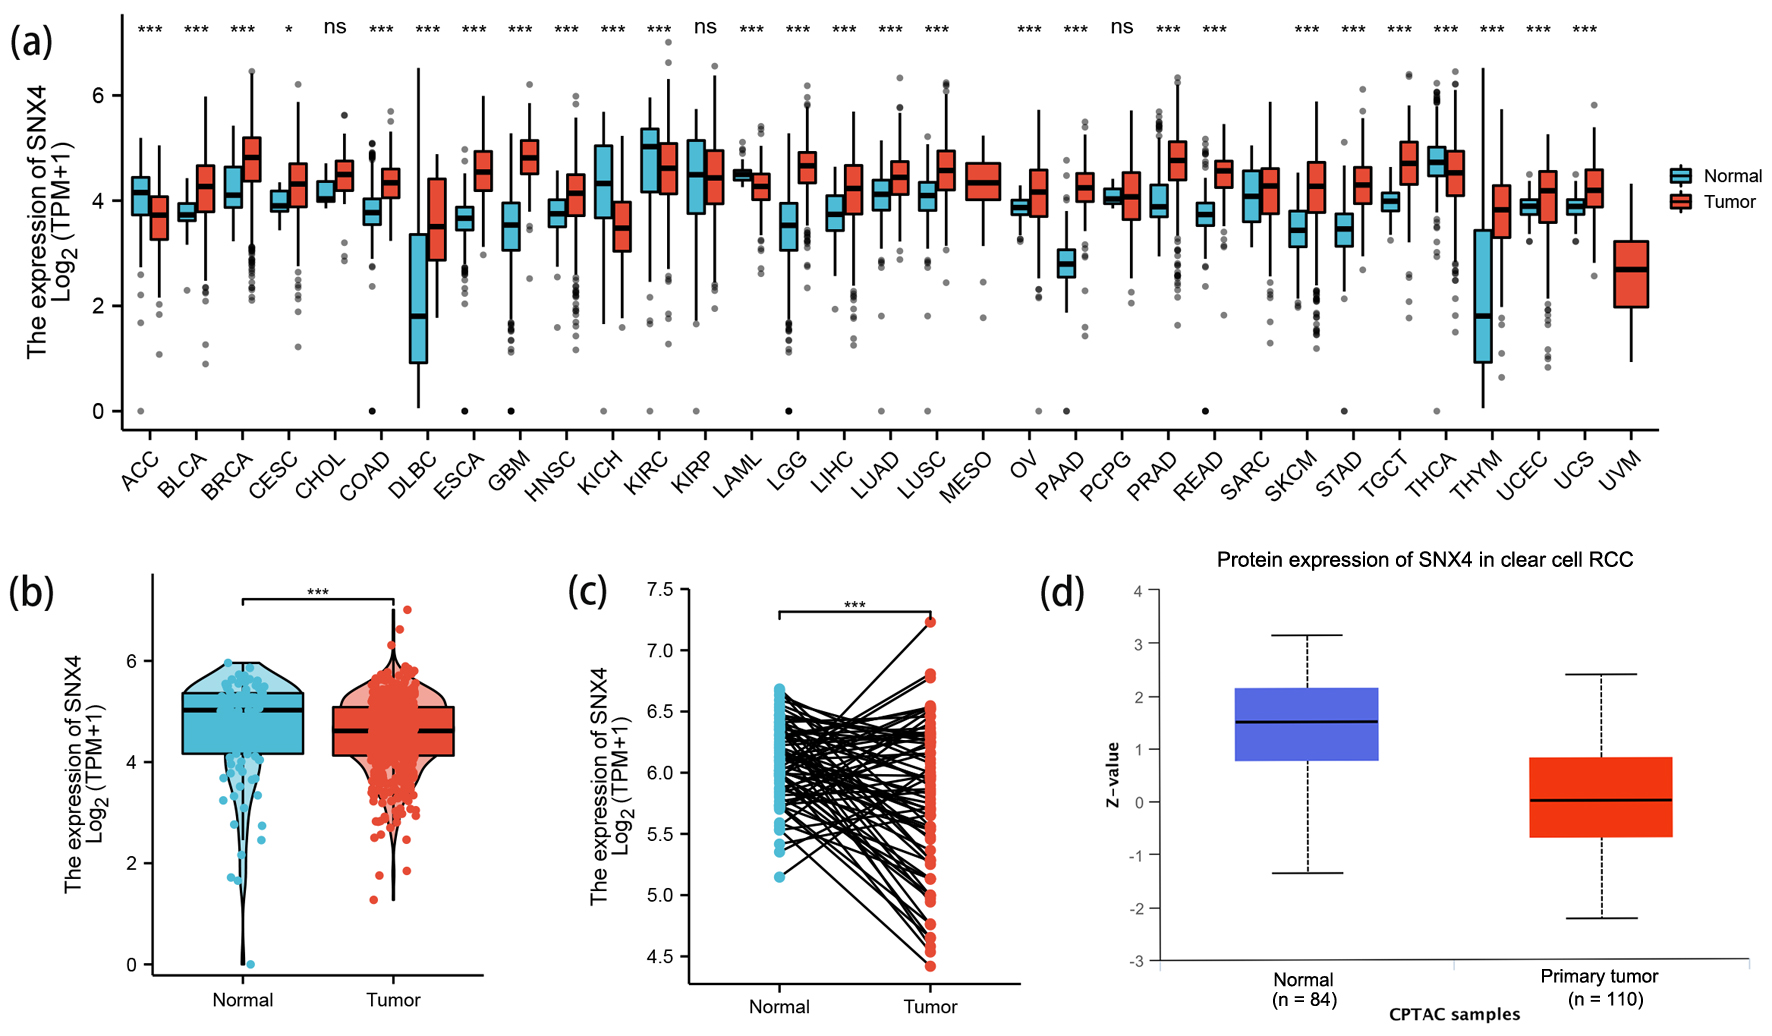
Figure 1. The expression levels of SNX4. (a) The expression levels of SNX4 in pan-cancer from TCGA database. (b, c) The expression levels of SNX4 in ccRCC and normal renal tissues from TCGA database. (d) The protein expression levels of SNX4 in ccRCC and normal renal tissues in CPTAC. *P < 0.05, **P < 0.01, ***P < 0.001. ns: no significance.
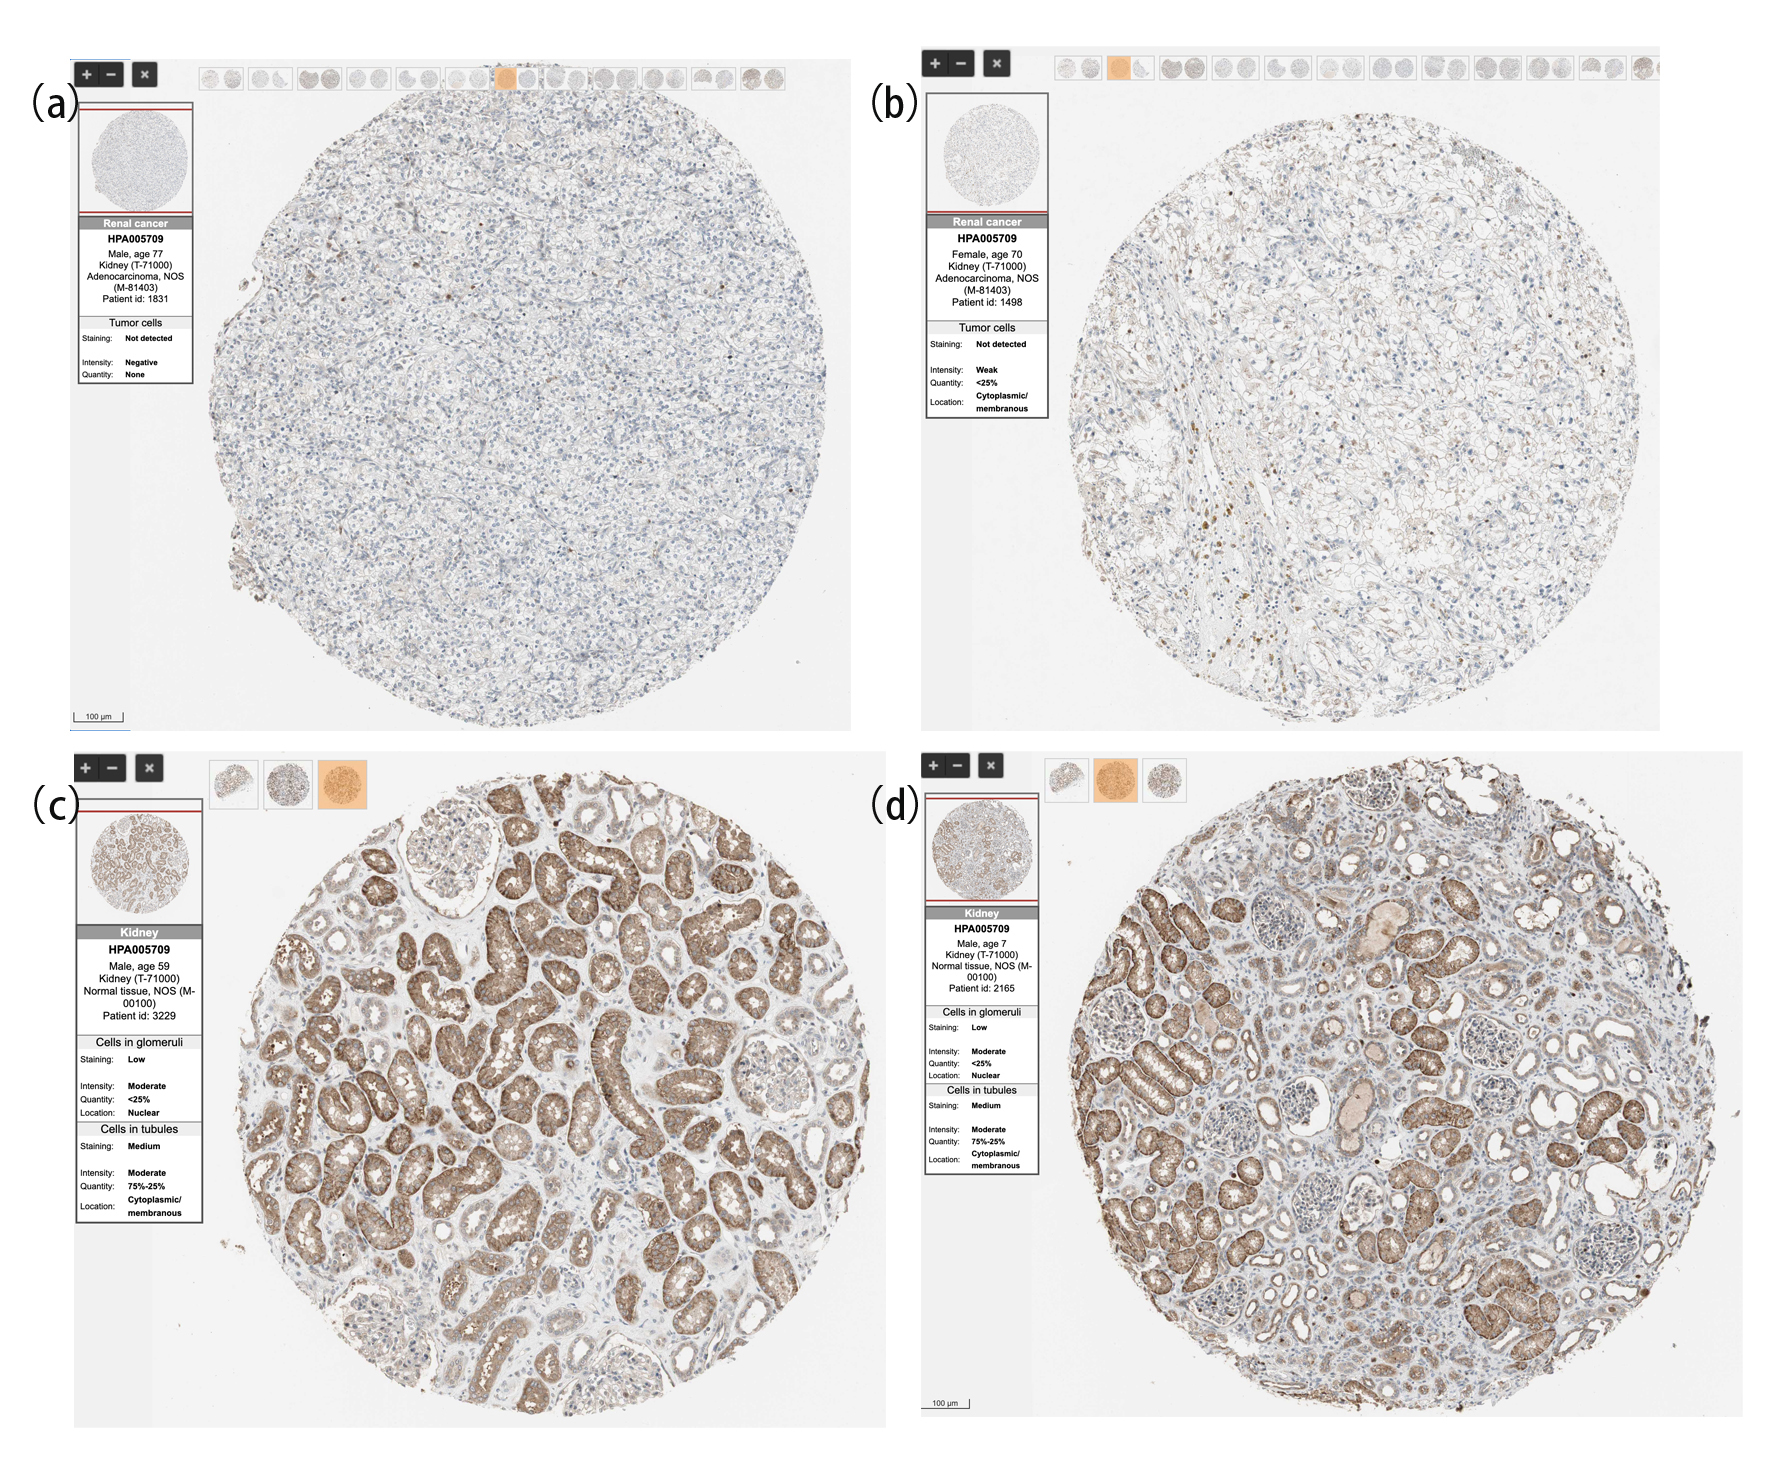
Figure 2. The protein expression of SNX4 in ccRCC and normal renal tissues based on the Human Protein Atlas. (a, b) The protein levels of SNX4 in normal kidney tissues from the Human Protein Atlas database. (c, d) The protein levels of SNX4 in kidney clear cell carcinoma based on the Human Protein Atlas.
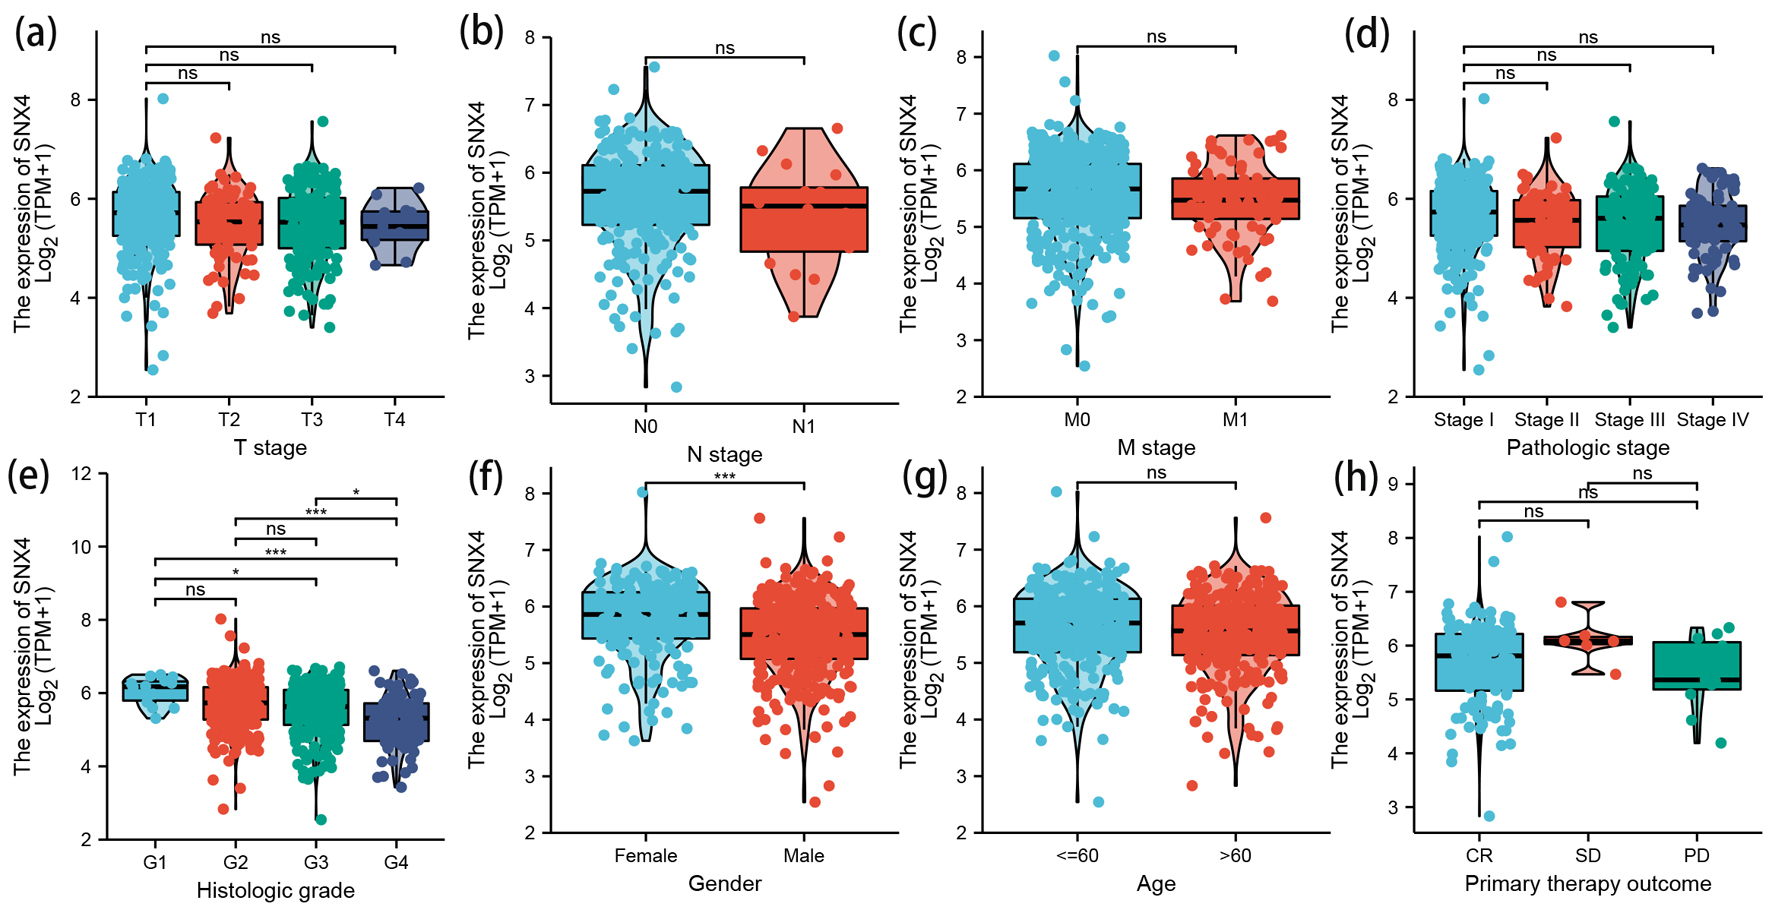
Figure 3. The correlation between SNX4 expression and clinical characteristics. Lower expression levels of SNX4 were observed in patients with high histologic grade (e) and male patients (f). No significant correlation was detected between the expression levels of SNX4 and T stage (a), N stage (b), M stage (c), pathologic stage (d), age (g), or primary therapy outcome (h). *P < 0.05, **P < 0.01, ***P < 0.001. ns: no significance.
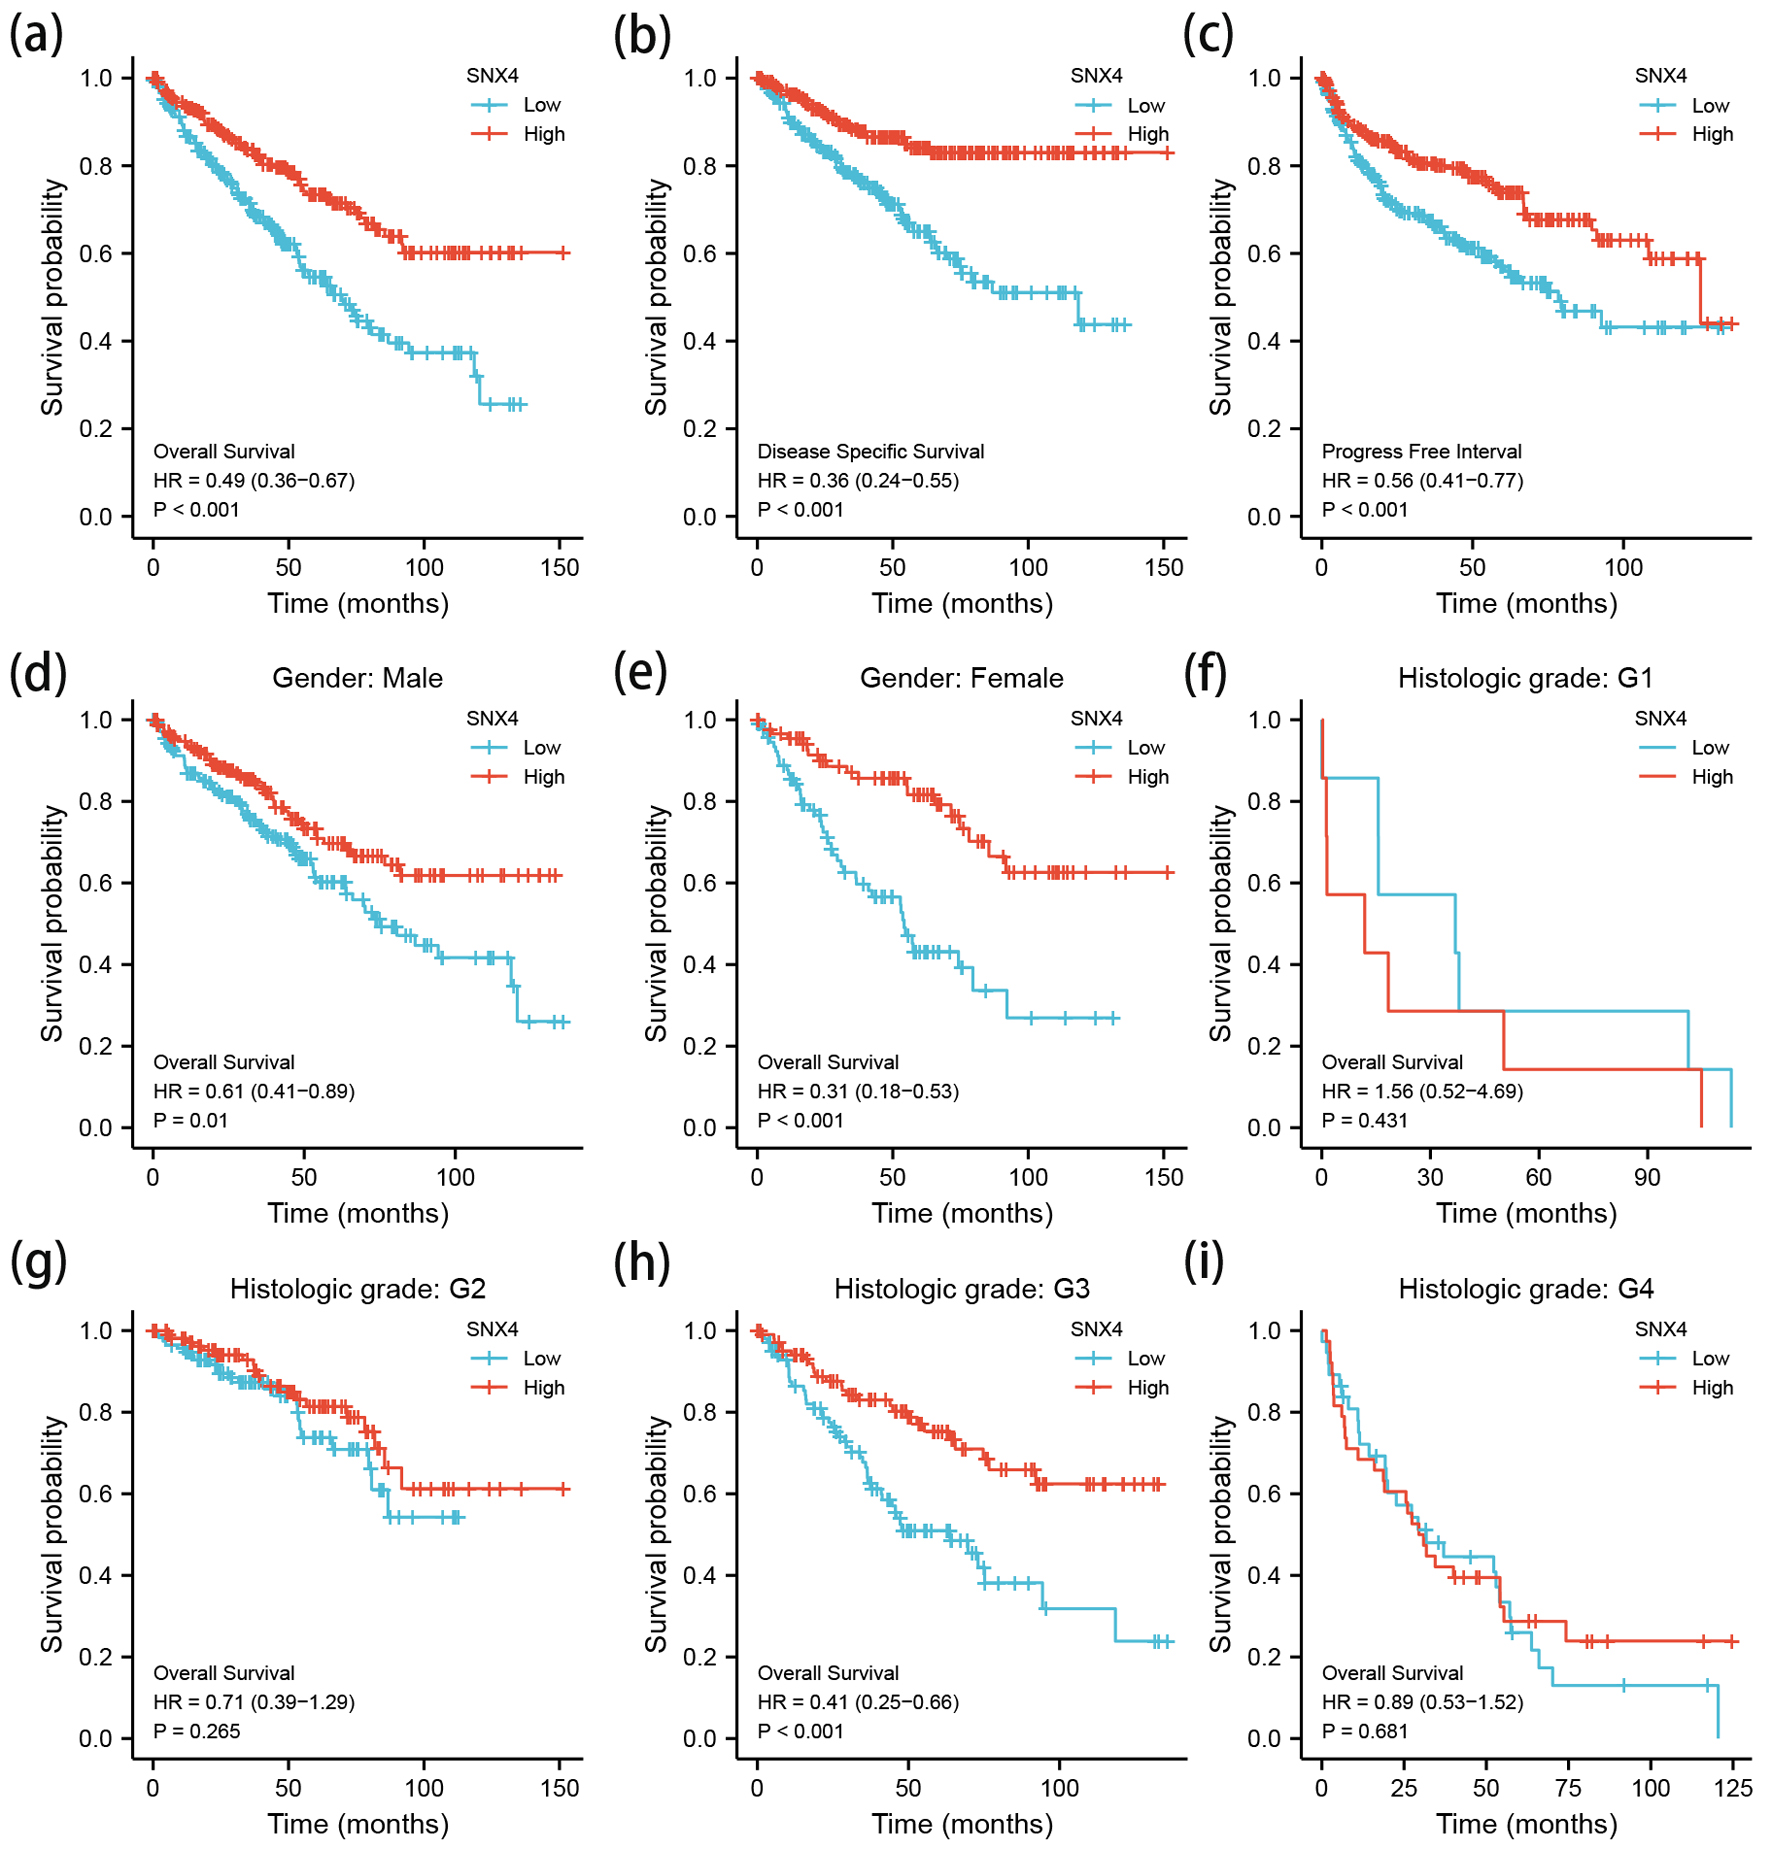
Figure 4. The Kaplan-Meier survival curve of ccRCC stratified according to SNX4 expression levels indicated that ccRCC patients with low SNX4 mRNA expression had a shorter OS, DSS and PFI than those with high level of SNX4 (a-c). Besides, a subgroup analysis was performed on different gender and histologic grade, respectively (d-i). OS: overall survival; DSS: disease-specific survival; PFI: progression-free interval.
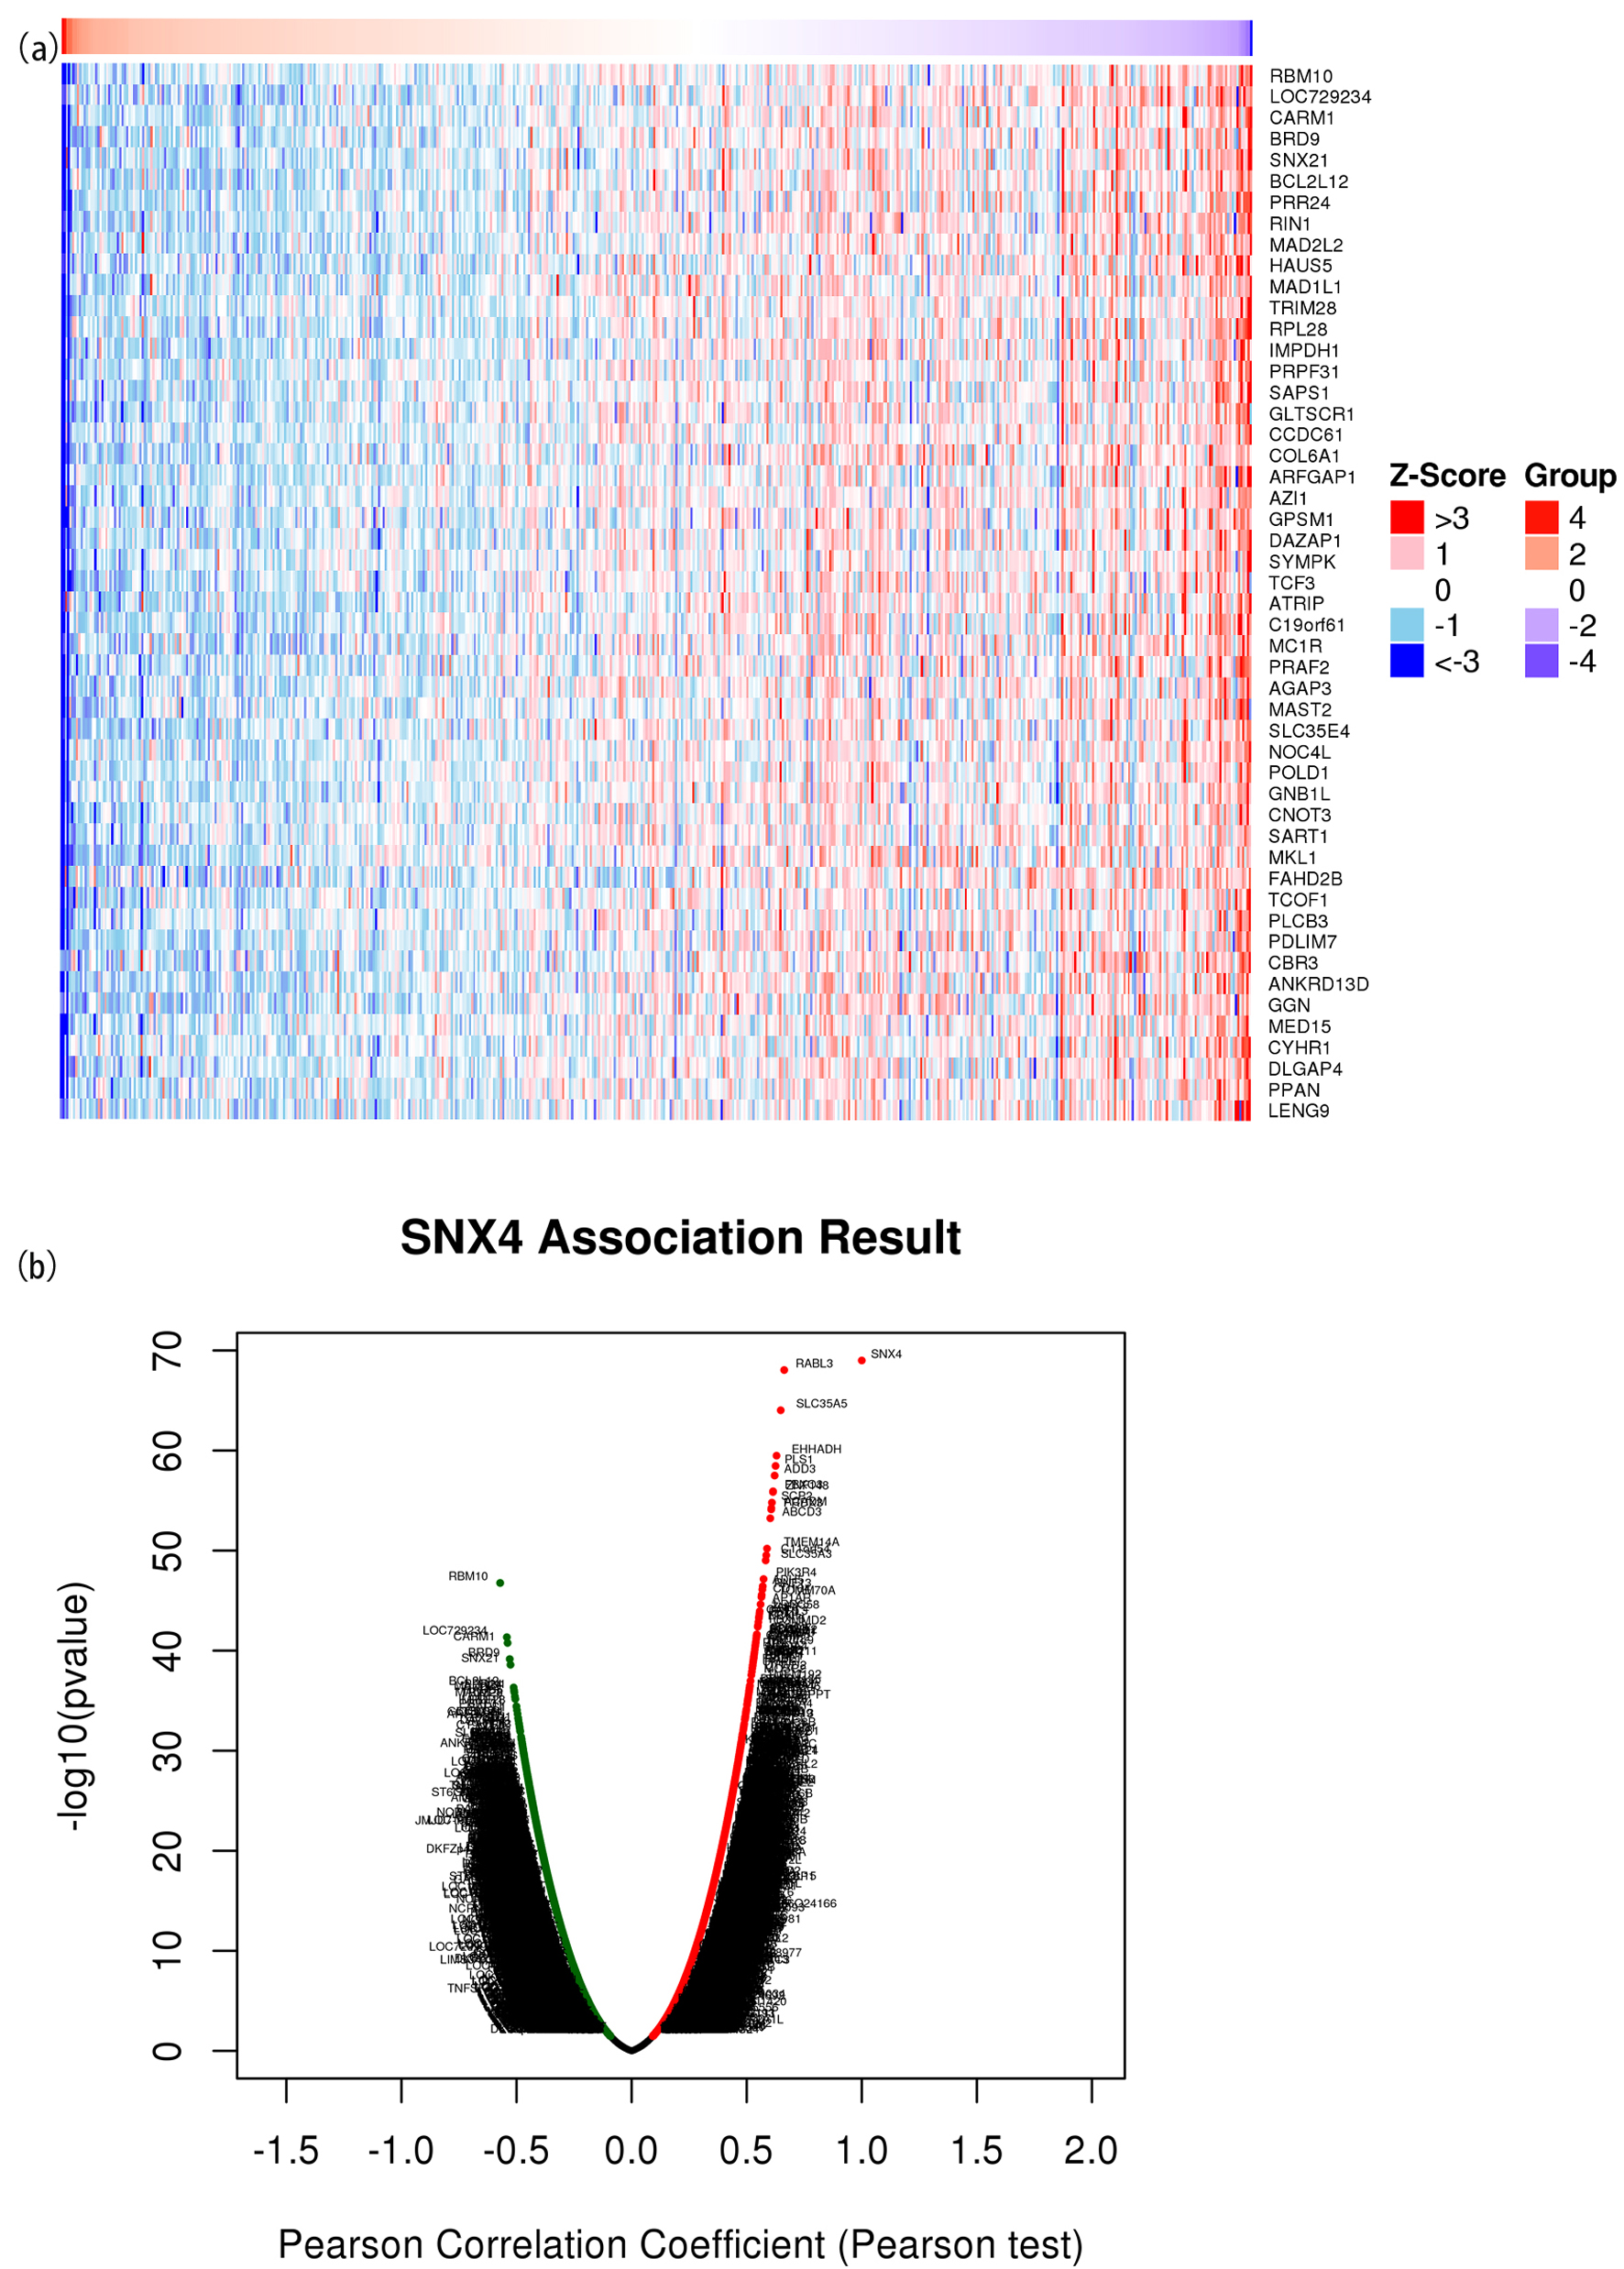
Figure 5. The correlated significant genes of SNX4 were visualized in the heatmap plot (a) and volcano plot (b). (a) Heatmap of the top 50 significant differentially expressed genes between the high and low SNX4 expression groups. Blue and red dots represent downregulated and upregulated genes, respectively. (b) Volcano plot of differentially expressed genes between the high and low SNX4 expression groups.
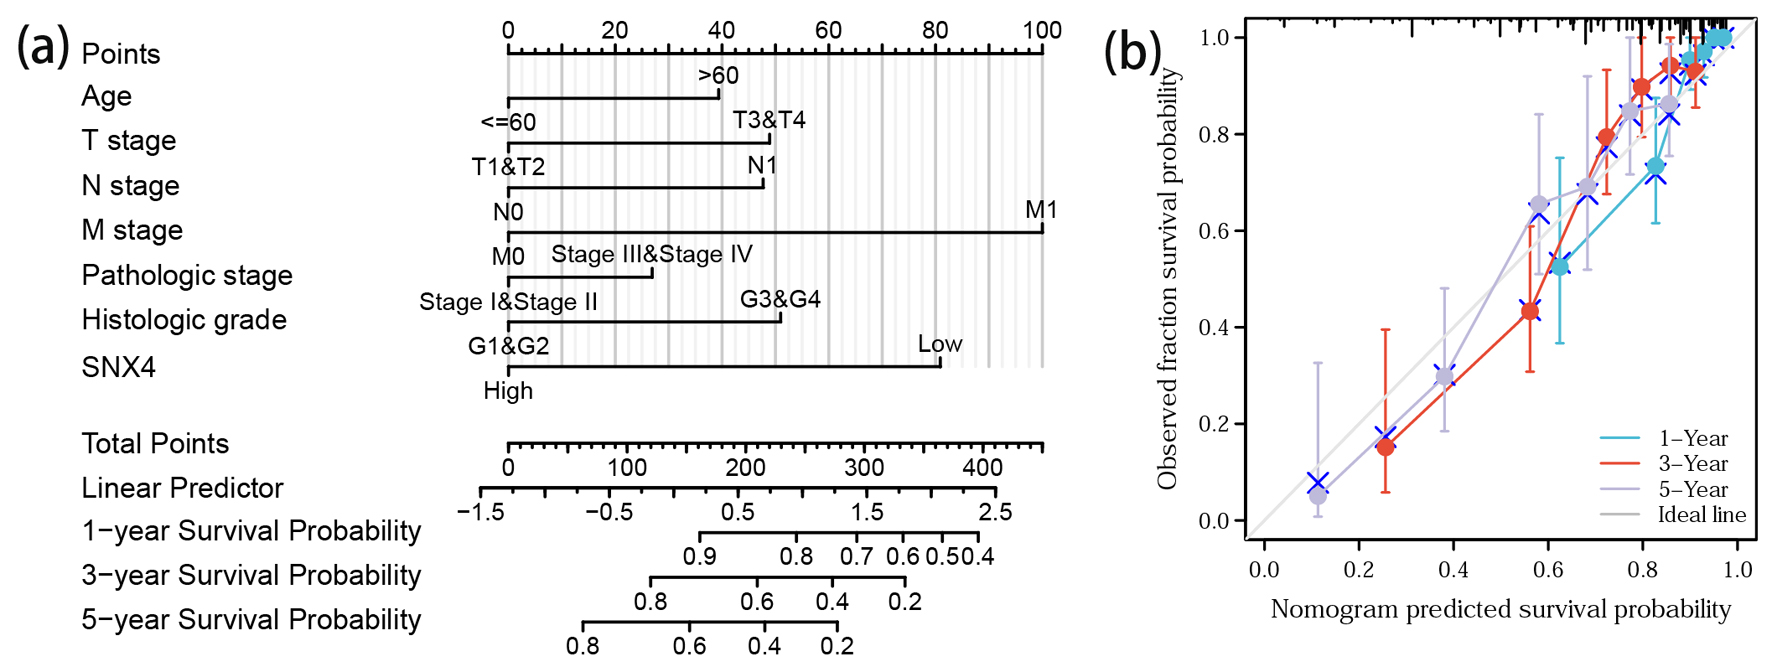
Figure 6. Prediction model nomogram and calibration curve. (a) Nomogram for predicting the probability of 1-, 3-, and 5-year OS for ccRCC patients. (b) Calibration plot of the nomogram for predicting the survival probability.
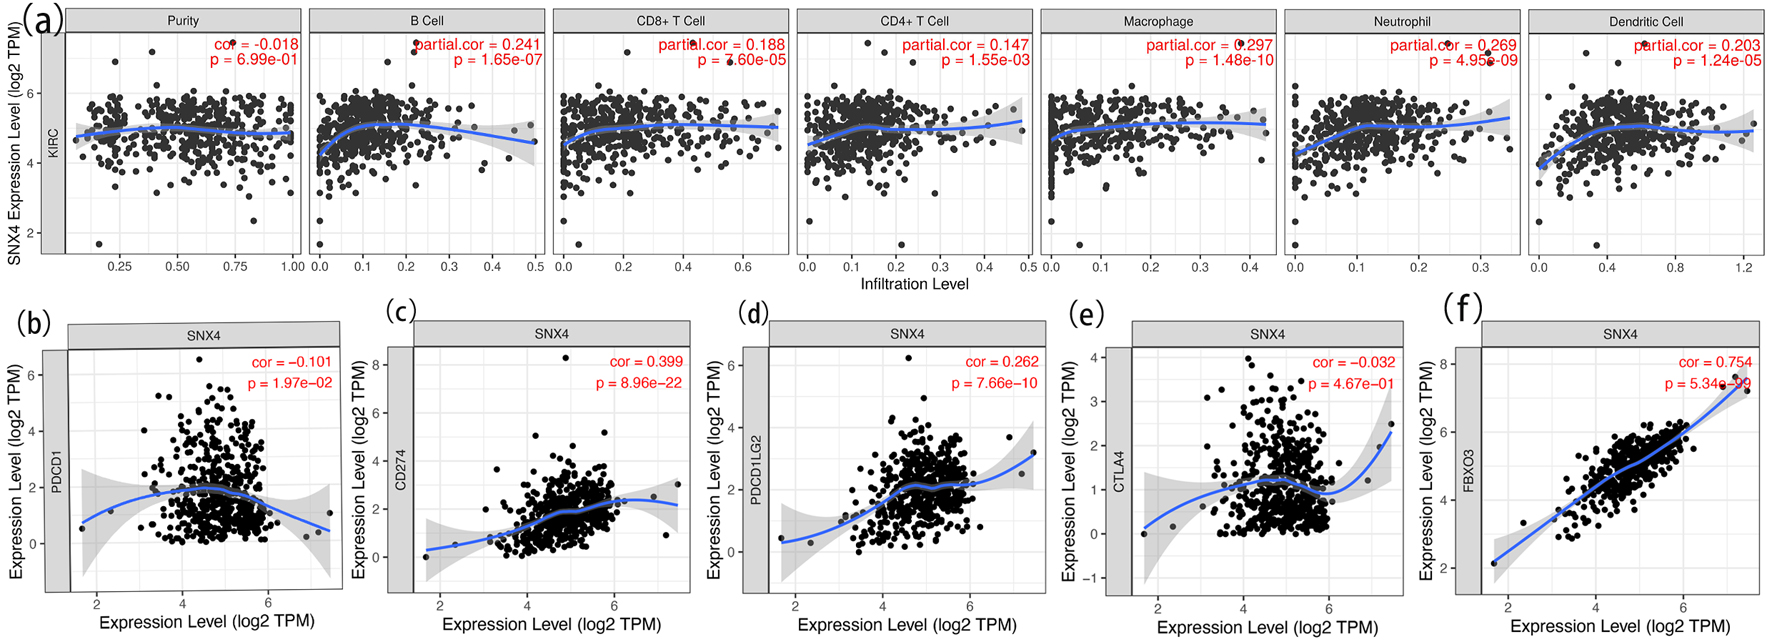
Figure 7. Correlation analysis of SNX4 expression and immune cell infiltration in ccRCC (a) and relationship between SNX4 and immune checkpoints of PD-1 (b), CD274 (c), PD-L1 (d), CTLA4 (e) and FBXO3 (f) in ccRCC.
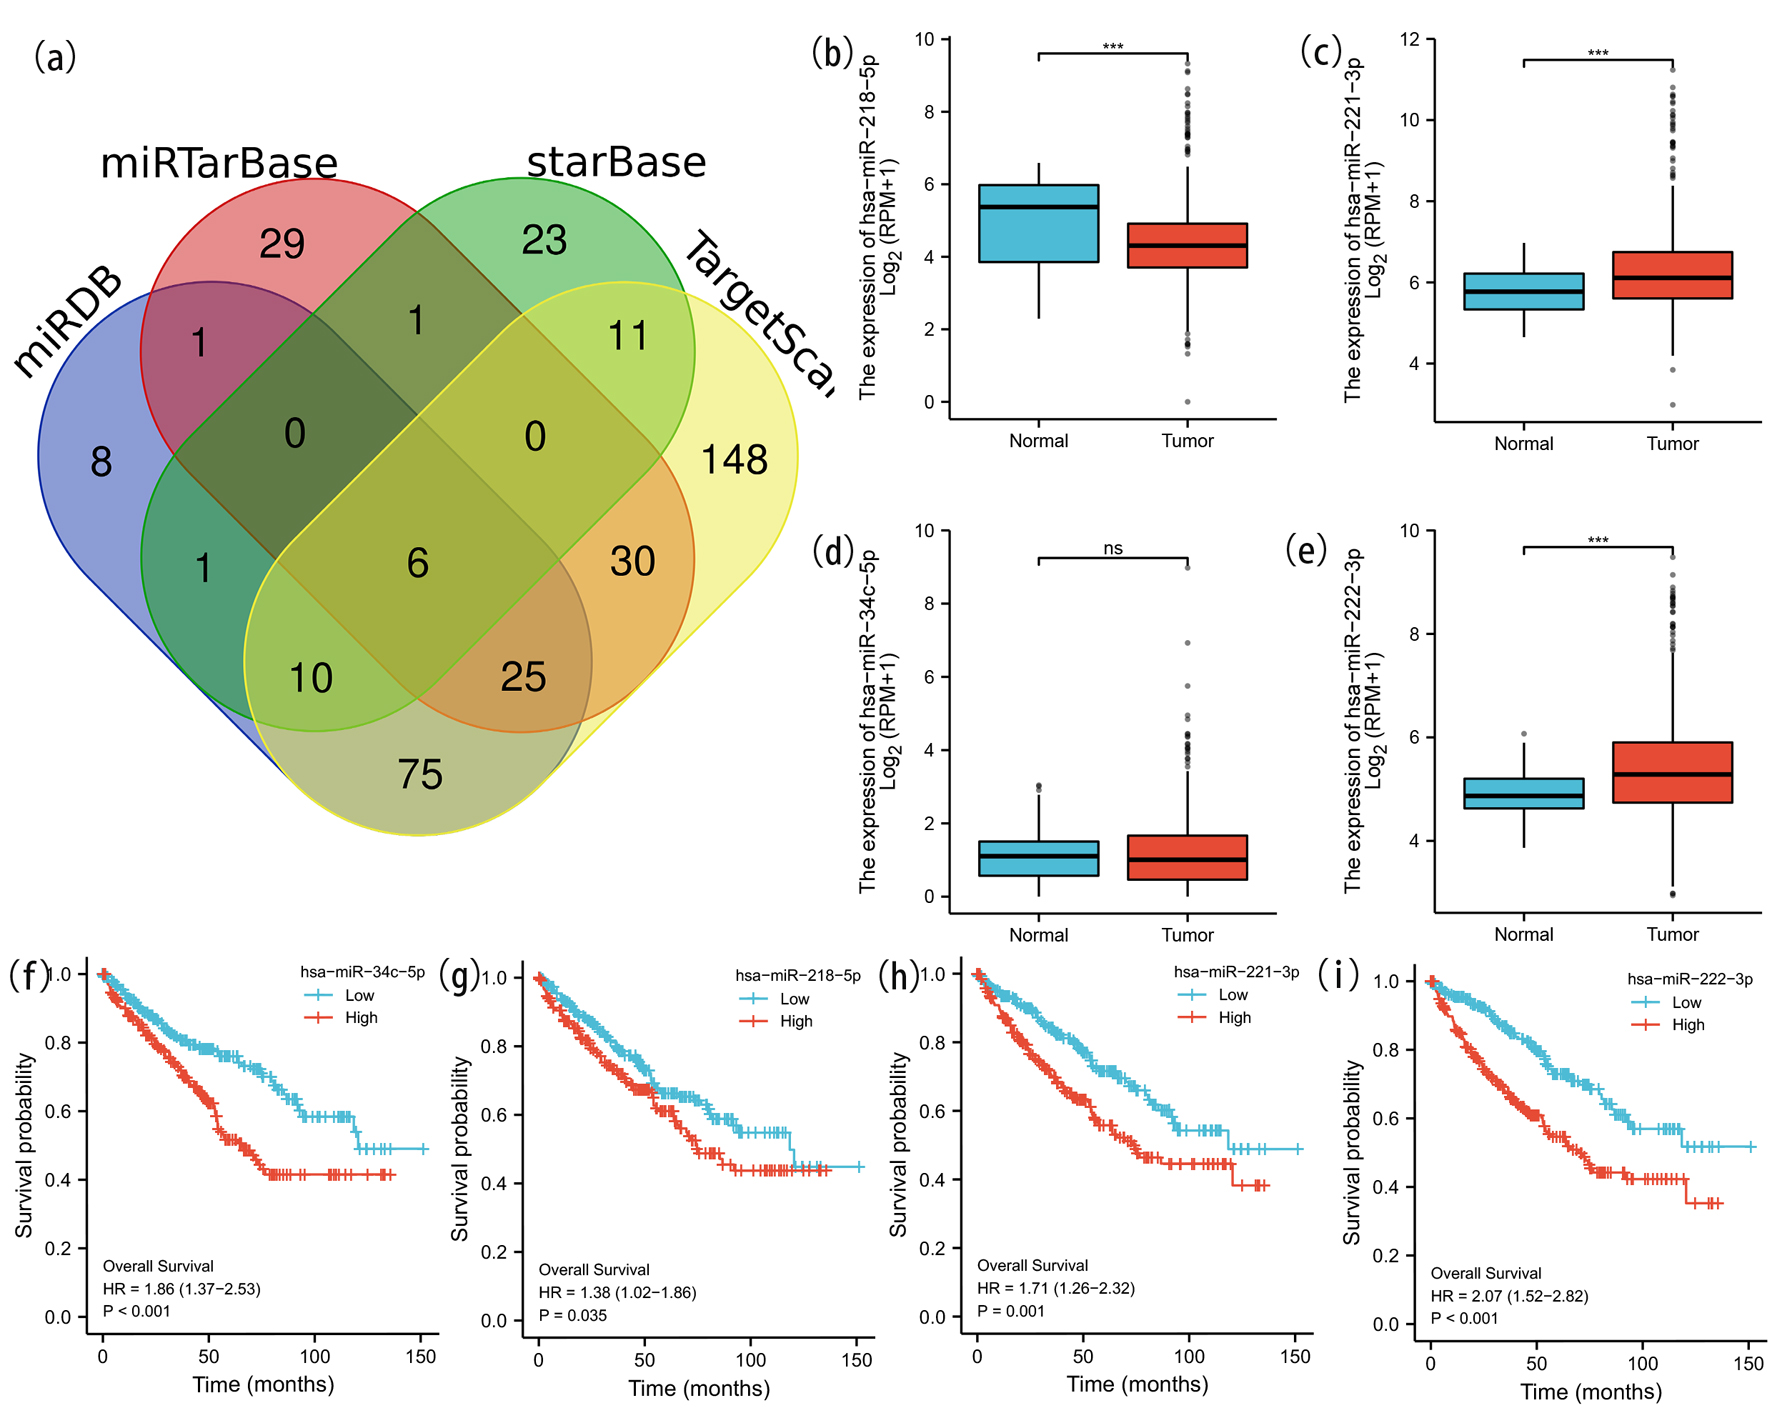
Figure 8. Prediction and analysis of ceRNA network. (a) Venn diagrams of underlying miRNA were drawn to predict the mutual target miRNA. The expression levels of miR-218-5p (b), miR-221-3p (c) and miR-222-3p (e) were significantly different in ccRCC and normal renal tissue. No significant difference of the expression level of miR-34c-5p (d) was detected in ccRCC and normal tissue. We further explored the expression and prognostic influence of the four miRNAs (f-i).
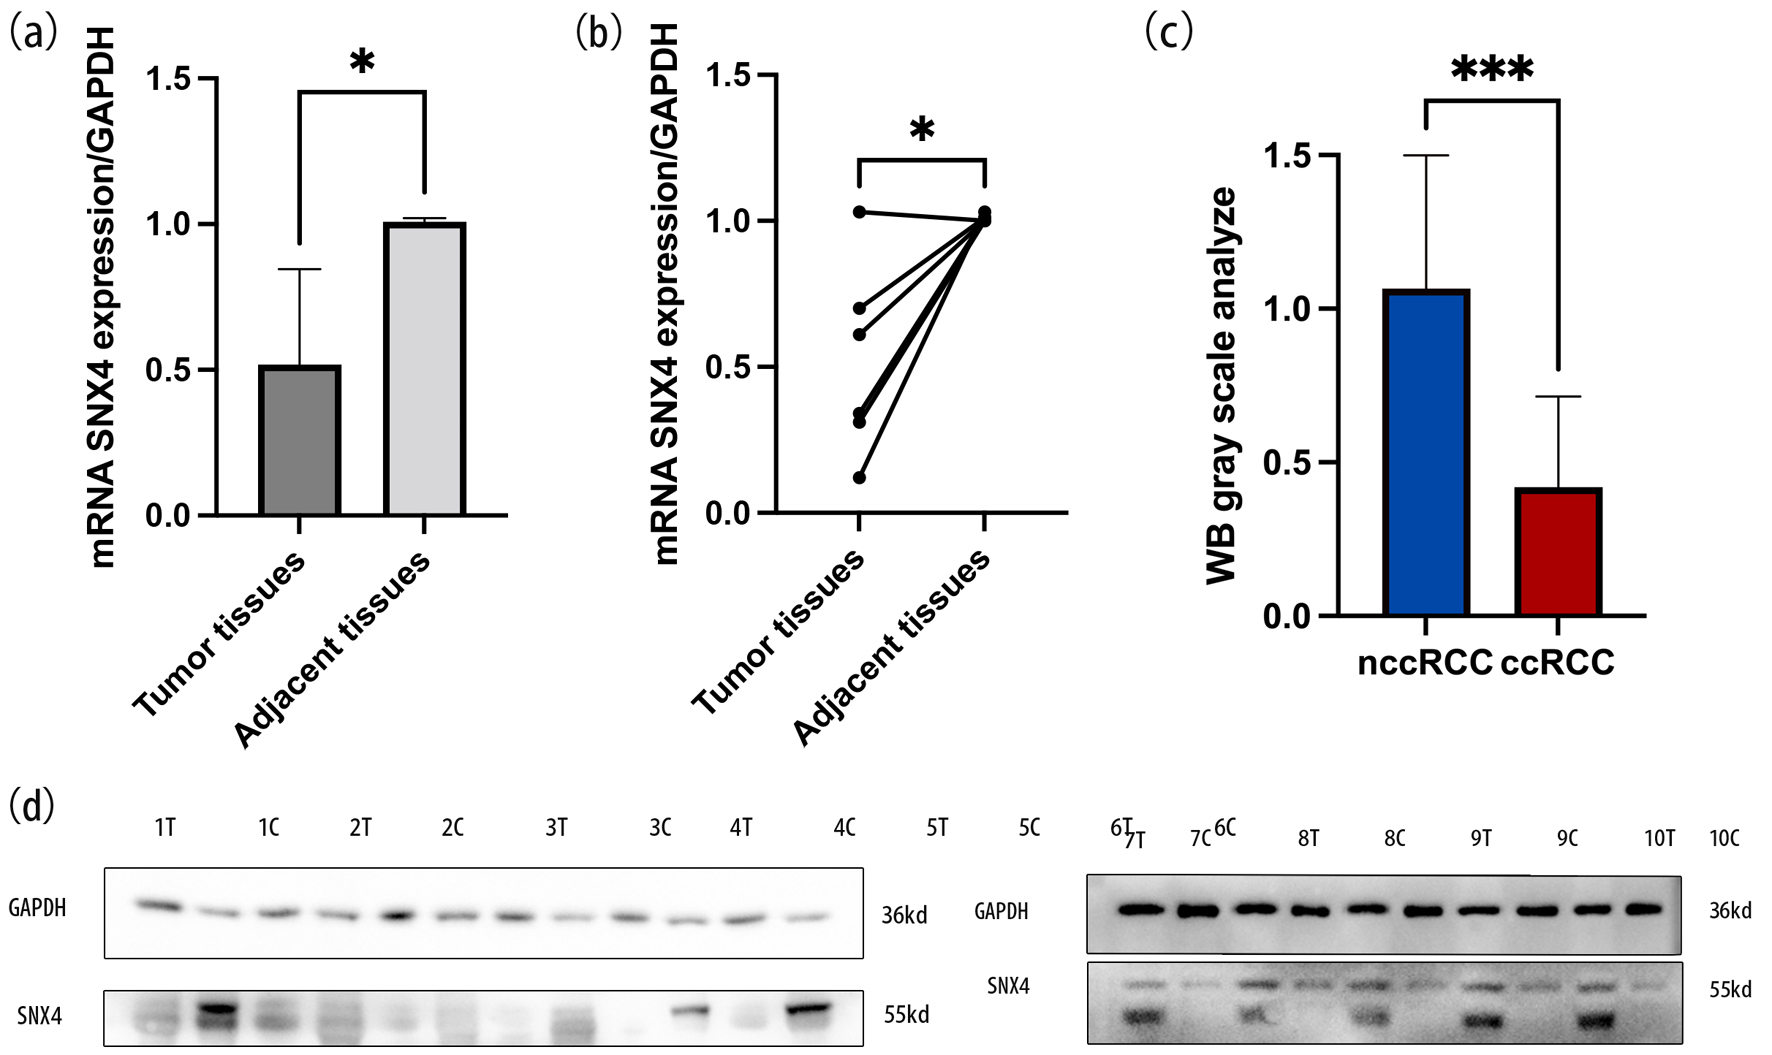
Figure 9. The mRNA expression levels of SNX4 in ccRCC tissues and normal tissues (a, b). WB gray scale analysis indicated the protein expression levels of SNX4 in ccRCC tissues and normal tissues (c). Western blot indicated that the protein expression levels of SNX4 were downregulated in ccRCC compared with normal renal tissue (d). *P < 0.05, ***P < 0.001.
Tables
Table 1. Univariable and Multivariable Cox Regression
| Characteristics | Total (N) | Univariate analysis | Multivariate analysis |
|---|
| Hazard ratio (95% CI) | P value | Hazard ratio (95% CI) | P value |
|---|
| CI: confidence interval; CR: complete response; PR: partial response; PD: progressive disease; SD: stable disease. |
| T stage | 539 | | | | |
| T1-T2 | 349 | Reference | | | |
| T3-T4 | 190 | 3.228 (2.382 - 4.374) | < 0.001 | 0.000 (0.000 - Inf) | 1.000 |
| N stage | 257 | | | | |
| N0 | 241 | Reference | | | |
| N1 | 16 | 3.453 (1.832 - 6.508) | < 0.001 | 0.000 (0.000 - Inf) | 1.000 |
| M stage | 506 | | | | |
| M0 | 428 | Reference | | | |
| M1 | 78 | 4.389 (3.212 - 5.999) | < 0.001 | 0.000 (0.000 - Inf) | 1.000 |
| Pathologic stage | 536 | | | | |
| Stage I-II | 331 | Reference | | | |
| Stage III-IV | 205 | 3.946 (2.872 - 5.423) | < 0.001 | 10,933,712,997.684 (0.000 - Inf) | 1.000 |
| Histologic grade | 531 | | | | |
| G1 and G2 | 249 | Reference | | | |
| G3 and G4 | 282 | 2.702 (1.918 - 3.807) | < 0.001 | 3.510 (0.182 - 67.520) | 0.405 |
| Gender | 539 | | | | |
| Female | 186 | Reference | | | |
| Male | 353 | 0.930 (0.682 - 1.268) | 0.648 | | |
| Age | 539 | | | | |
| ≤ 60 | 269 | Reference | | | |
| > 60 | 270 | 1.765 (1.298 - 2.398) | < 0.001 | 0.489 (0.028 - 8.506) | 0.624 |
| Race | 532 | | | | |
| White | 467 | Reference | | | |
| Asian and Black or African American | 65 | 0.818 (0.454 - 1.474) | 0.505 | | |
| Laterality | 538 | | | | |
| Left | 252 | Reference | | | |
| Right | 286 | 0.706 (0.523 - 0.952) | 0.023 | 0.000 (0.000 - Inf) | 0.999 |
| Primary therapy outcome | 147 | | | | |
| CR and PR | 130 | Reference | | | |
| PD and SD | 17 | 5.116 (1.594 - 16.425) | 0.006 | 1.694 (0.000 - Inf) | 1.000 |
| SNX4 | 539 | | | | |
| Low | 269 | Reference | | | |
| High | 270 | 0.493 (0.362 - 0.672) | < 0.001 | 0.927 (0.049 - 17.574) | 0.959 |
Table 2. Association Between SNX4 and Corresponding Biomarkers of Immune Cells
| Immune cell | Biomarker | R value | P value |
|---|
| SNX4: sorting nexin 4. |
| B cell | CD19 | -0.077 | 0.08 |
| CD79A | -0.073 | 0.096 |
| CD8+ T cell | CD8A | 0.075 | 0.088 |
| CD8B | 0.048 | 0.28 |
| CD4+ T cell | CD4 | 0.27 | 4.4 × 10⁻¹⁰ |
| M1 macrophage | NOS2 | 0.38 | 3.7 × 10⁻¹⁹ |
| IRF5 | 0.23 | 7.9 × 10⁻⁸ |
| PTGS2 | 0.083 | 0.058 |
| M2 macrophage | CD163 | 0.17 | 0.00013 |
| VSIG4 | 0.21 | 0.0000011 |
| MS4A4A | 0.29 | 9.8 × 10⁻¹² |
| Neutrophil | CEACAM8 | 0.1 | 0.022 |
| ITGAM | 0.34 | 1.3 × 10⁻¹⁵ |
| CCR7 | 0.094 | 0.31 |
| Dendritic cell | HLA-DPB1 | 0.25 | 3.9 × 10⁻⁹ |
| HLA-DQB1 | 0.039 | 0.37 |
| HLA-DRA | 0.31 | 1.8 × 10⁻¹³ |
| HLA-DPA1 | 0.35 | 4.3 × 10⁻¹⁶ |
| CD1C | 0.33 | 8.7 × 10⁻¹⁵ |
| NRP1 | 0.57 | 1.1 × 10-45 |
| ITGAX | 0.057 | 0.2 |
Table 3. Prediction and Analysis of ceRNA Network
| lncRNA | miRNA | R-value | P-value |
|---|
| ceRNA: competing endogenous RNA; lncRNAs: long noncoding RNAs. |
| AC091563.1 | hsa-miR-221-3p | -0.156 | 0.00038 |
| DHRS4-AS1 | hsa-miR-221-3p | -0.165 | 0.000167 |
| PAXIP1-AS2 | hsa-miR-221-3p | -0.141 | 0.00135 |
| DHRS4-AS1 | hsa-miR-222-3p | -0.126 | 0.00399 |
| mRNA | | |
| AC091563.1 | SNX4 | 0.123 | 0.00432 |
| DHRS4-AS1 | SNX4 | 0.439 | 1.13 × 10⁻²⁶ |
| PAXIP1-AS2 | SNX4 | 0.357 | 1.74 × 10⁻¹⁷ |