Figures
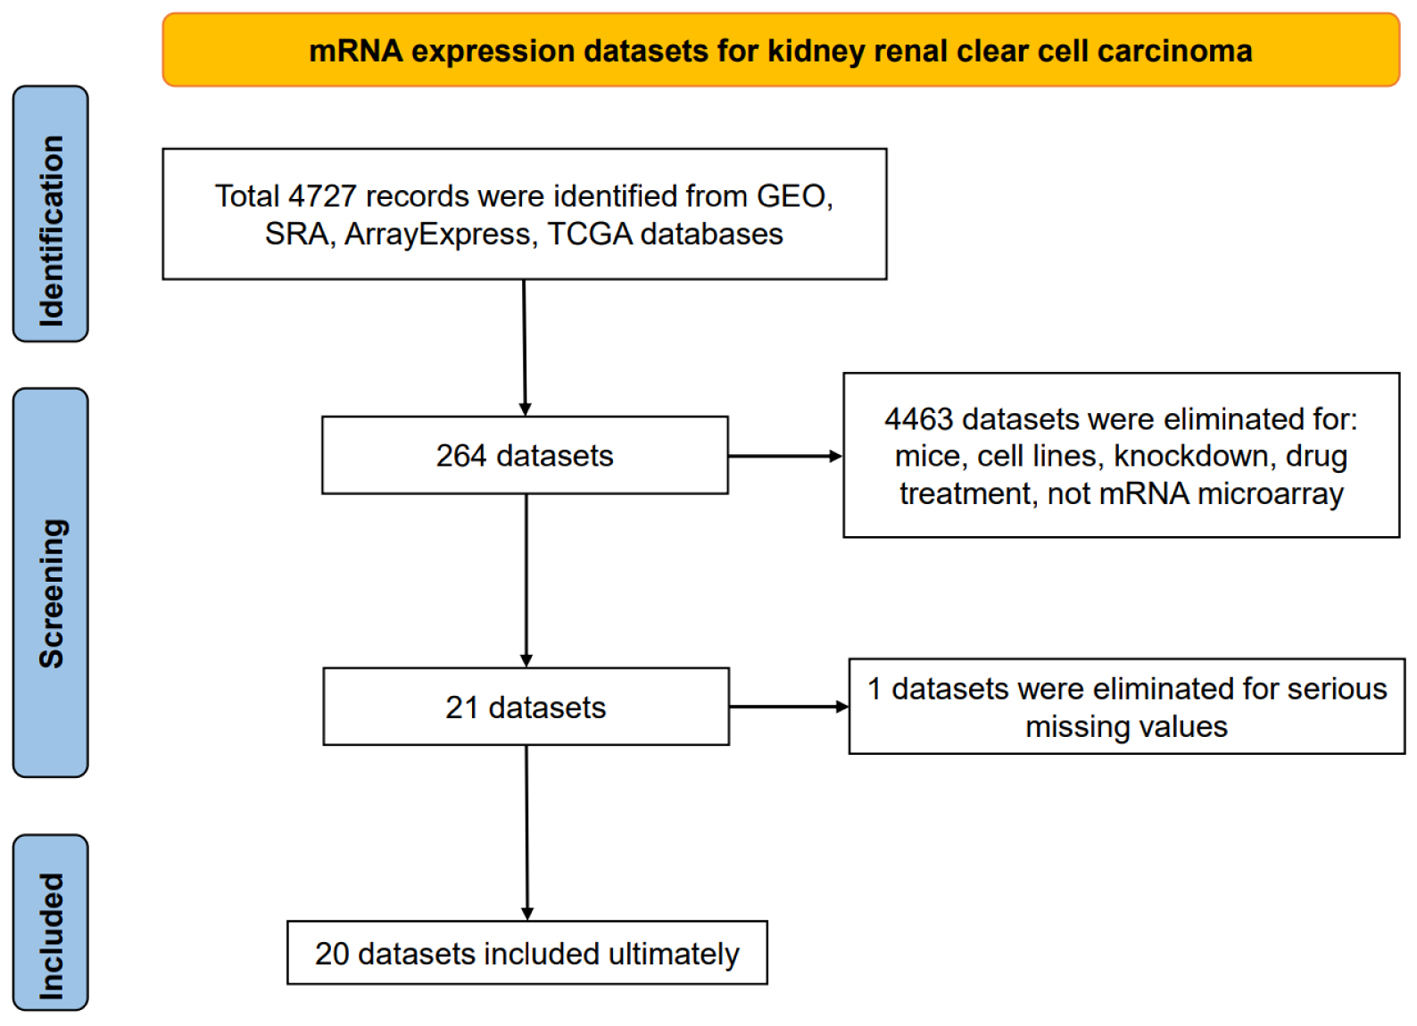
Figure 1. Flow chart of mRNA expression datasets for kidney renal clear cell carcinoma tissues.
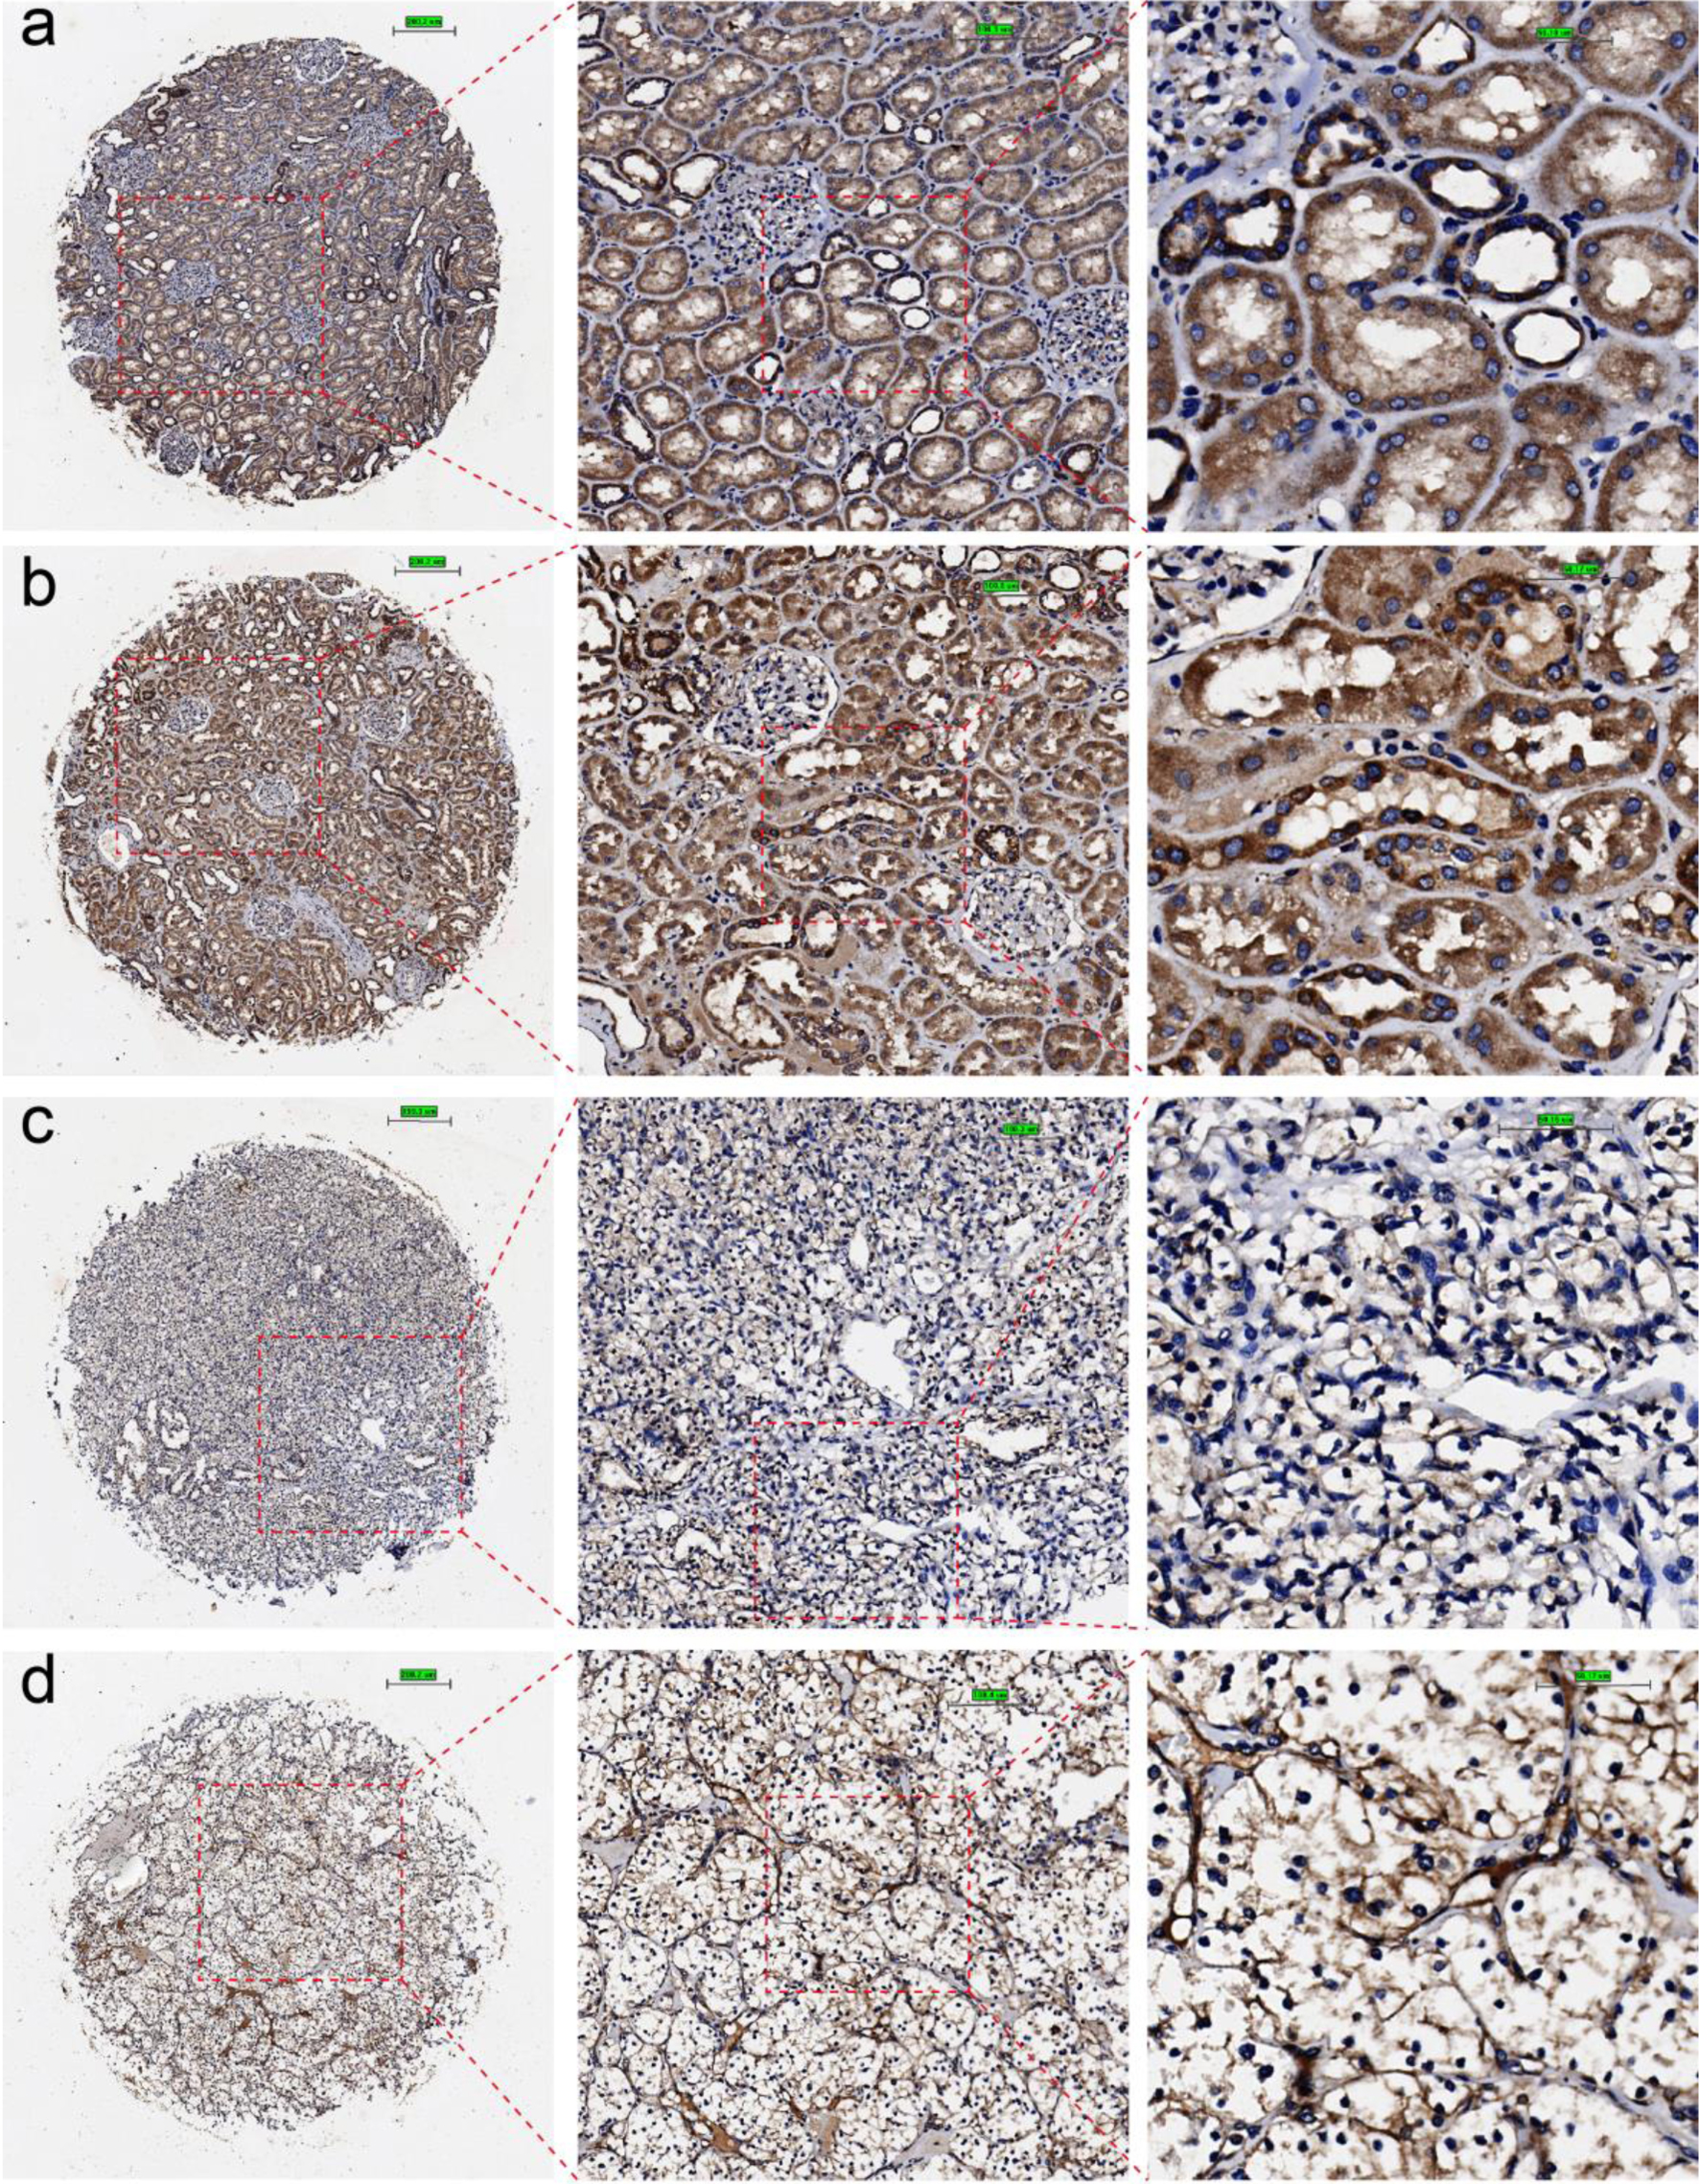
Figure 2. Immunohistochemical staining of claudin 8 (CLDN8) protein in non-KIRC and KIRC tissues. (a, b) Non-KIRC tissues. (c, d) KIRC tissues. KIRC: kidney renal clear cell carcinoma.
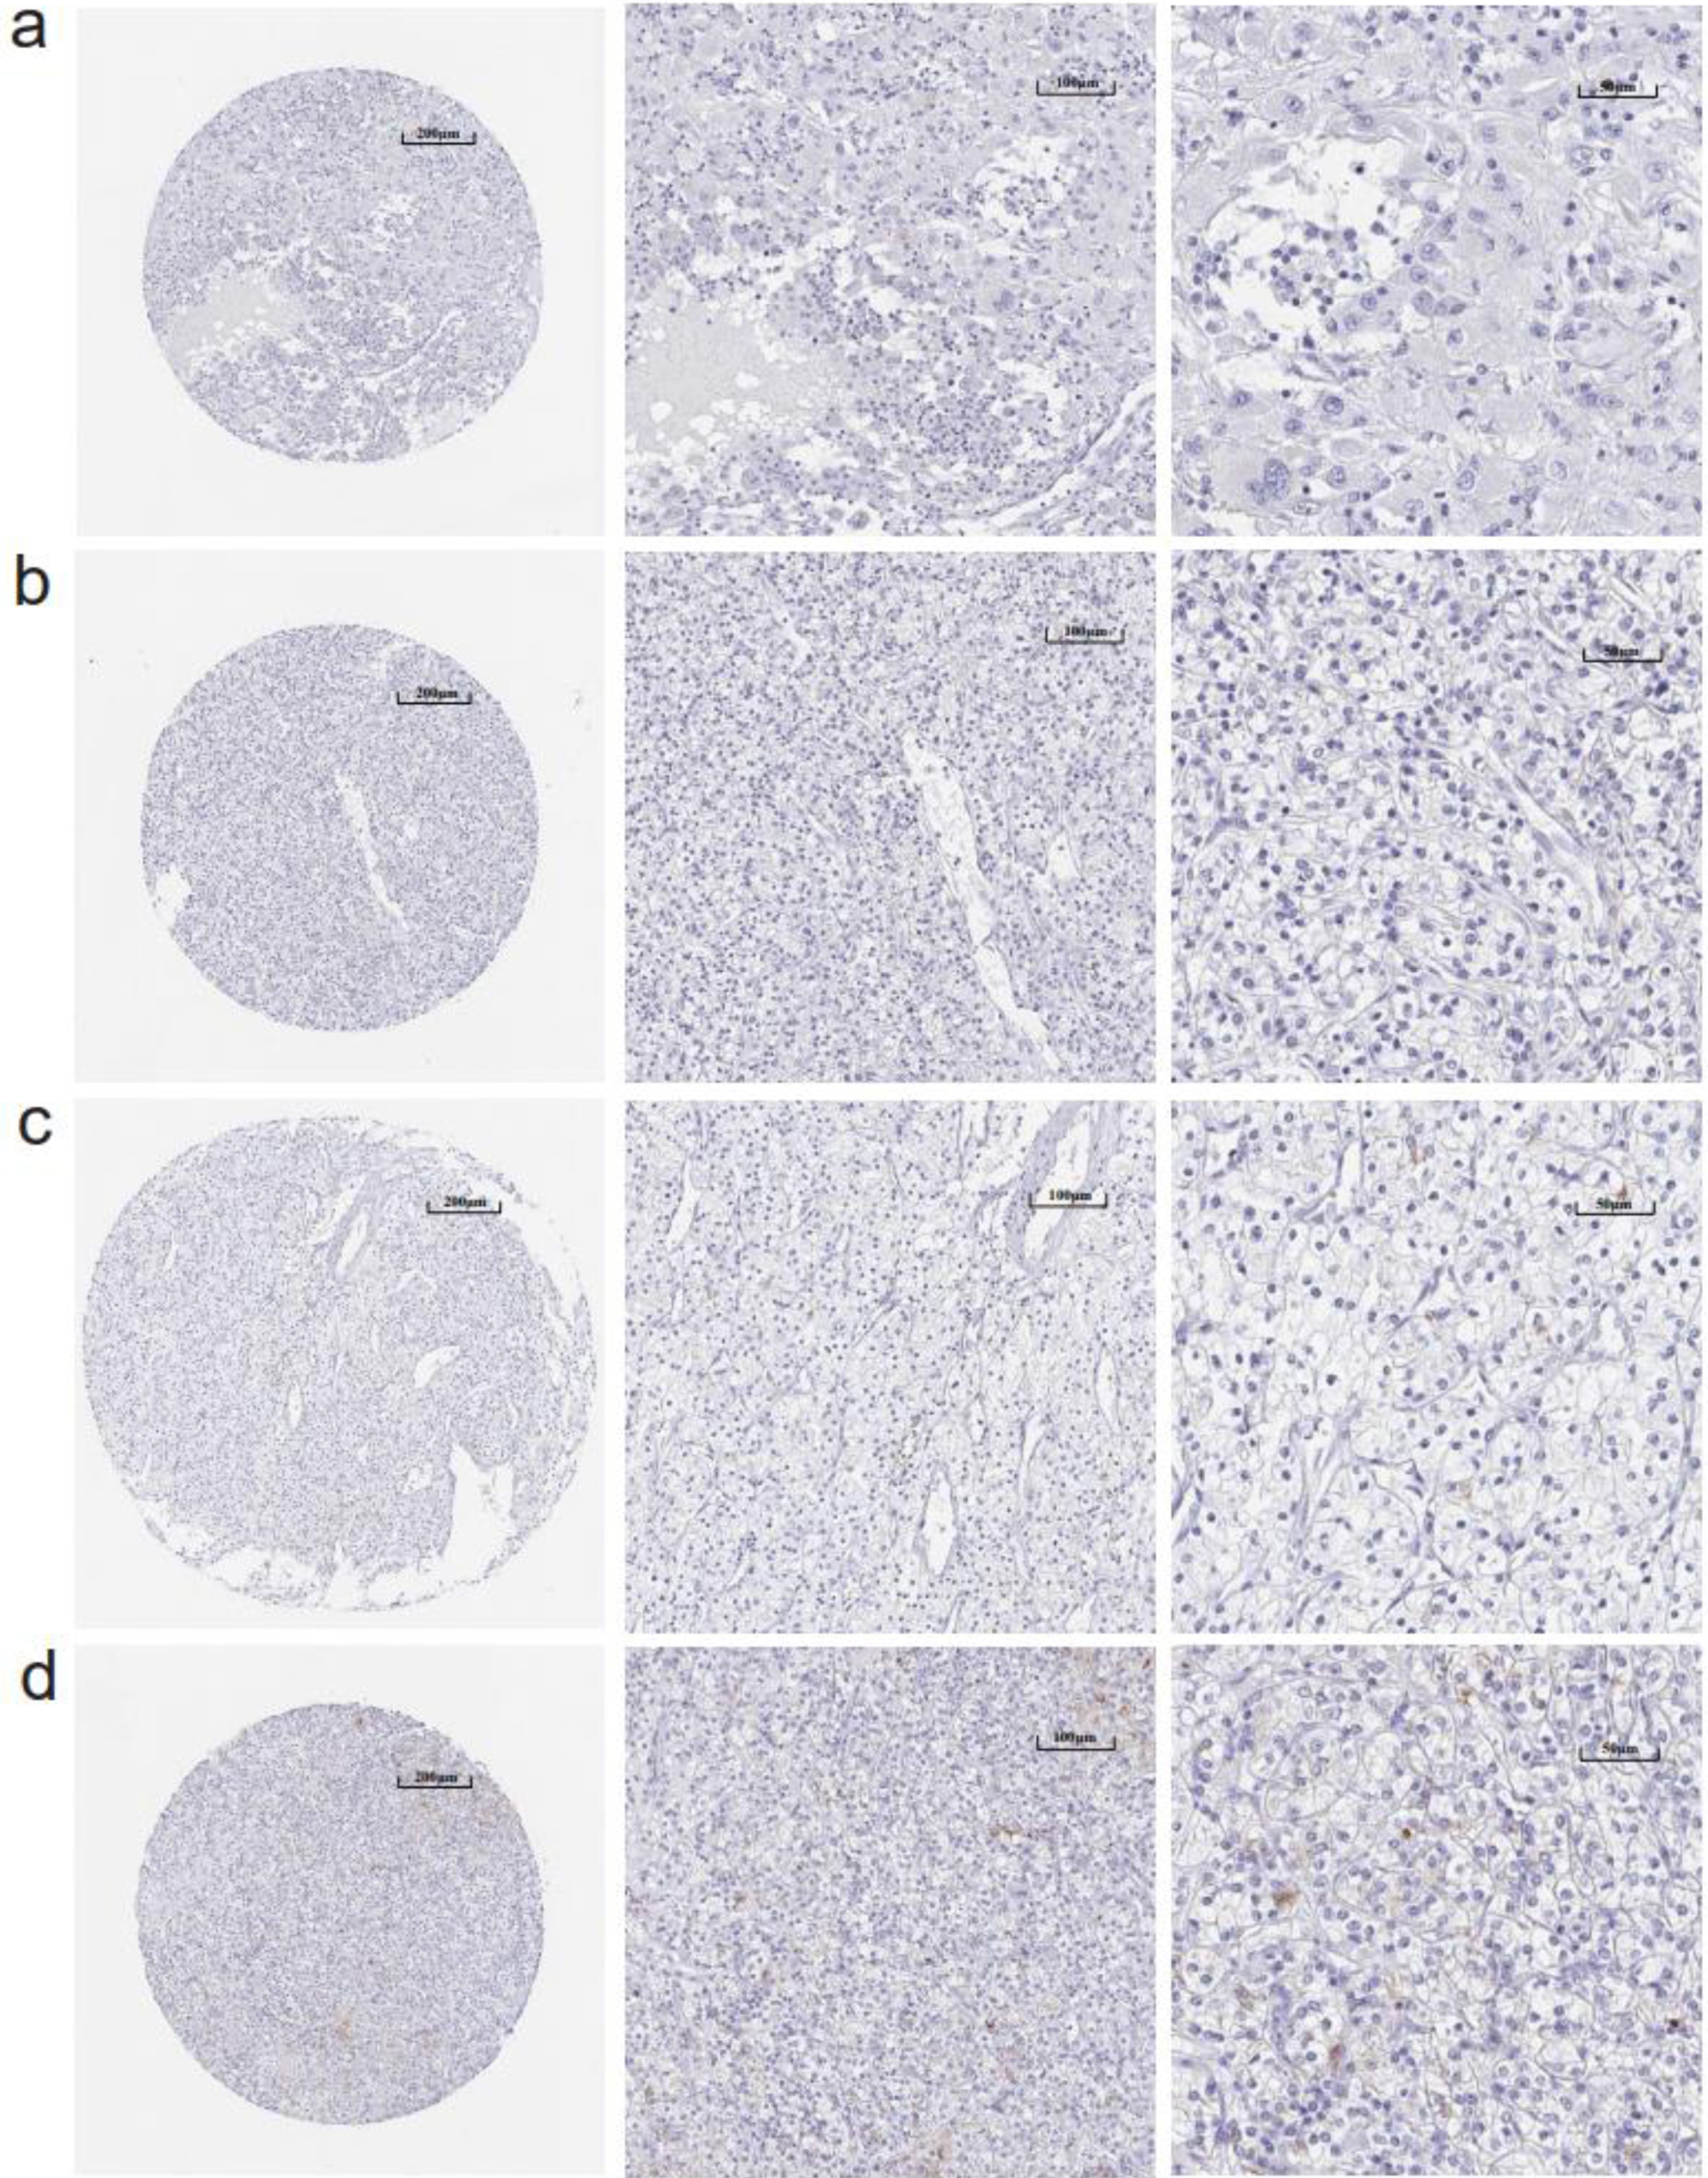
Figure 3. (a-d) Immunohistochemistry images of claudin 8 (CLDN8) protein in kidney renal clear cell carcinoma tissues derived from the human protein atlas (HPA) database.
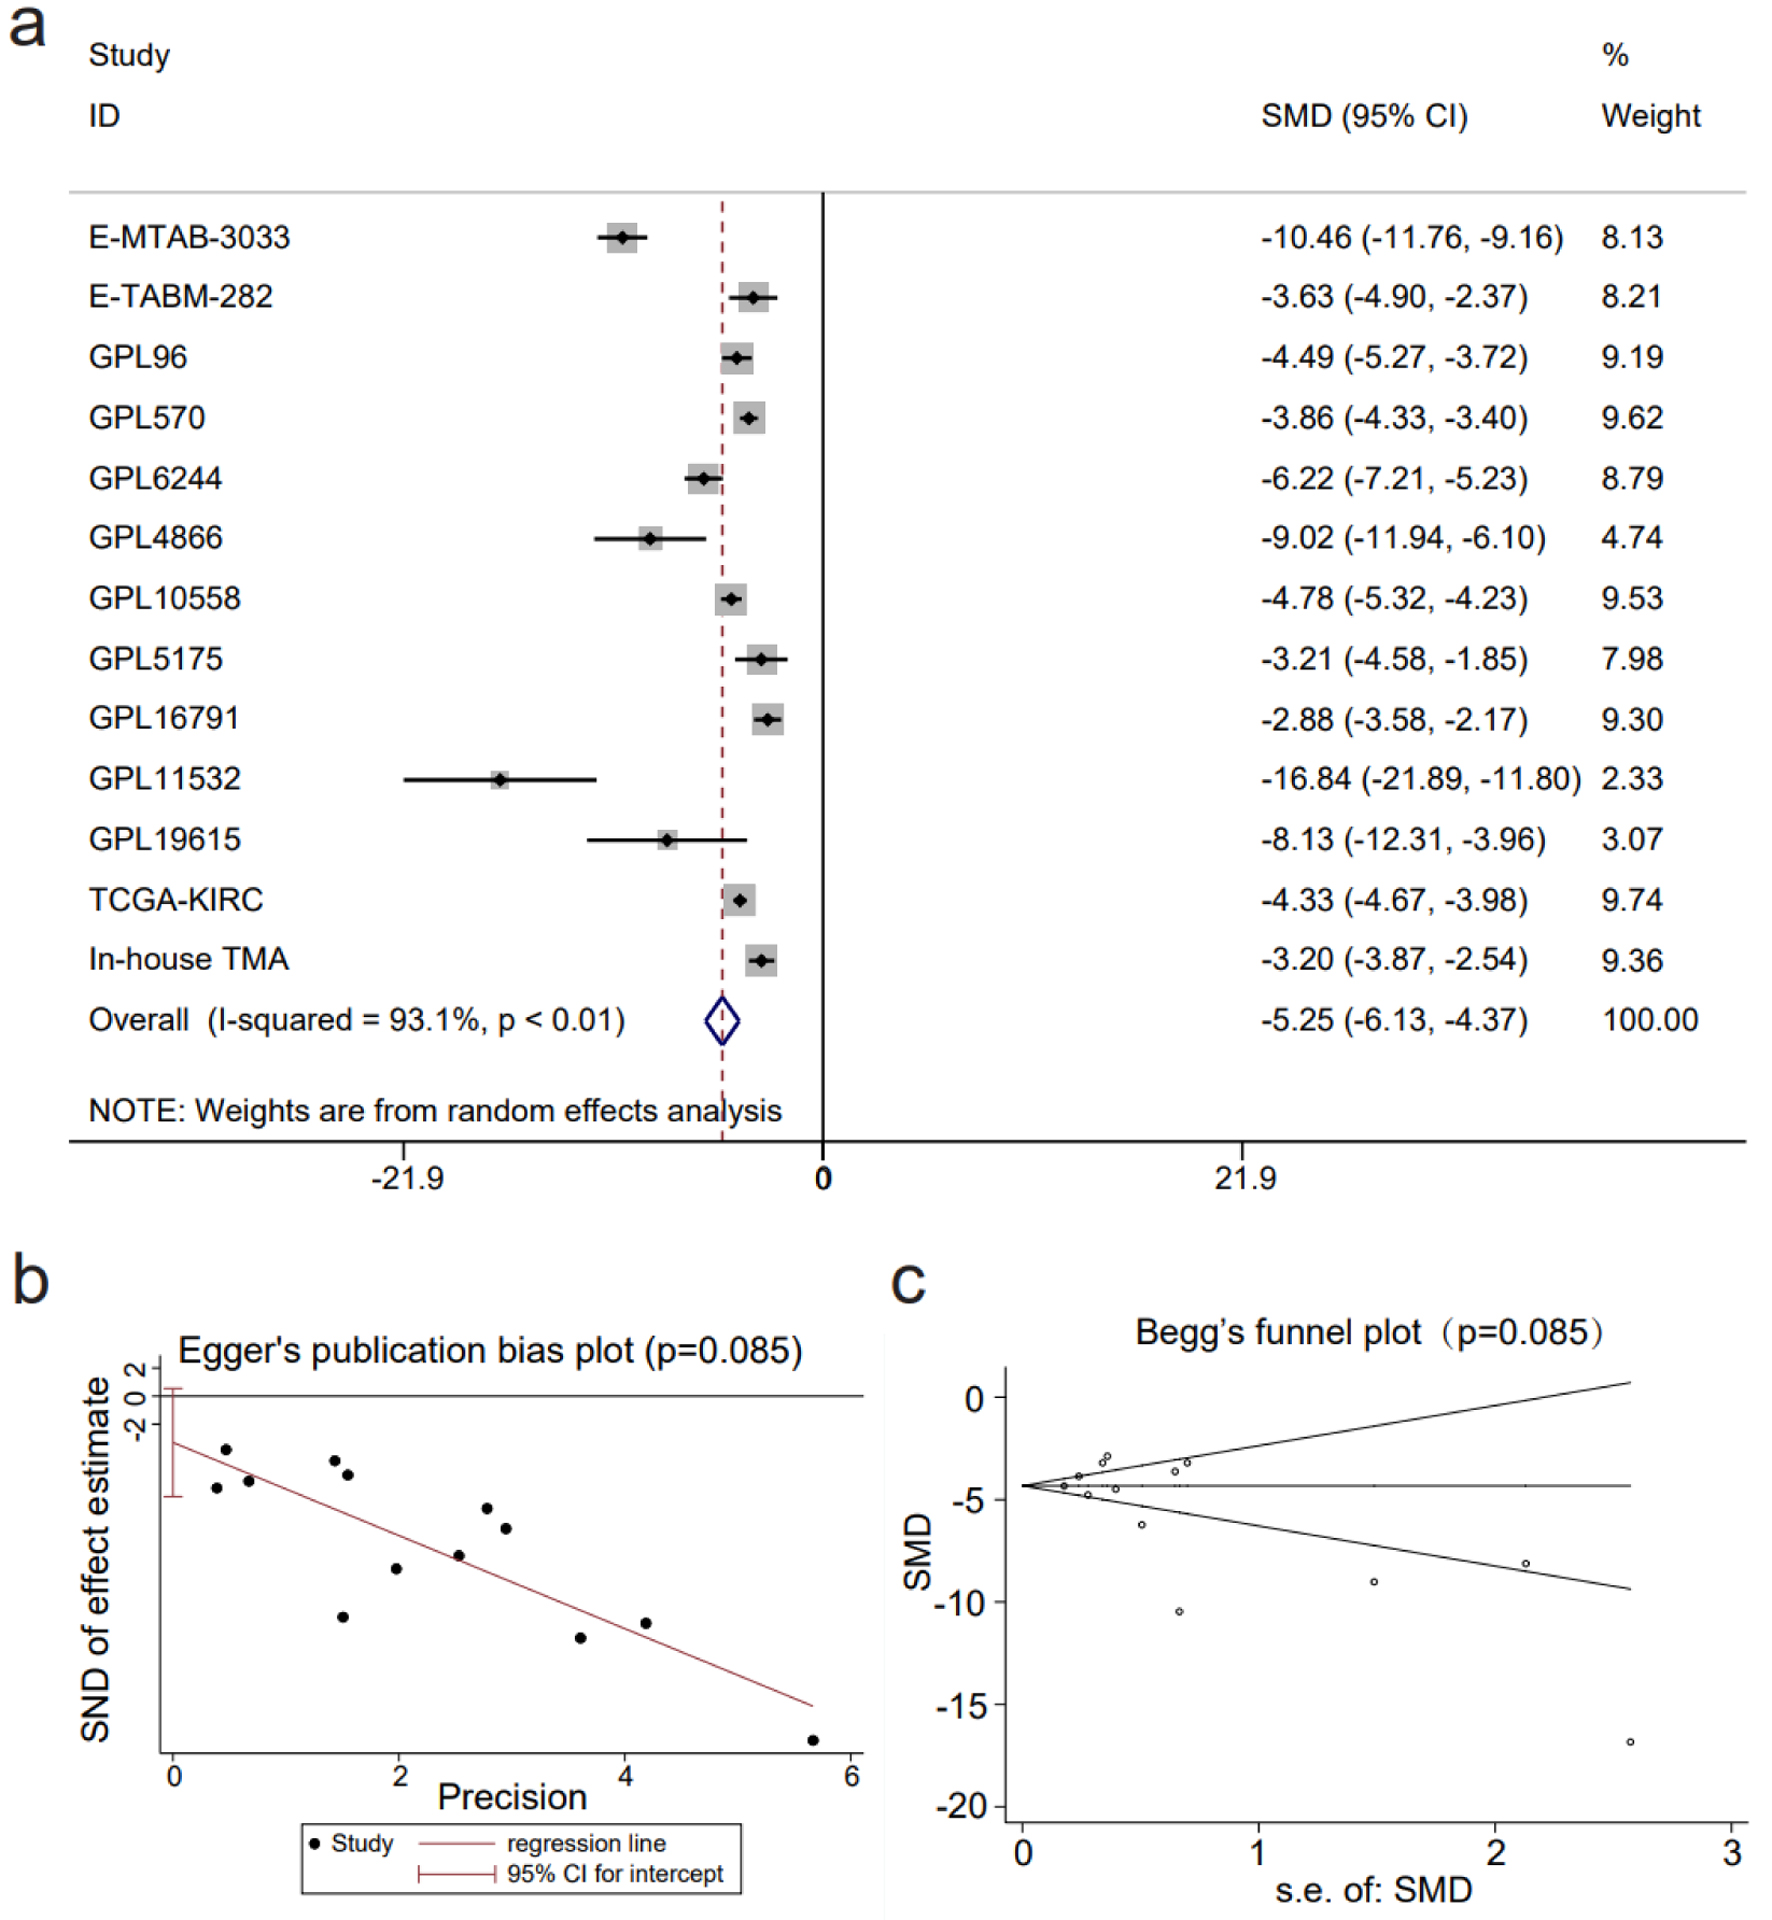
Figure 4. The decline in claudin 8 (CLDN8) expression in kidney renal clear cell carcinoma. (a) Forest plot depicting significant downregulation of CLDN8 expression in kidney renal clear cell carcinoma tissues. (b) Egger’s plot and (c) Begg’s funnel plot indicate the absence of publication bias (P = 0.09).
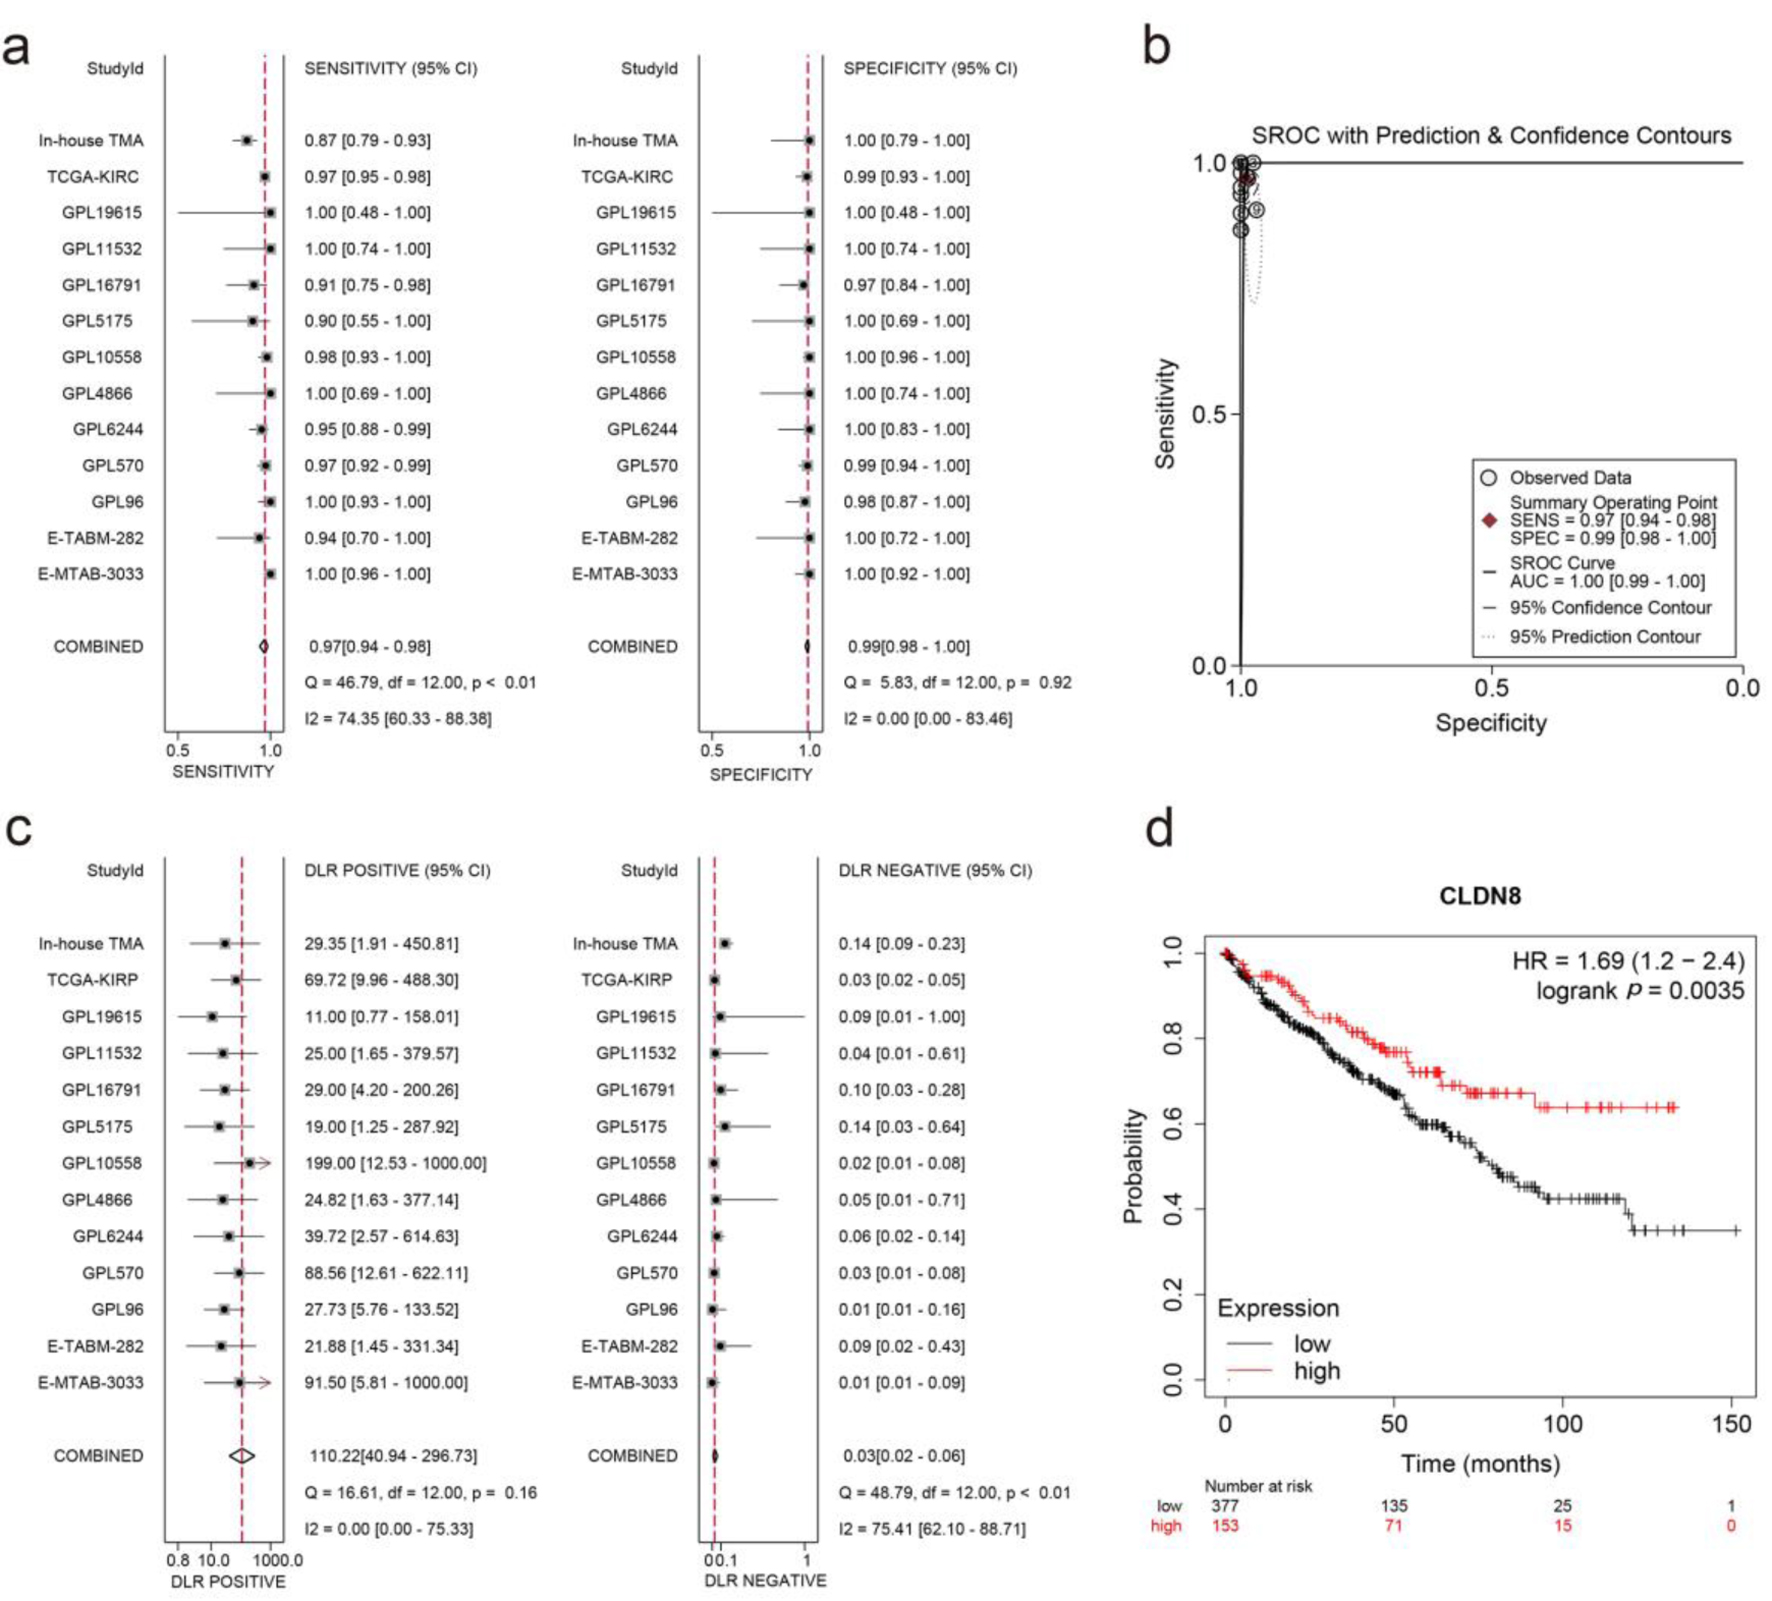
Figure 5. Integrated analysis of effect size forest plots, summary receiver operating characteristics curve, and survival analysis. (a) Sensitivity and specificity assessment. (b) Summary receiver operating characteristics curve. (c) Positive and negative likelihood ratios. (d) Kaplan-Meier survival curve.
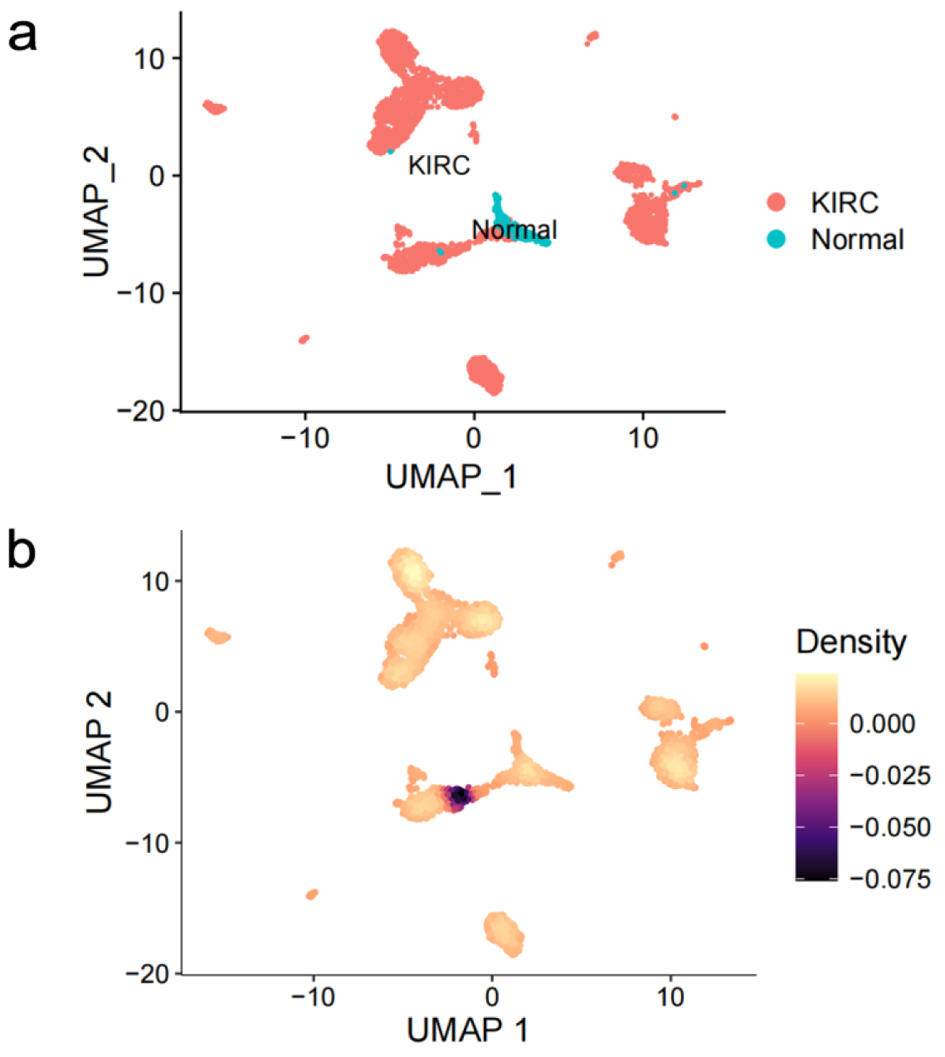
Figure 6. Expression profiling of claudin 8 (CLDN8) in single cells of kidney renal clear cell carcinoma. (a) Cell distribution in kidney renal clear cell carcinoma (KIRC). (b) Comparative analysis of CLDN8 mRNA expression levels in KIRC cells and normal cells.
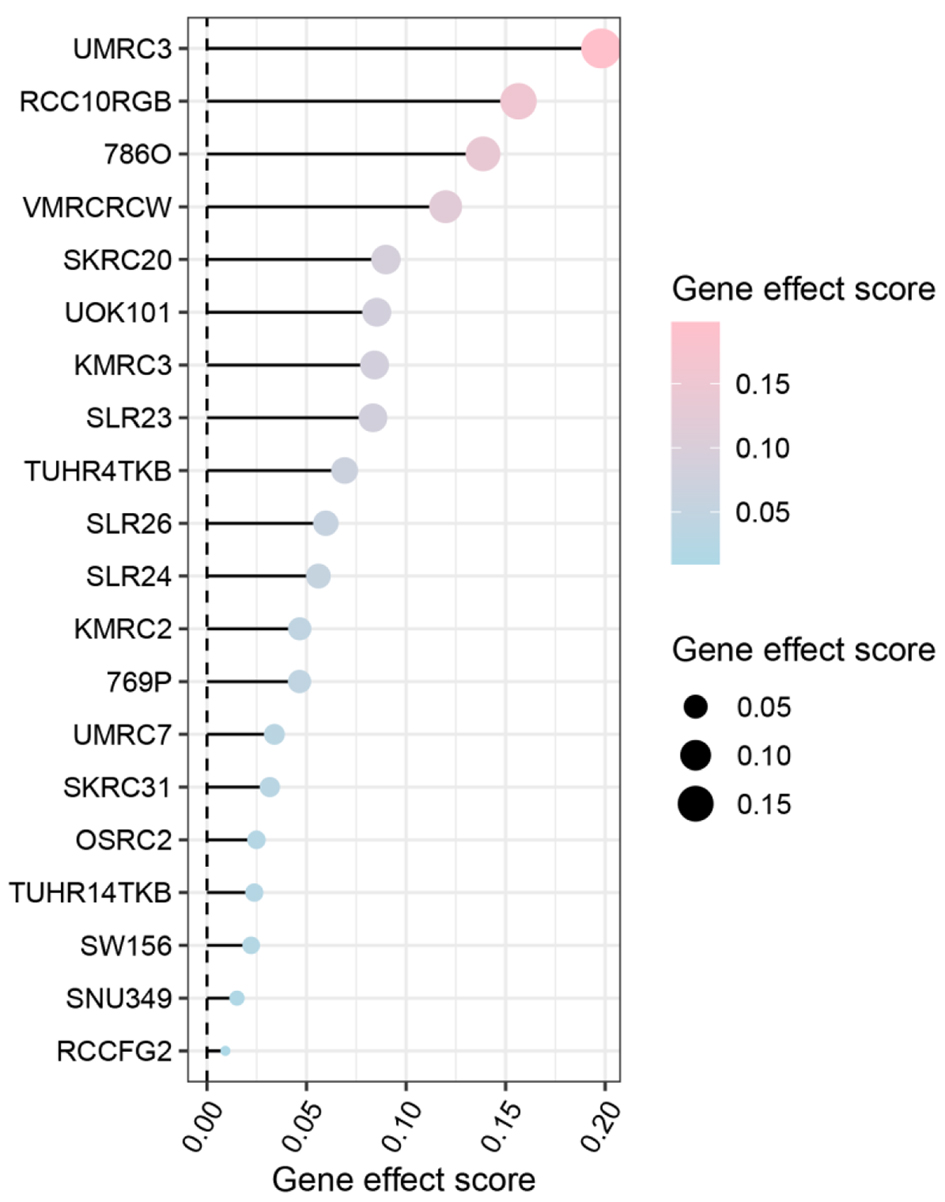
Figure 7. Gene effect score analysis of claudin 8 (CLDN8) in 20 kidney renal clear cell carcinoma cell lines. The findings suggest a potential inhibitory role of CLDN8 in the growth of kidney renal clear cell carcinoma cells.
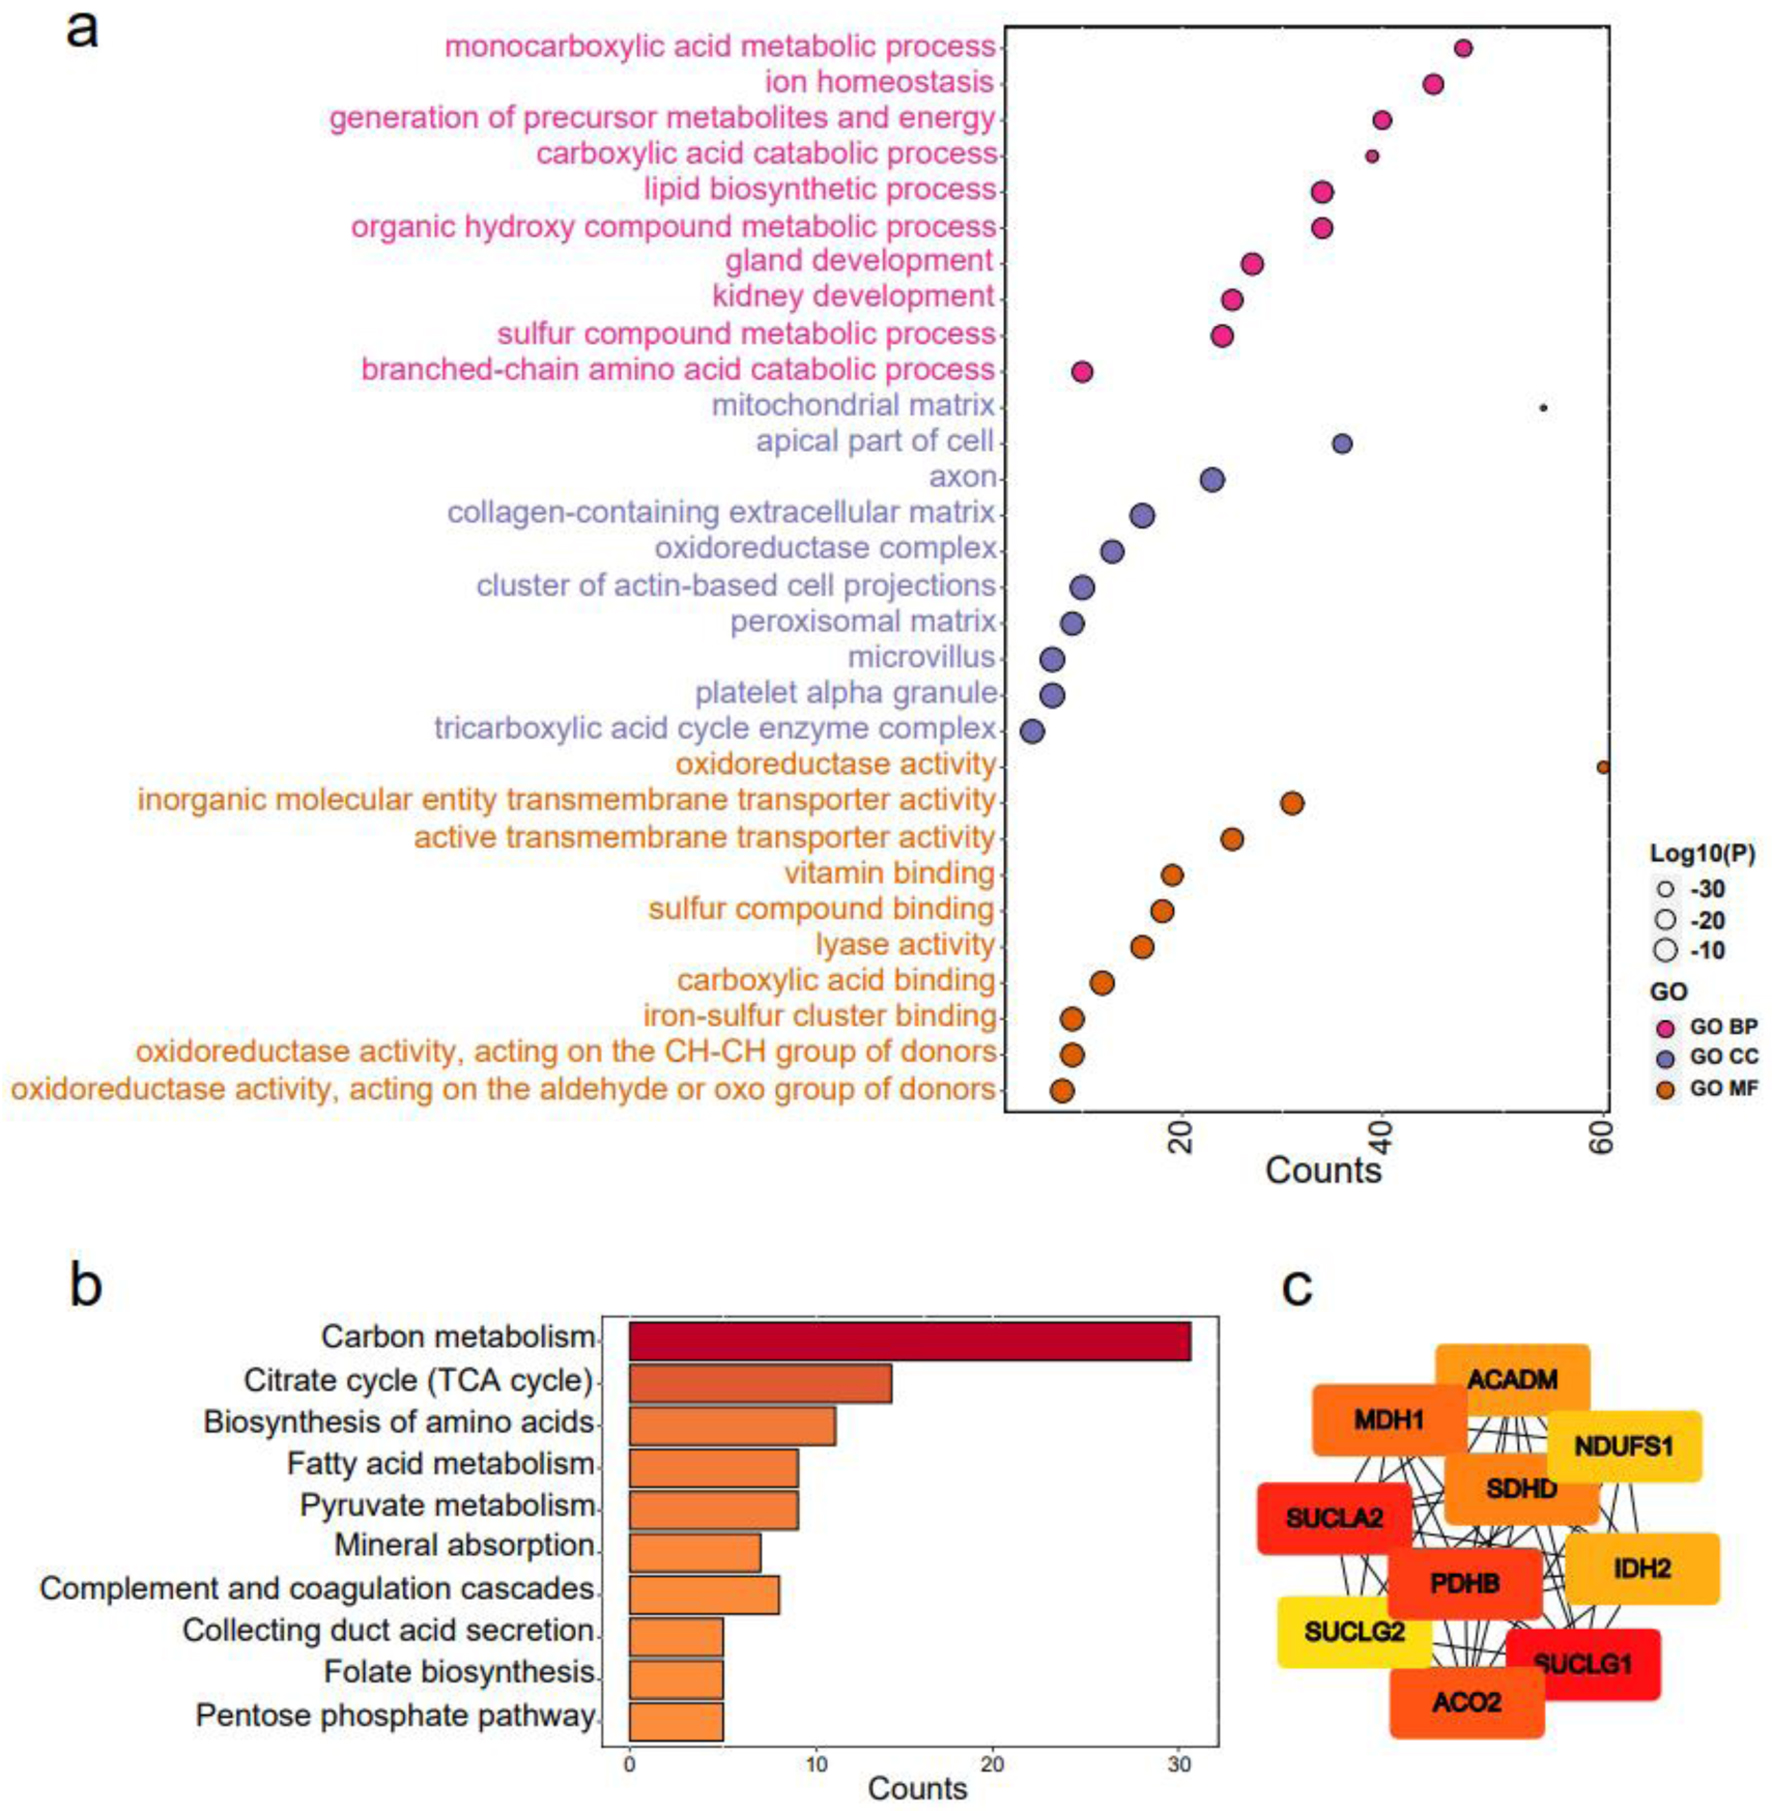
Figure 8. Functional enrichment analysis of claudin 8 (CLDN8) and hub genes. (a) Gene ontology terms encompassing biological processes, cell components, and molecular functions. (b) Kyoto encyclopedia of genes and genomes pathways. (c) Identification of top 10 hub genes via protein-protein interaction network analysis using Cytohubba.
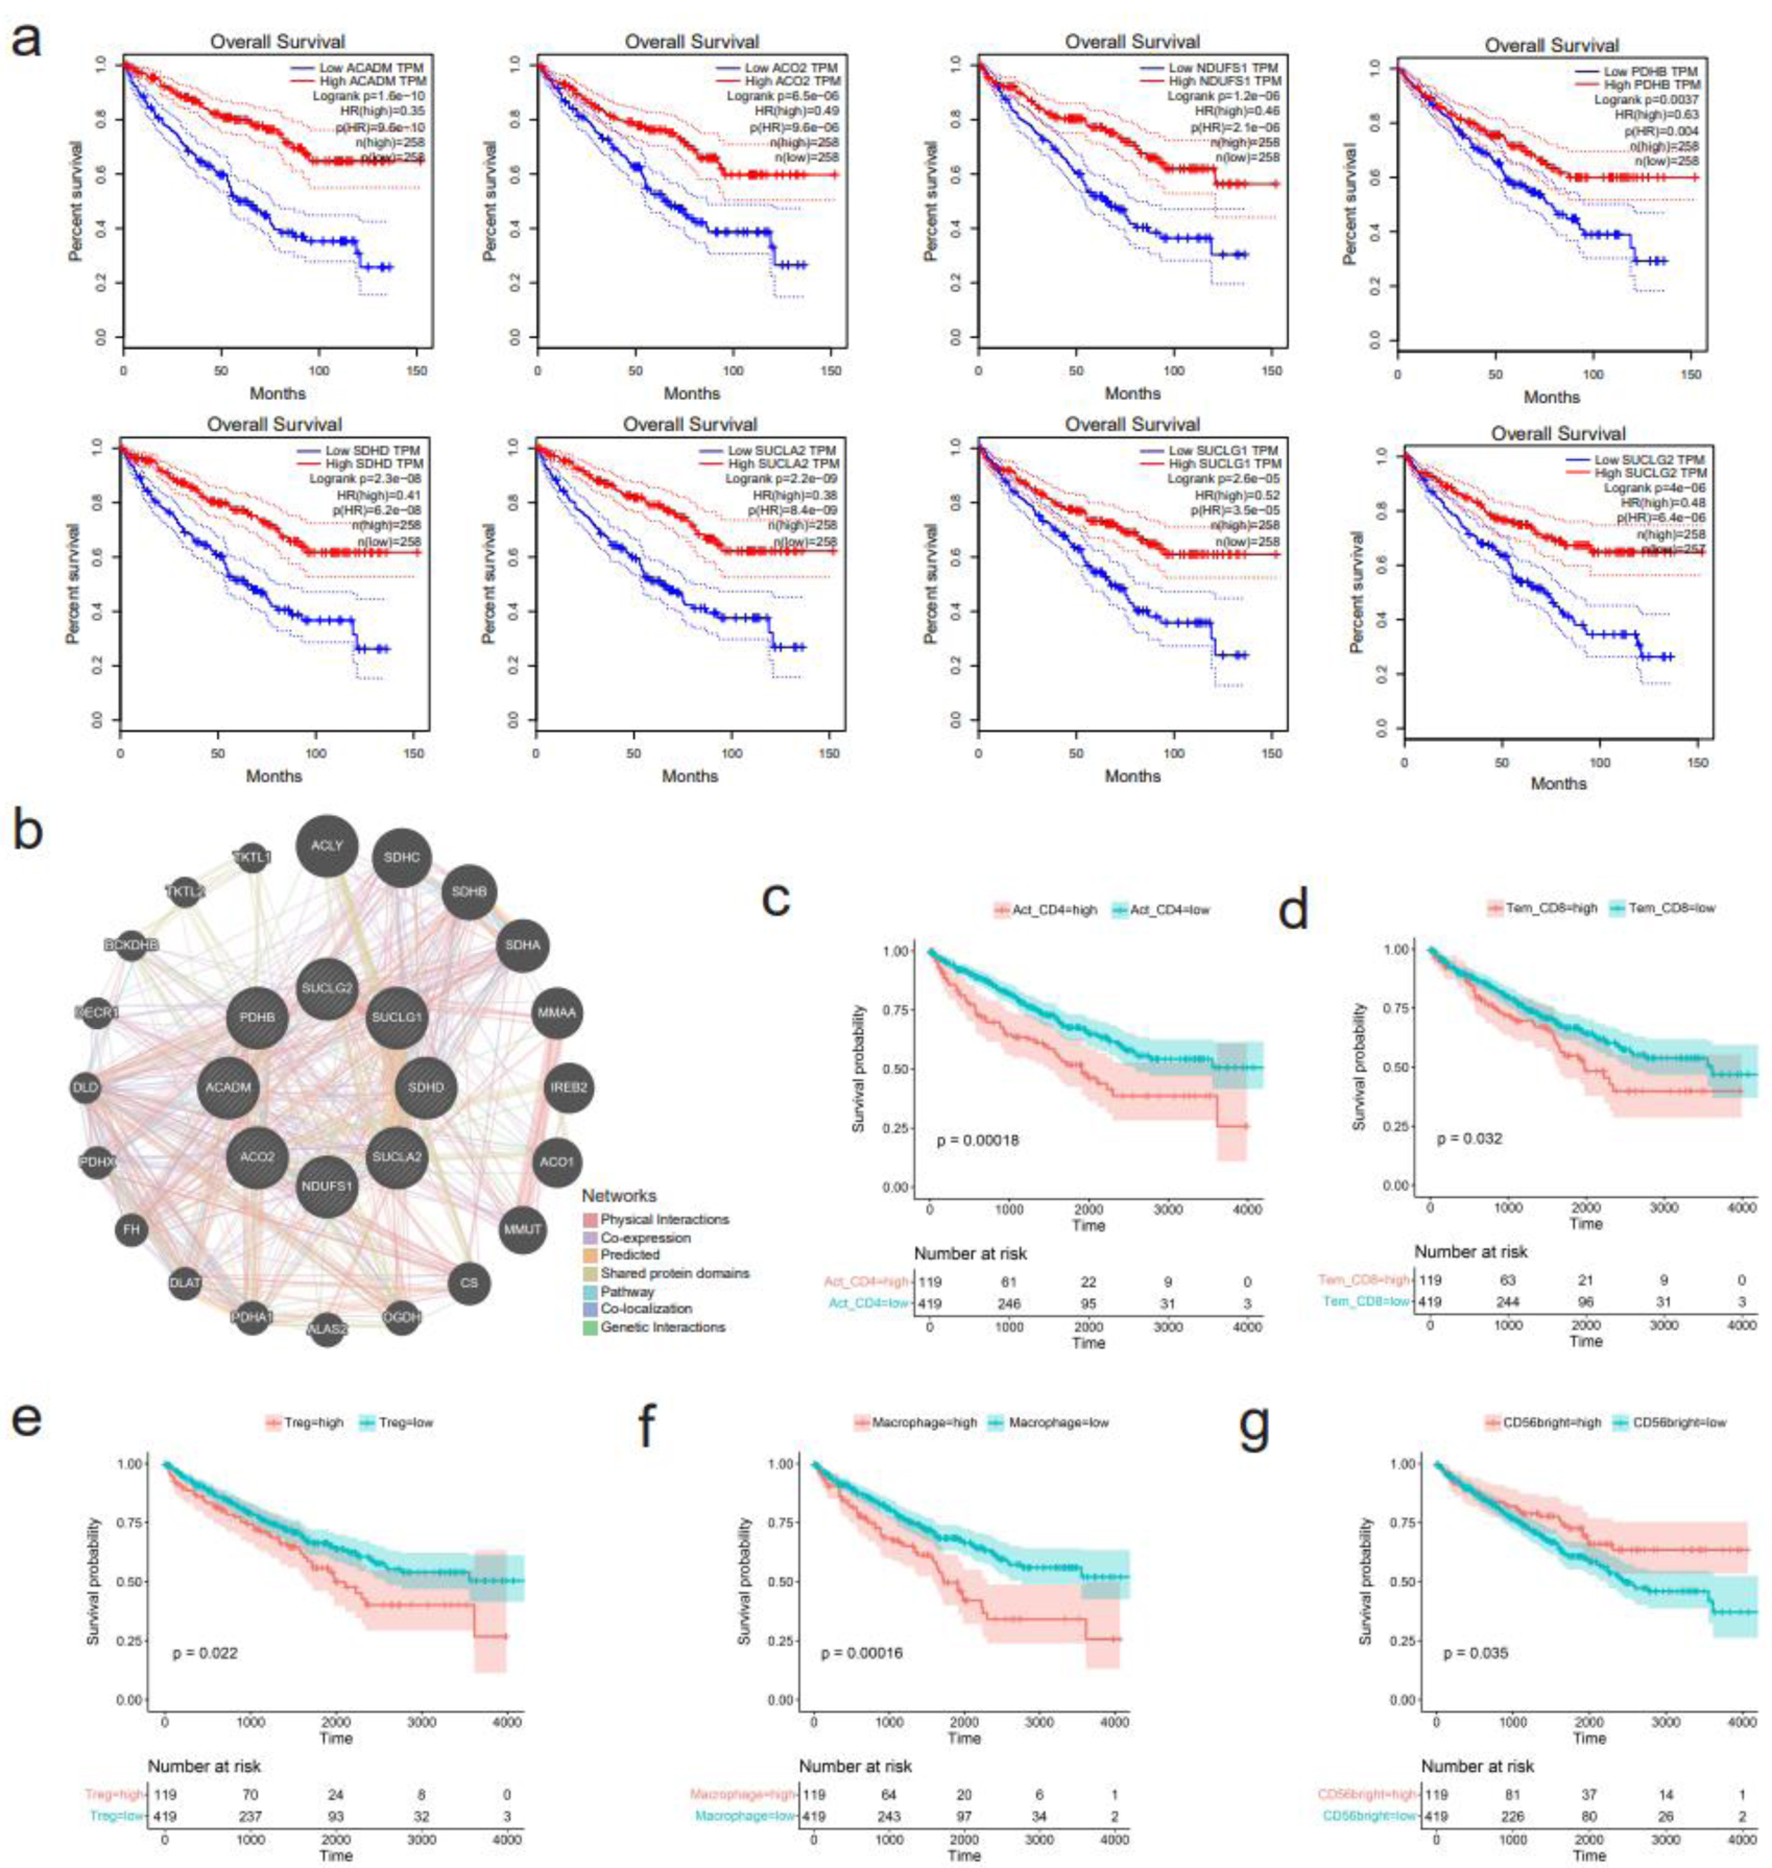
Figure 9. Survival analysis of hub genes and several immune cells. (a) Downregulation of eight hub genes, including ACADM, ACO2, NDUFS1, PDHB, SDHD, SUCLA2, SUCLG1, and SUCLG2, correlates with shorter overall survival of kidney renal clear cell carcinoma (KIRC) patients. (b) Functional interaction network of the eight hub genes using GeneMANIA algorithm. (c-g) Correlation between infiltration levels of various immune cells and survival of KIRC patients. (c) Activated CD4+ T cells. (d) Effector memory CD8+ T cells. (e) Regulatory T cells. (f) Macrophage. (g) CD56bright natural killer cells.


