Figures
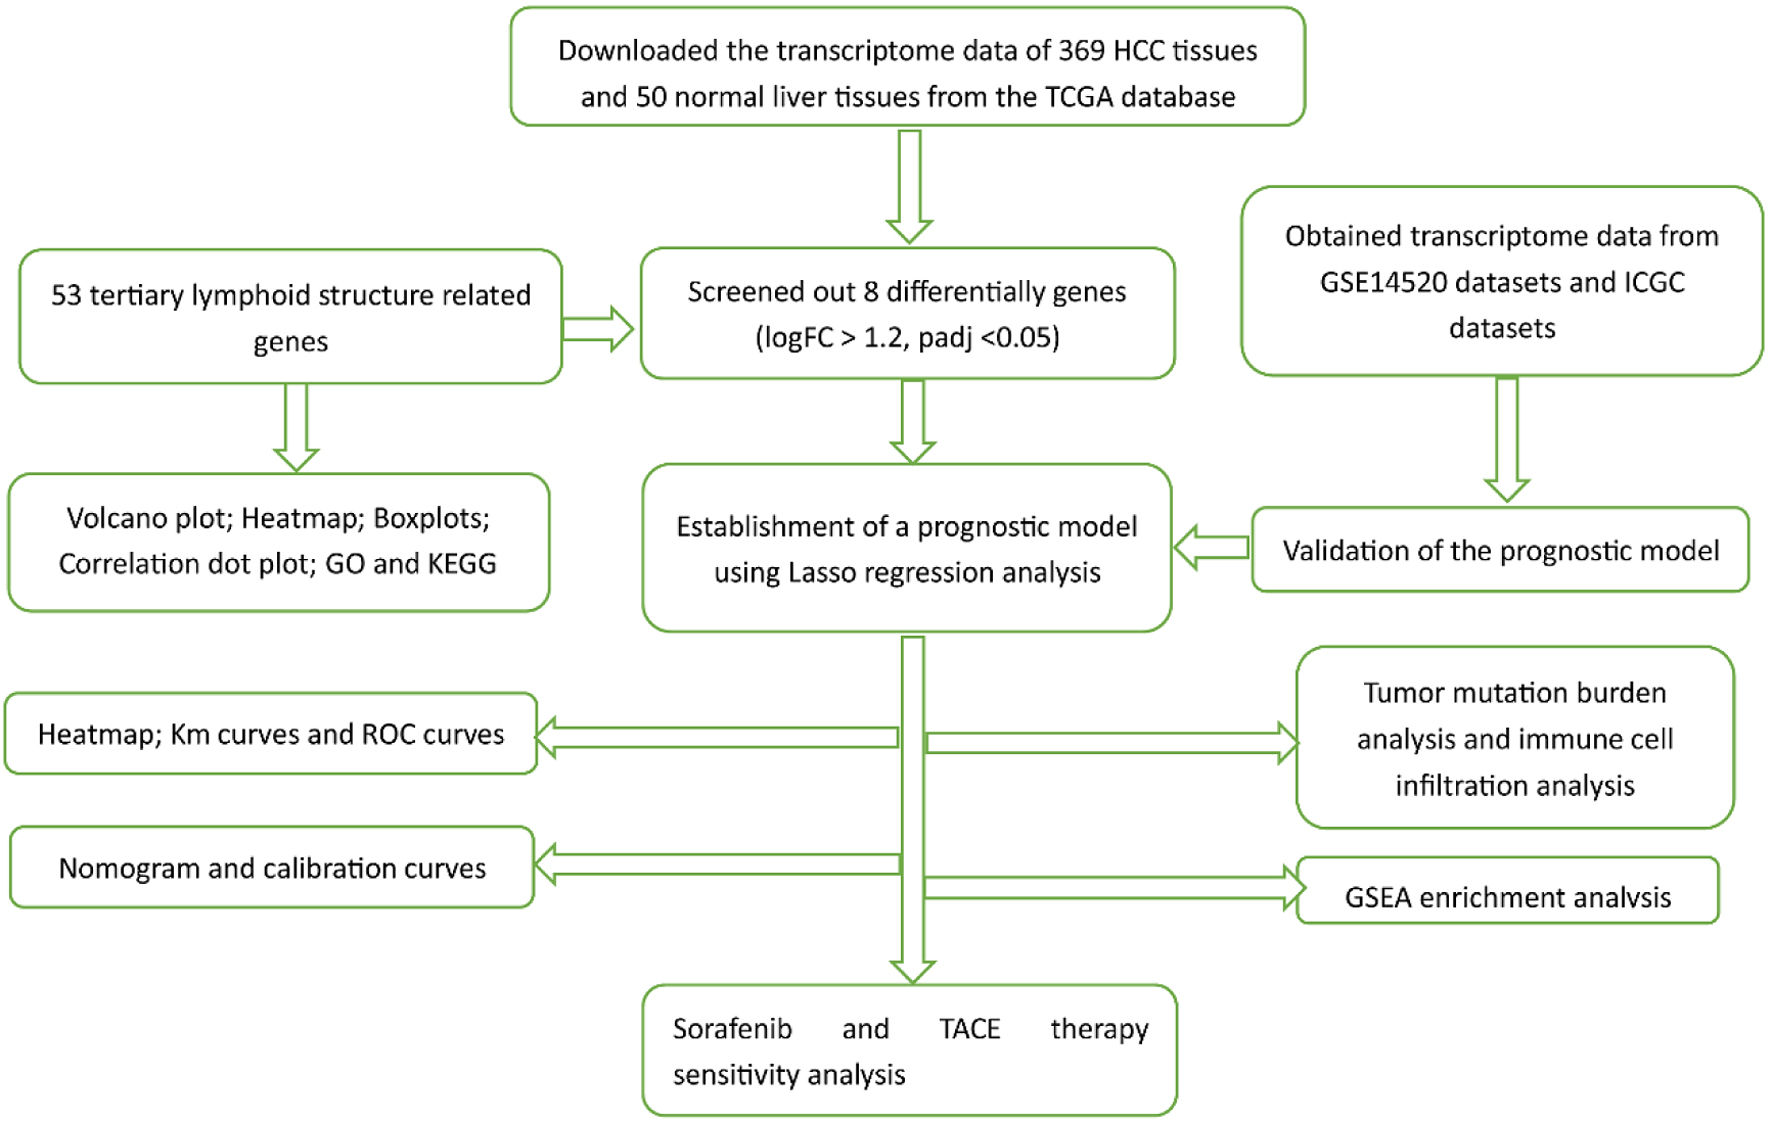
Figure 1. The flowchart of our study process.
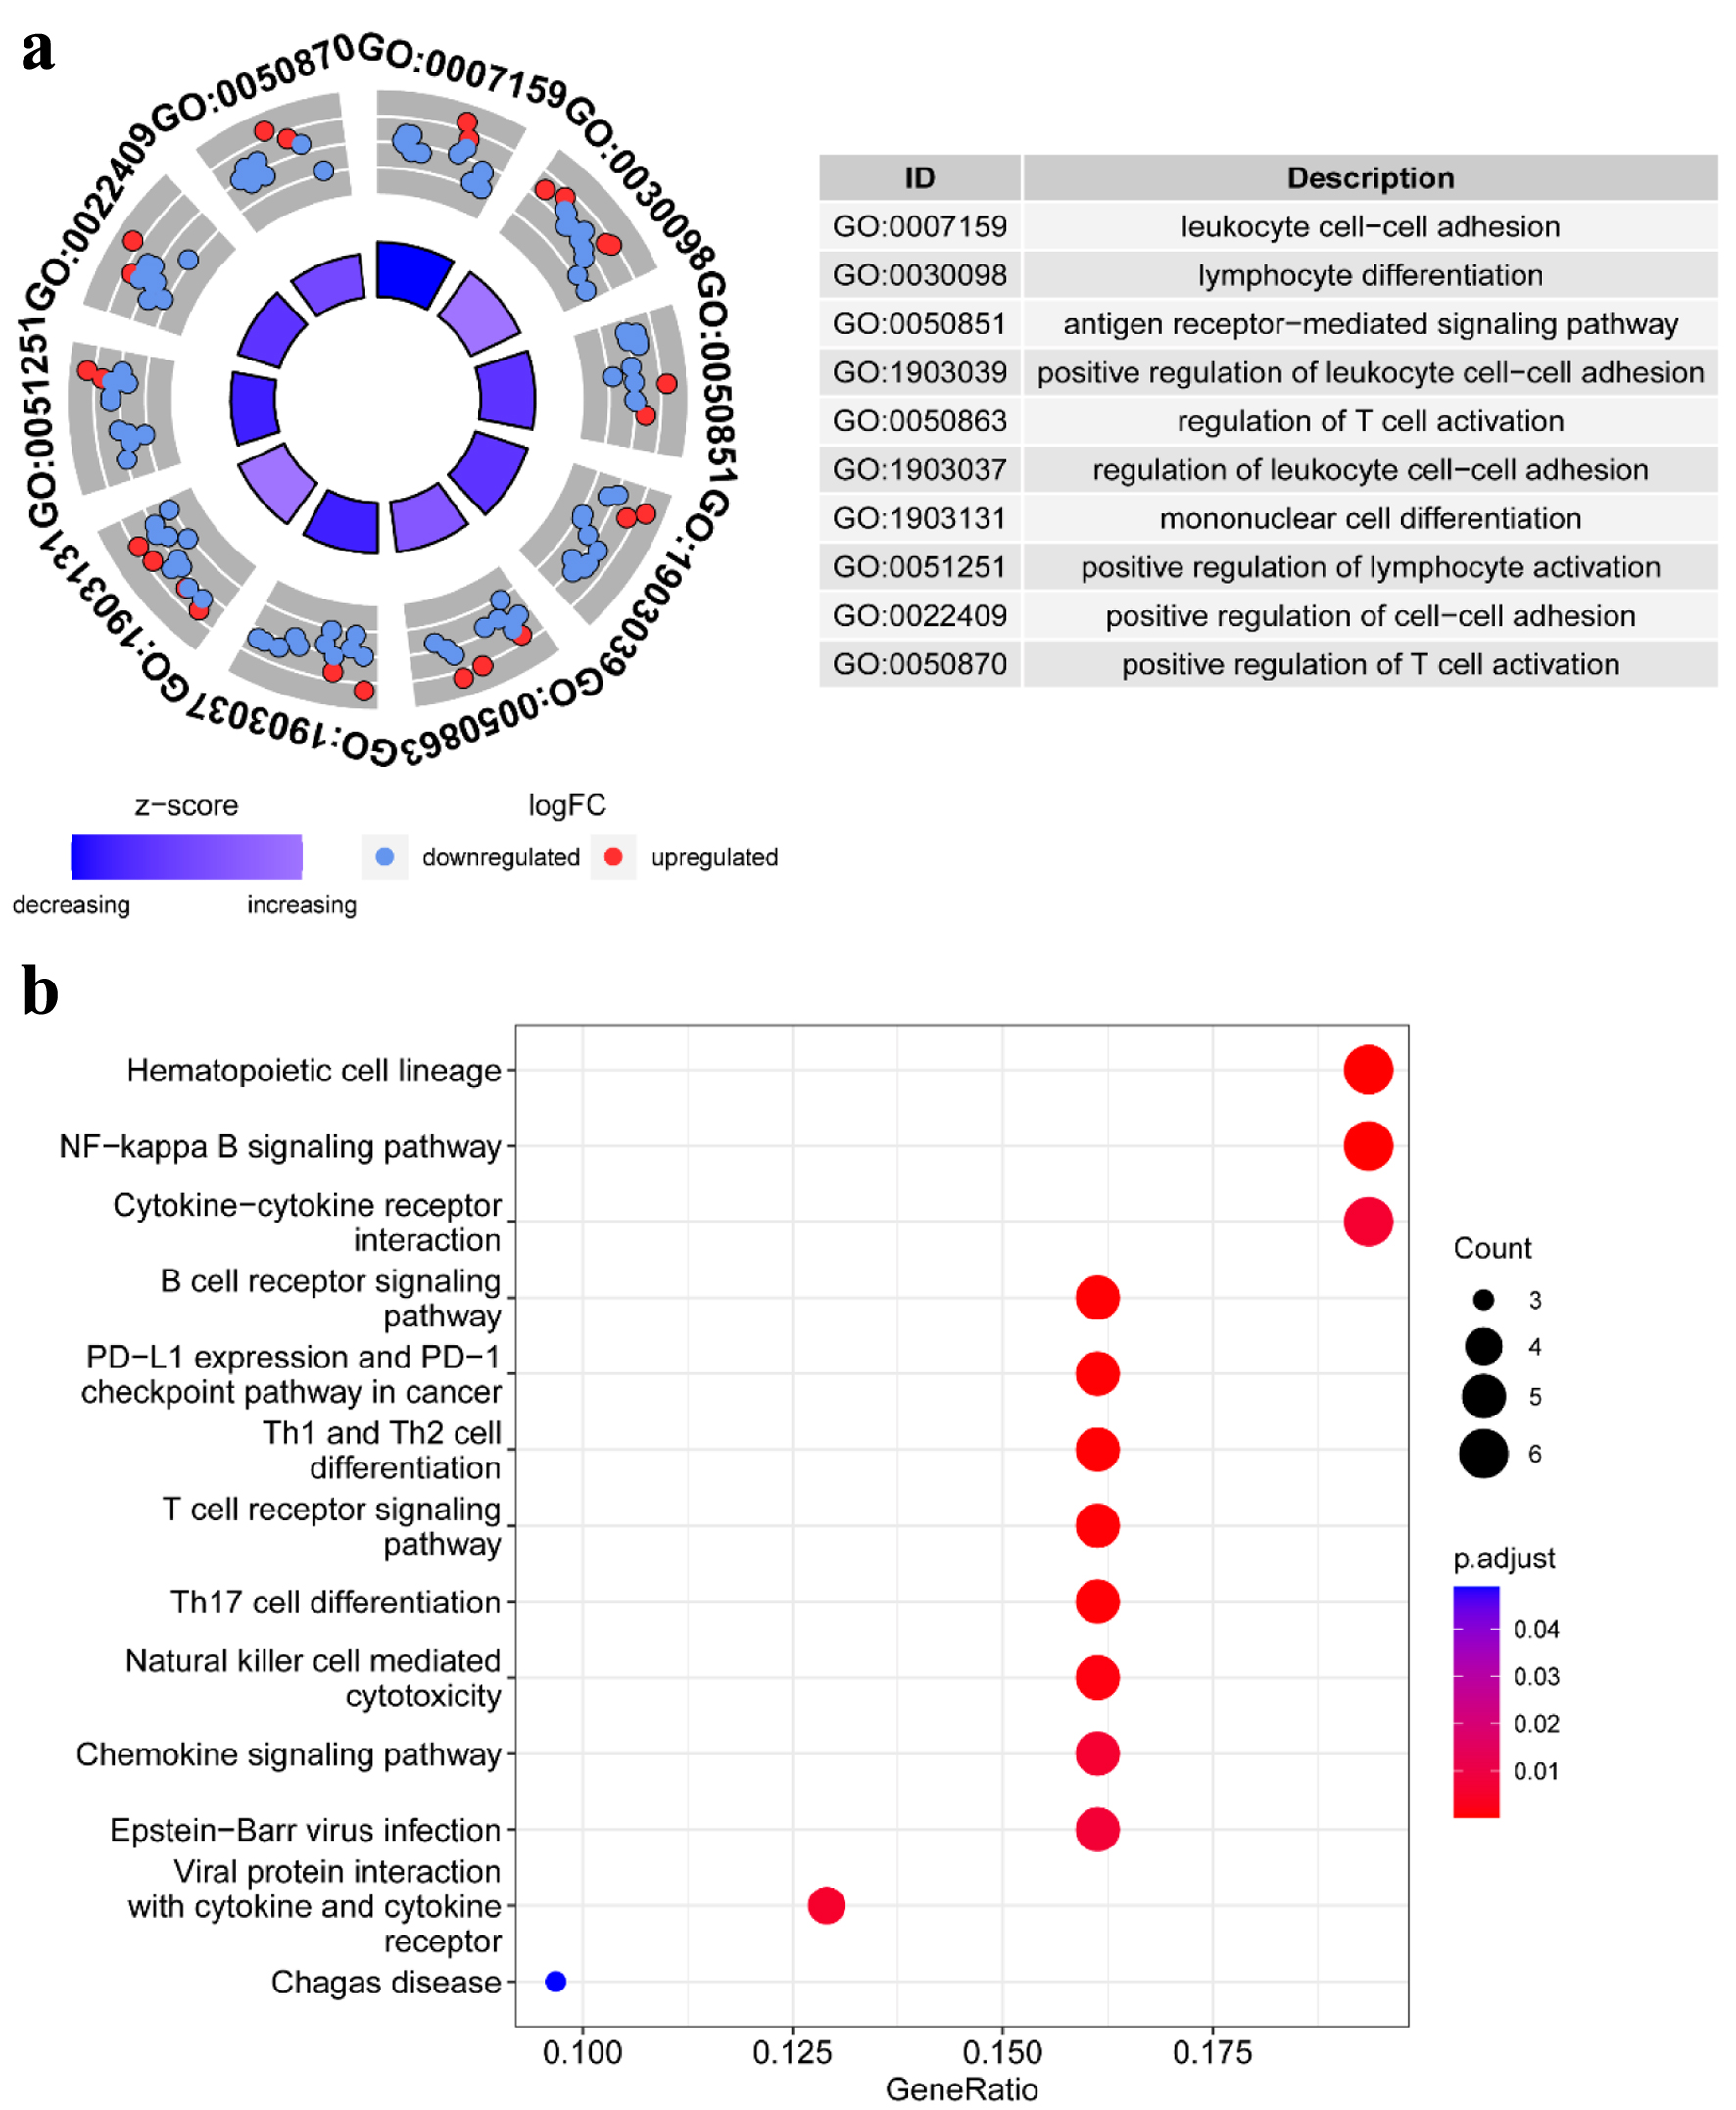
Figure 2. Pathway enrichment analysis of TLS-related genes in HCC patients of TCGA: (a) the enriched item in the gene ontology (GO) analysis; (b) the enriched item in the Kyoto Encyclopedia of Genes and Genomes (KEGG) analysis. TLS: tertiary lymphoid structures.
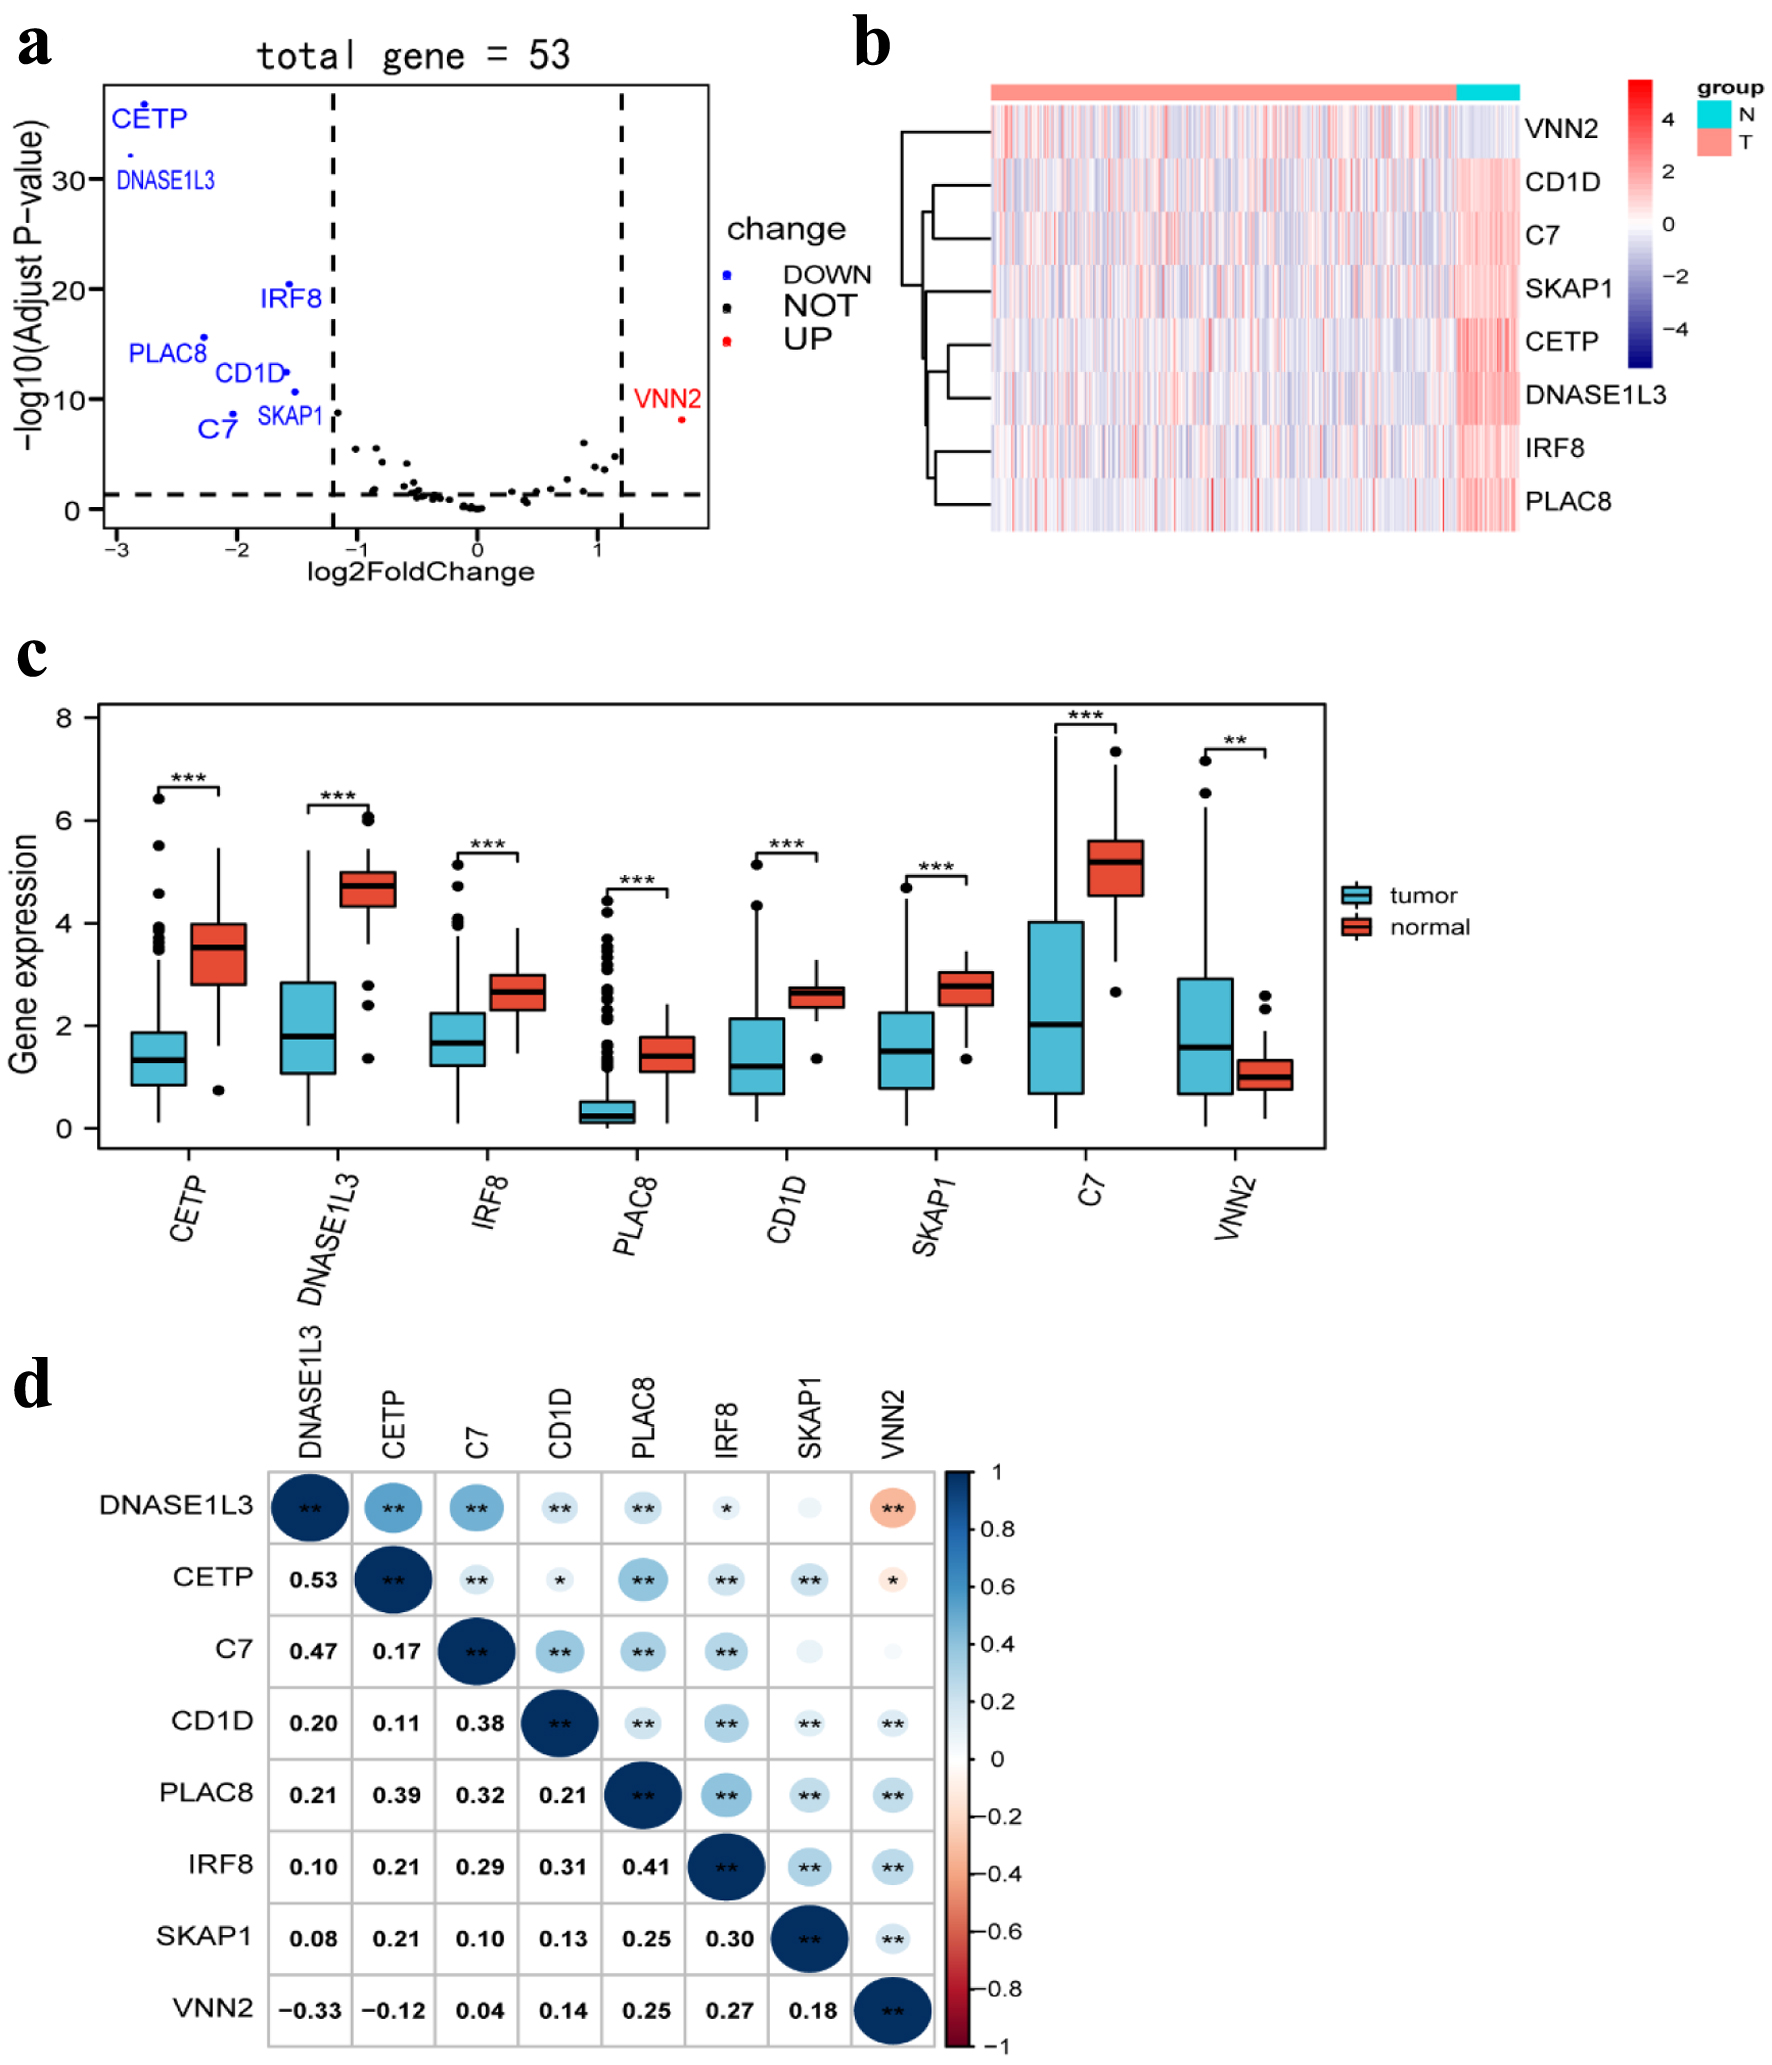
Figure 3. Differentially expressed TLS-related genes between HCC tissues and normal tissues. (a) Volcano plot indicates TLS-related genes, with red dots indicating high expression and blue dots indicating low expression. (b) Heatmap of differentially expressed TLS-related genes, with red indicating high expression, blue indicating low expression, n representing normal tissues, and t representing tumor tissues. (c) Boxplots of differentially expressed TLS-related genes, with blue boxes representing tumor groups and red boxes representing normal groups. (d) The correlation of TLS-related genes with each other. TLS: tertiary lymphoid structures.
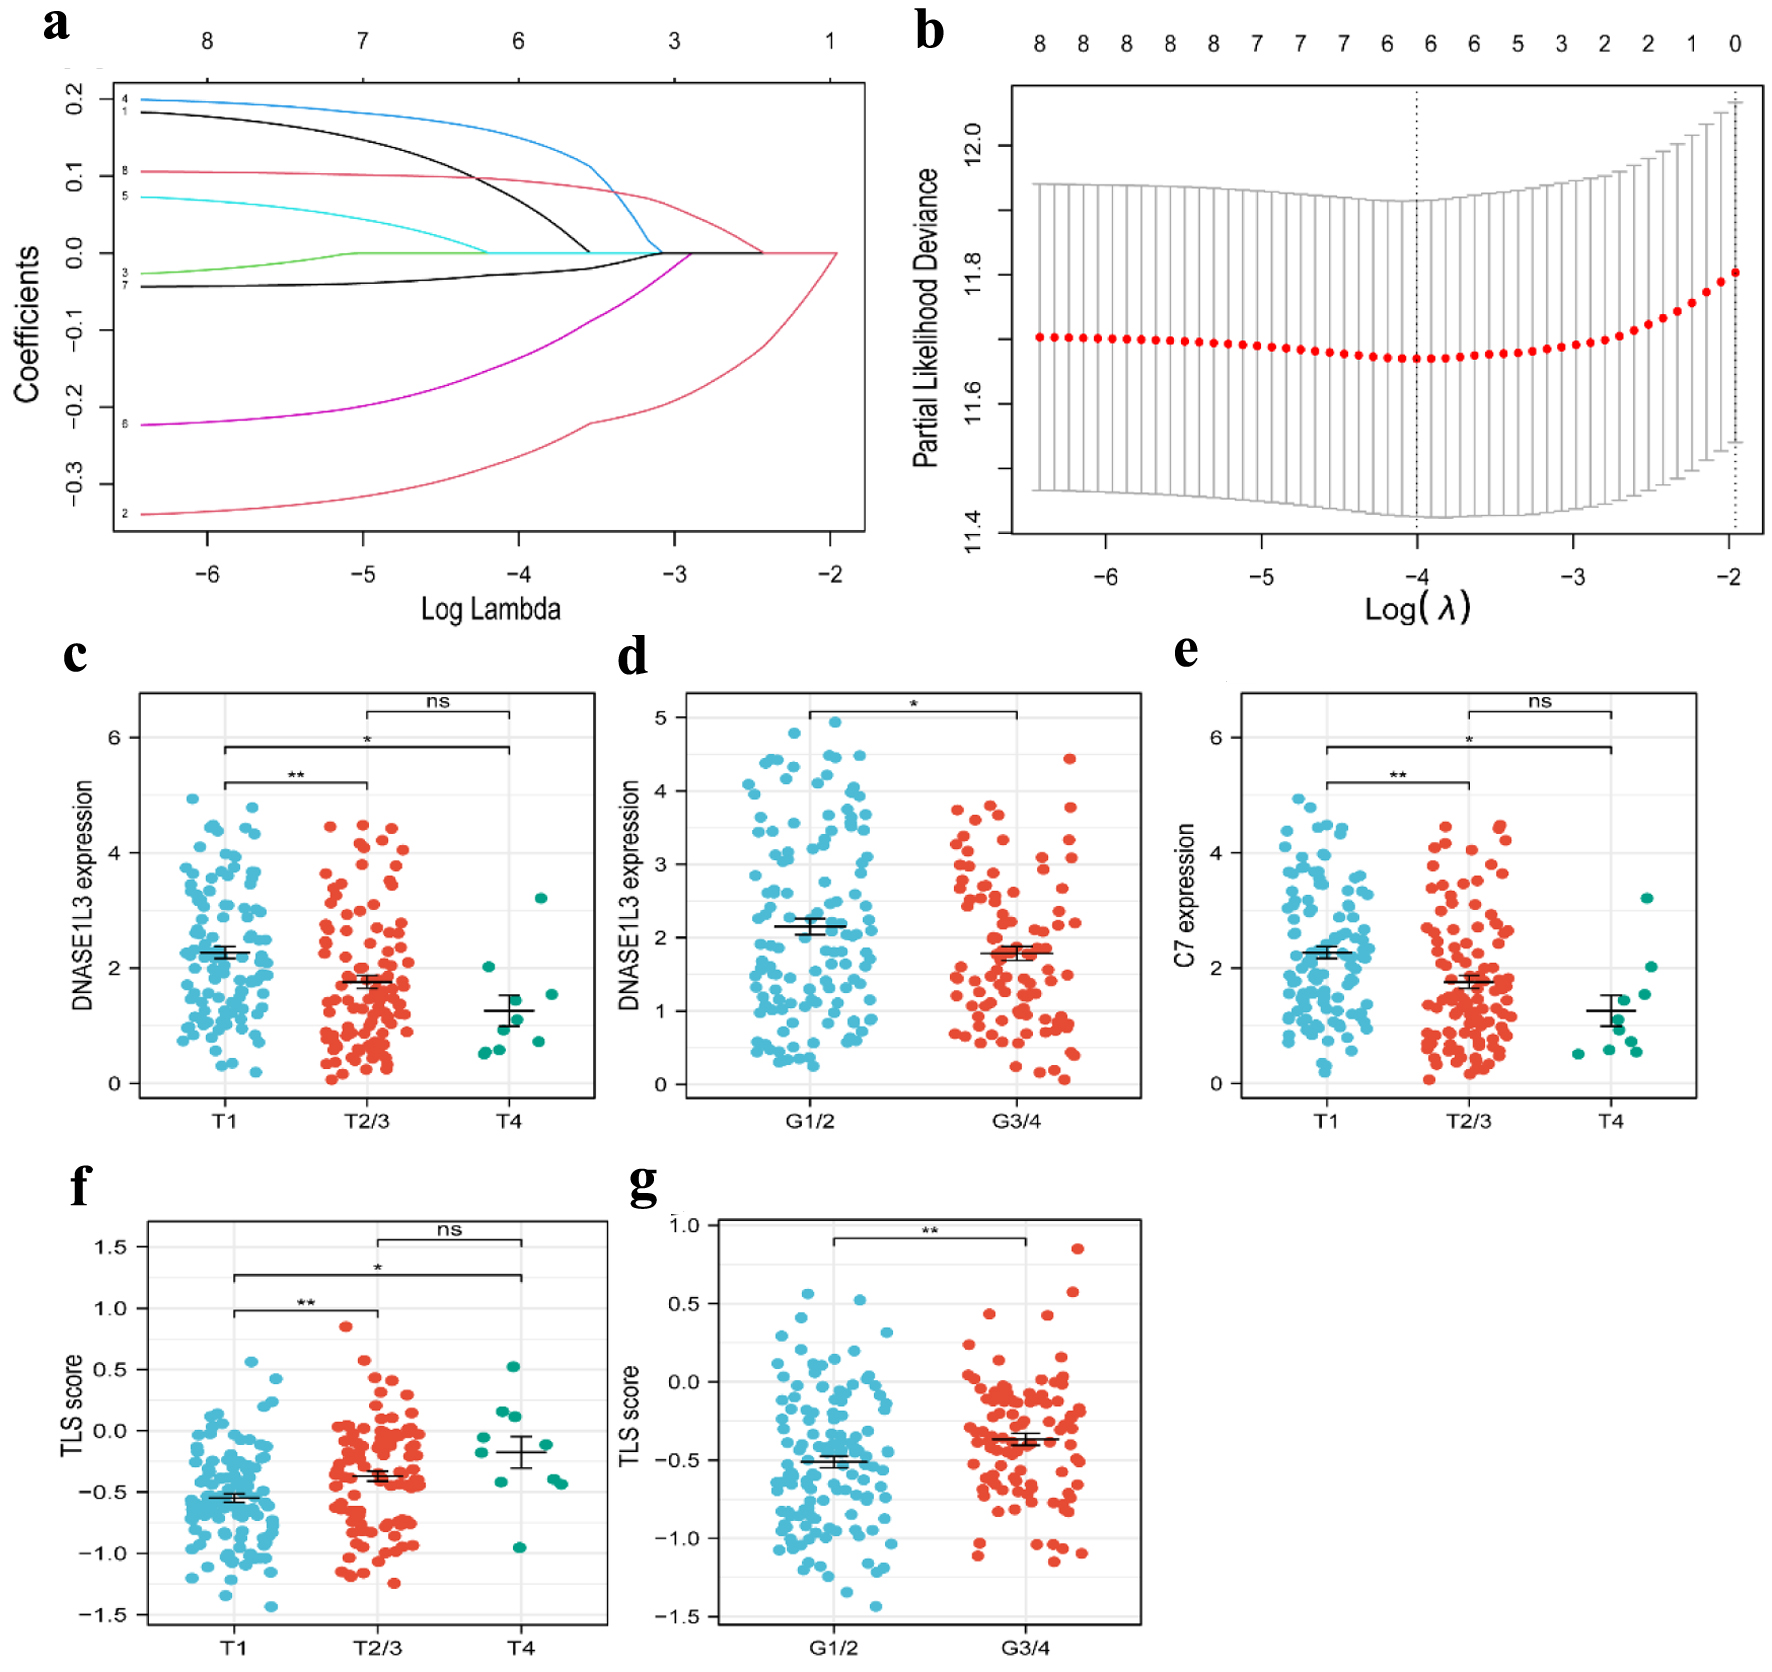
Figure 4. Construction of a risk prognostic model based on TLS-related genes in the TCGA cohort. (a) Cross-validation for tuning the parameter selection in the LASSO regression. (b) LASSO regression of the 6 OS-related genes. (c, d) The dot plots of T stage (c) and tumor grade (d) with DNASE1L3 expression. (e) The dot plots of T stage with C7 expression. (f, g) The dot plots of T stage (f) and grade (g) with risk score. TLS: tertiary lymphoid structures; LASSO: least absolute shrinkage and selection operator.
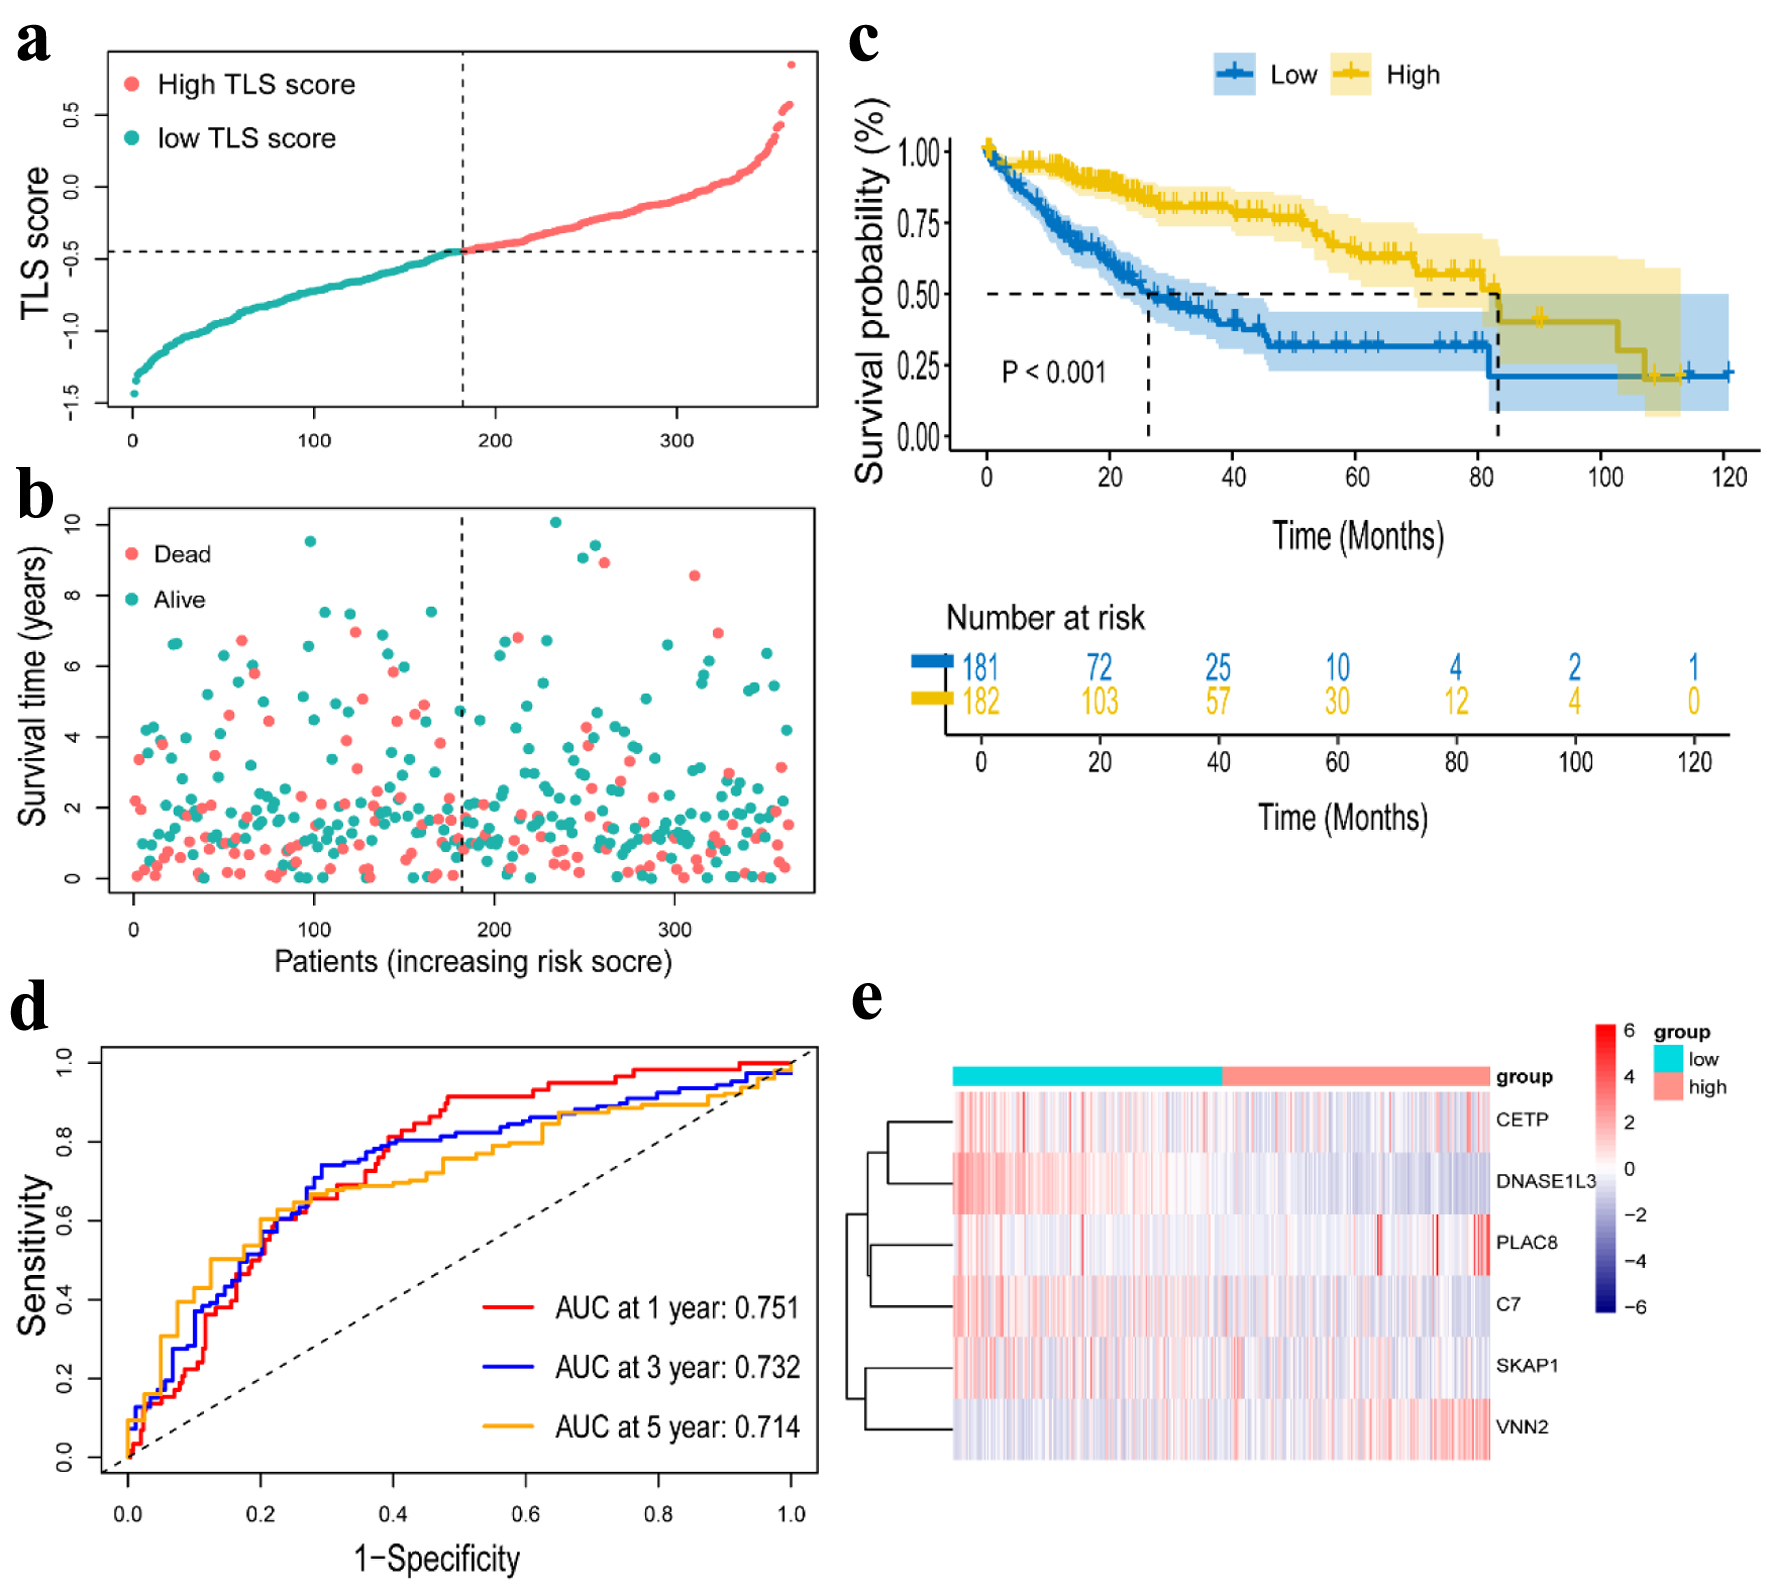
Figure 5. Construction of a risk prognostic model in TCGA cohort. (a) The patients were equally divided into two groups according to the threshold of the median TLS score. Blue represents the low TLS score group. Red represents the high TLS score group. (b) Survival status of patients with HCC in high and low risk groups. Blue represents survival. Red represents death. (c) Kaplan Meier curves showing the overall survival of patients in the high TLS score and low TLS score groups. (d) The predictive efficiency of the TLS score was verified by the ROC curve. (e) Heatmap showing the expression of the six TLS-related genes. Blue represents the low TLS score group. Red represents the high TLS score group. TLS: tertiary lymphoid structures.
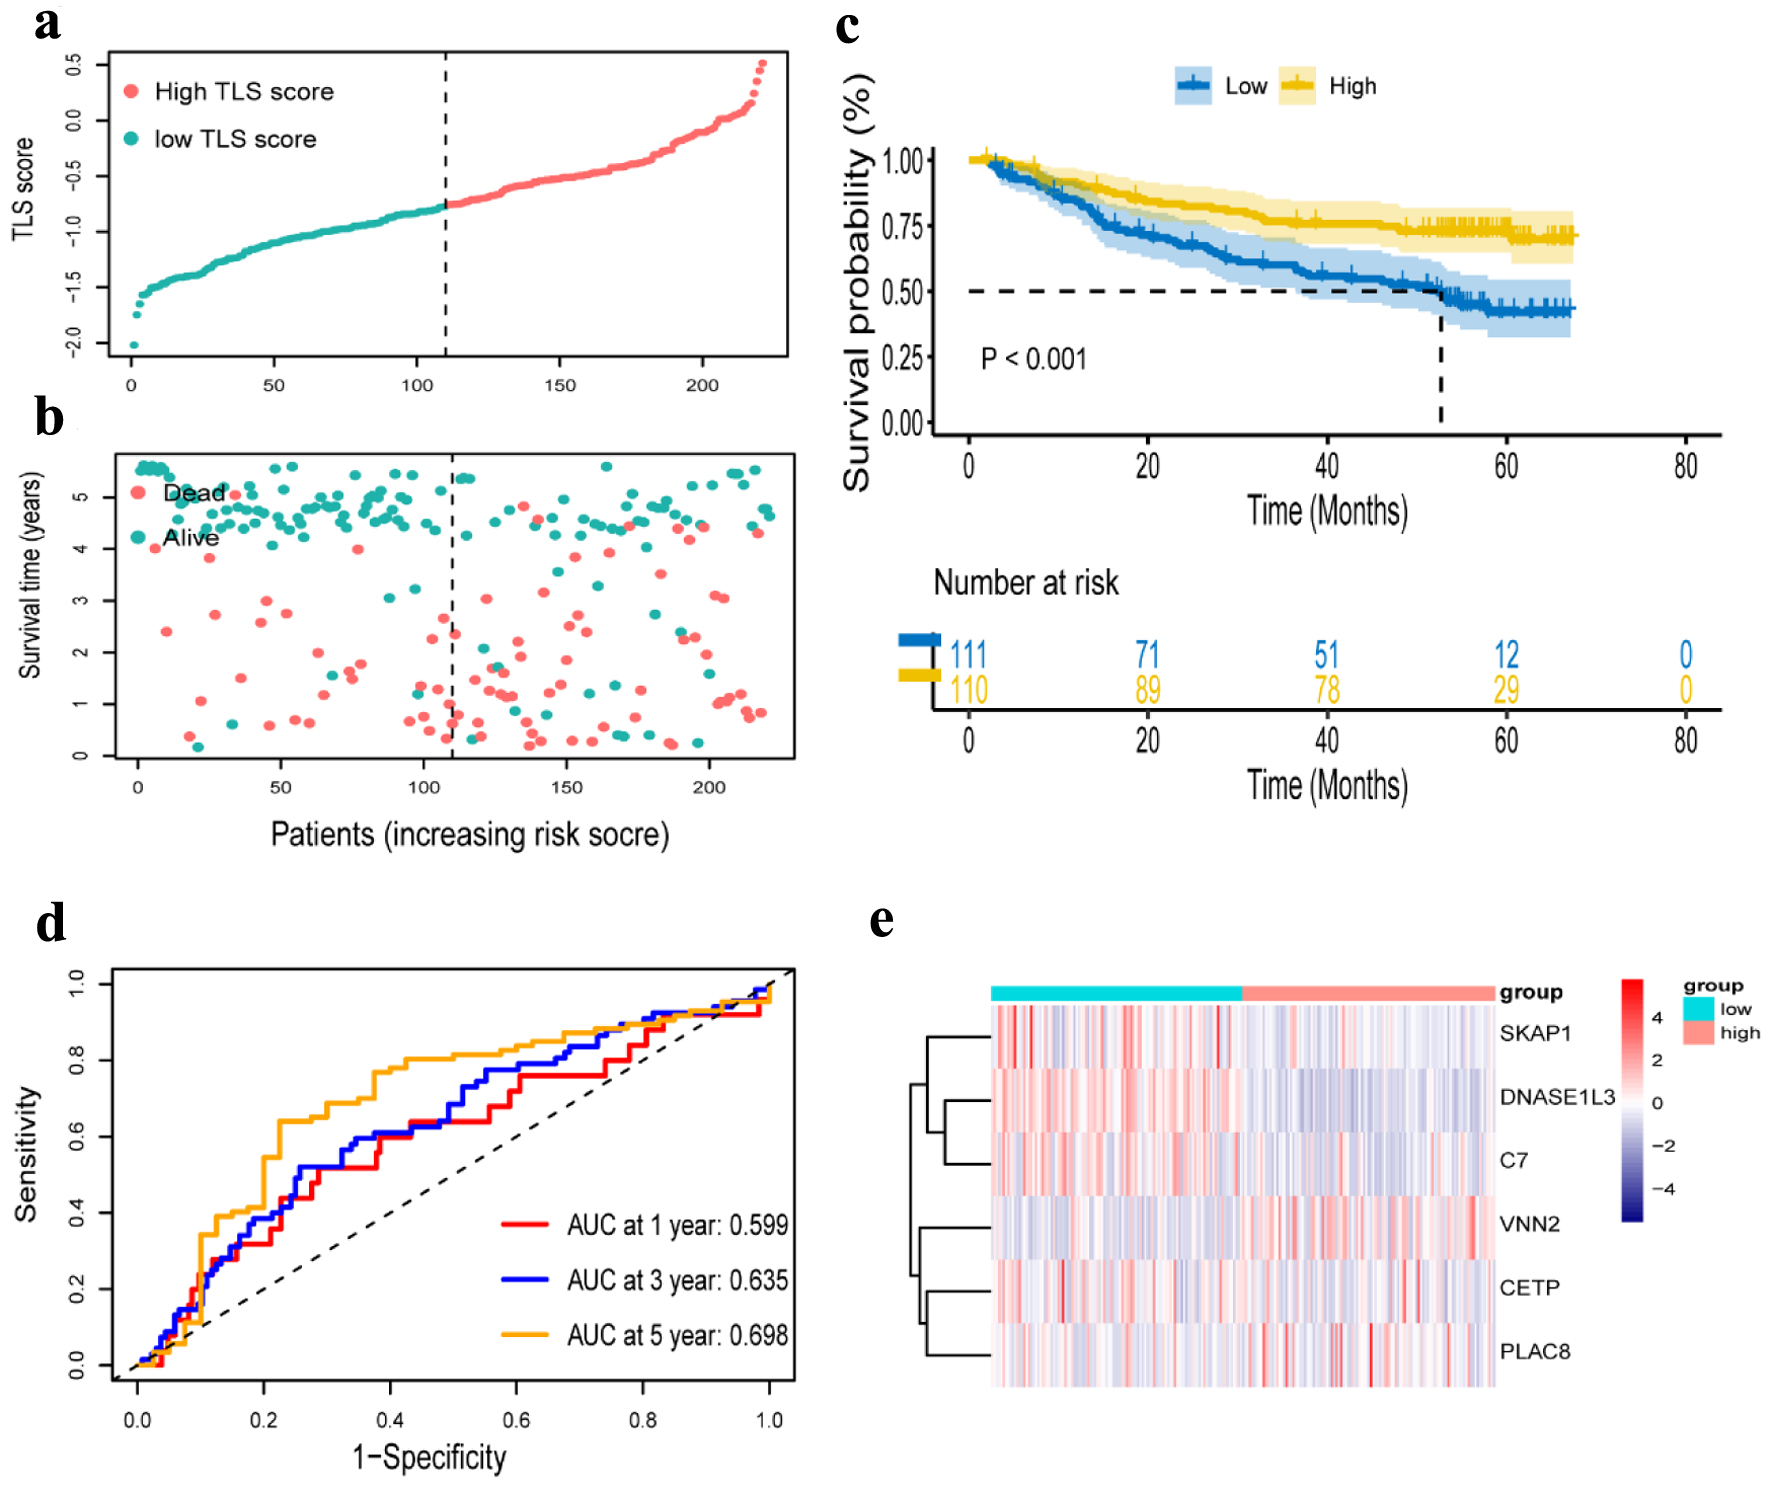
Figure 6. Verification of a risk prognostic model in GSE14520 cohort. (a) The patients were equally divided into two groups according to the threshold of the median risk score. Blue represents the low TLS score group. Red represents the high TLS score group. (b) Survival status of patients with HCC in high and low risk groups. Blue represents survival. Red represents death. (c) Kaplan-Meier curves showing the overall survival of patients in the high TLS score and low TLS score groups. (d) The predictive efficiency of the risk score was verified by the ROC curve. (e) Heatmap showing the expression of the six TLS-related genes. Blue represents the low TLS score group. Red represents the high TLS score group. TLS: tertiary lymphoid structures.
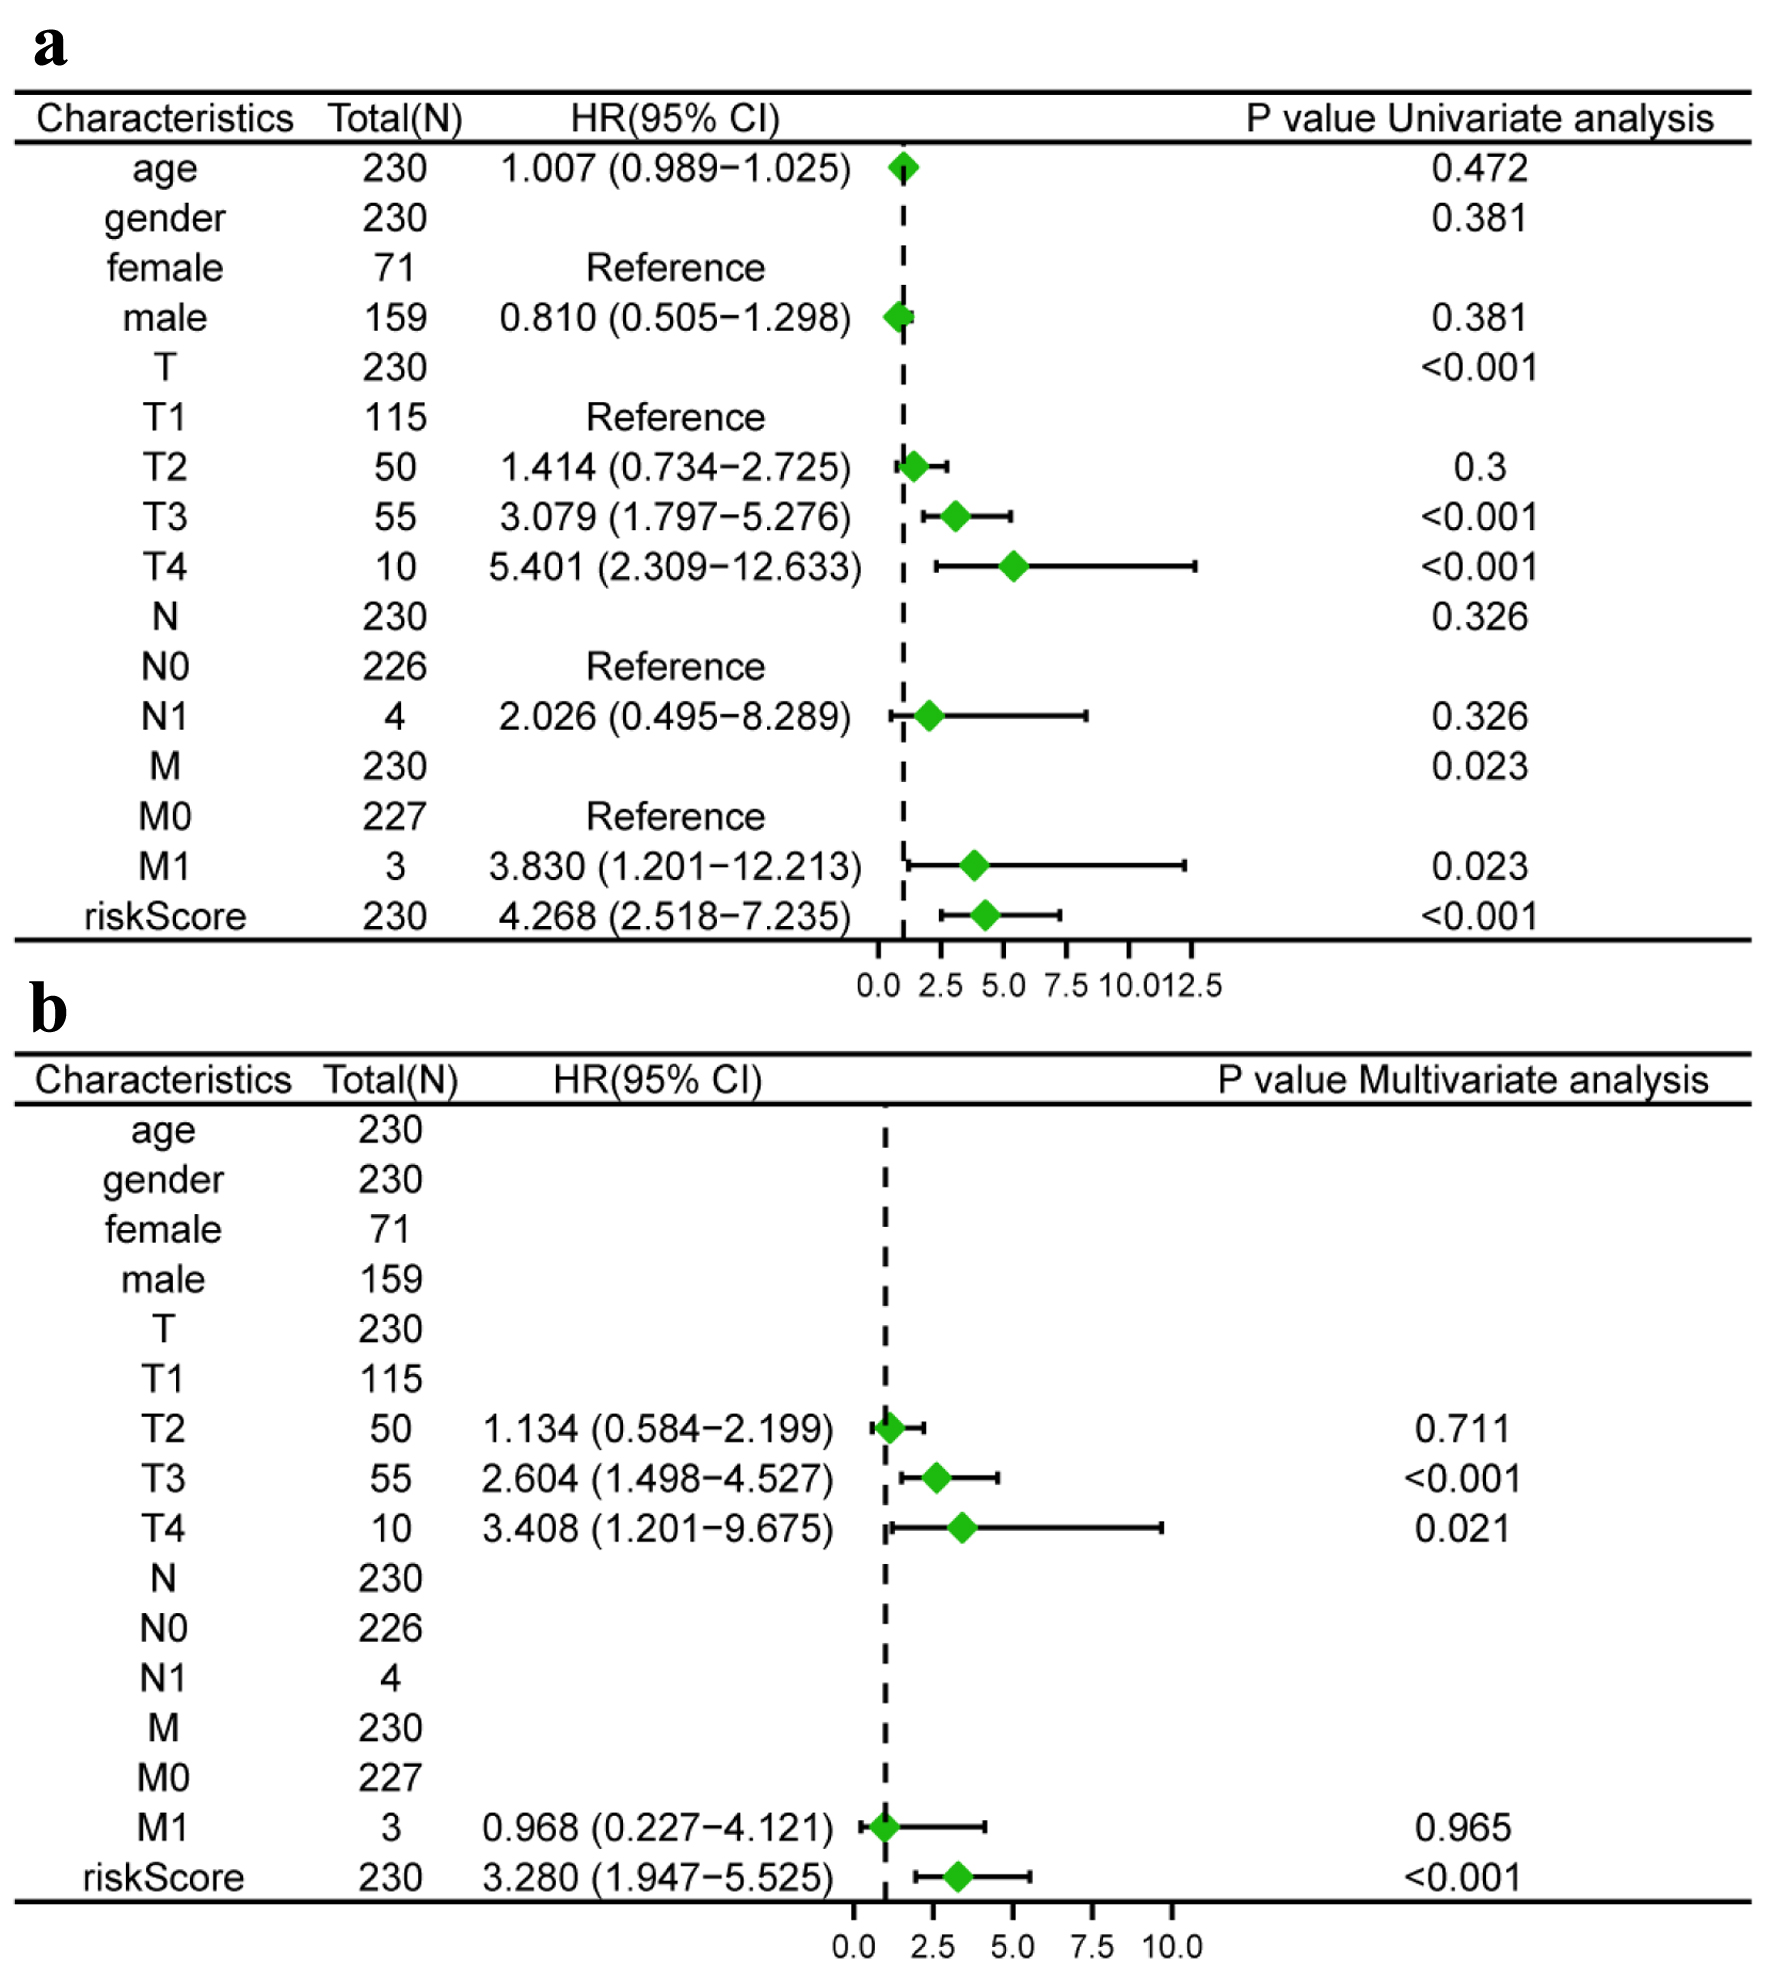
Figure 7. Risk model independent prognostic analysis. (a) Univariate independent prognosis Cox regression analysis of TLS score and indicated clinical characteristics. (b) Multivariate independent prognosis Cox regression analysis of TLS score and indicated clinical characteristics. TLS: tertiary lymphoid structures.
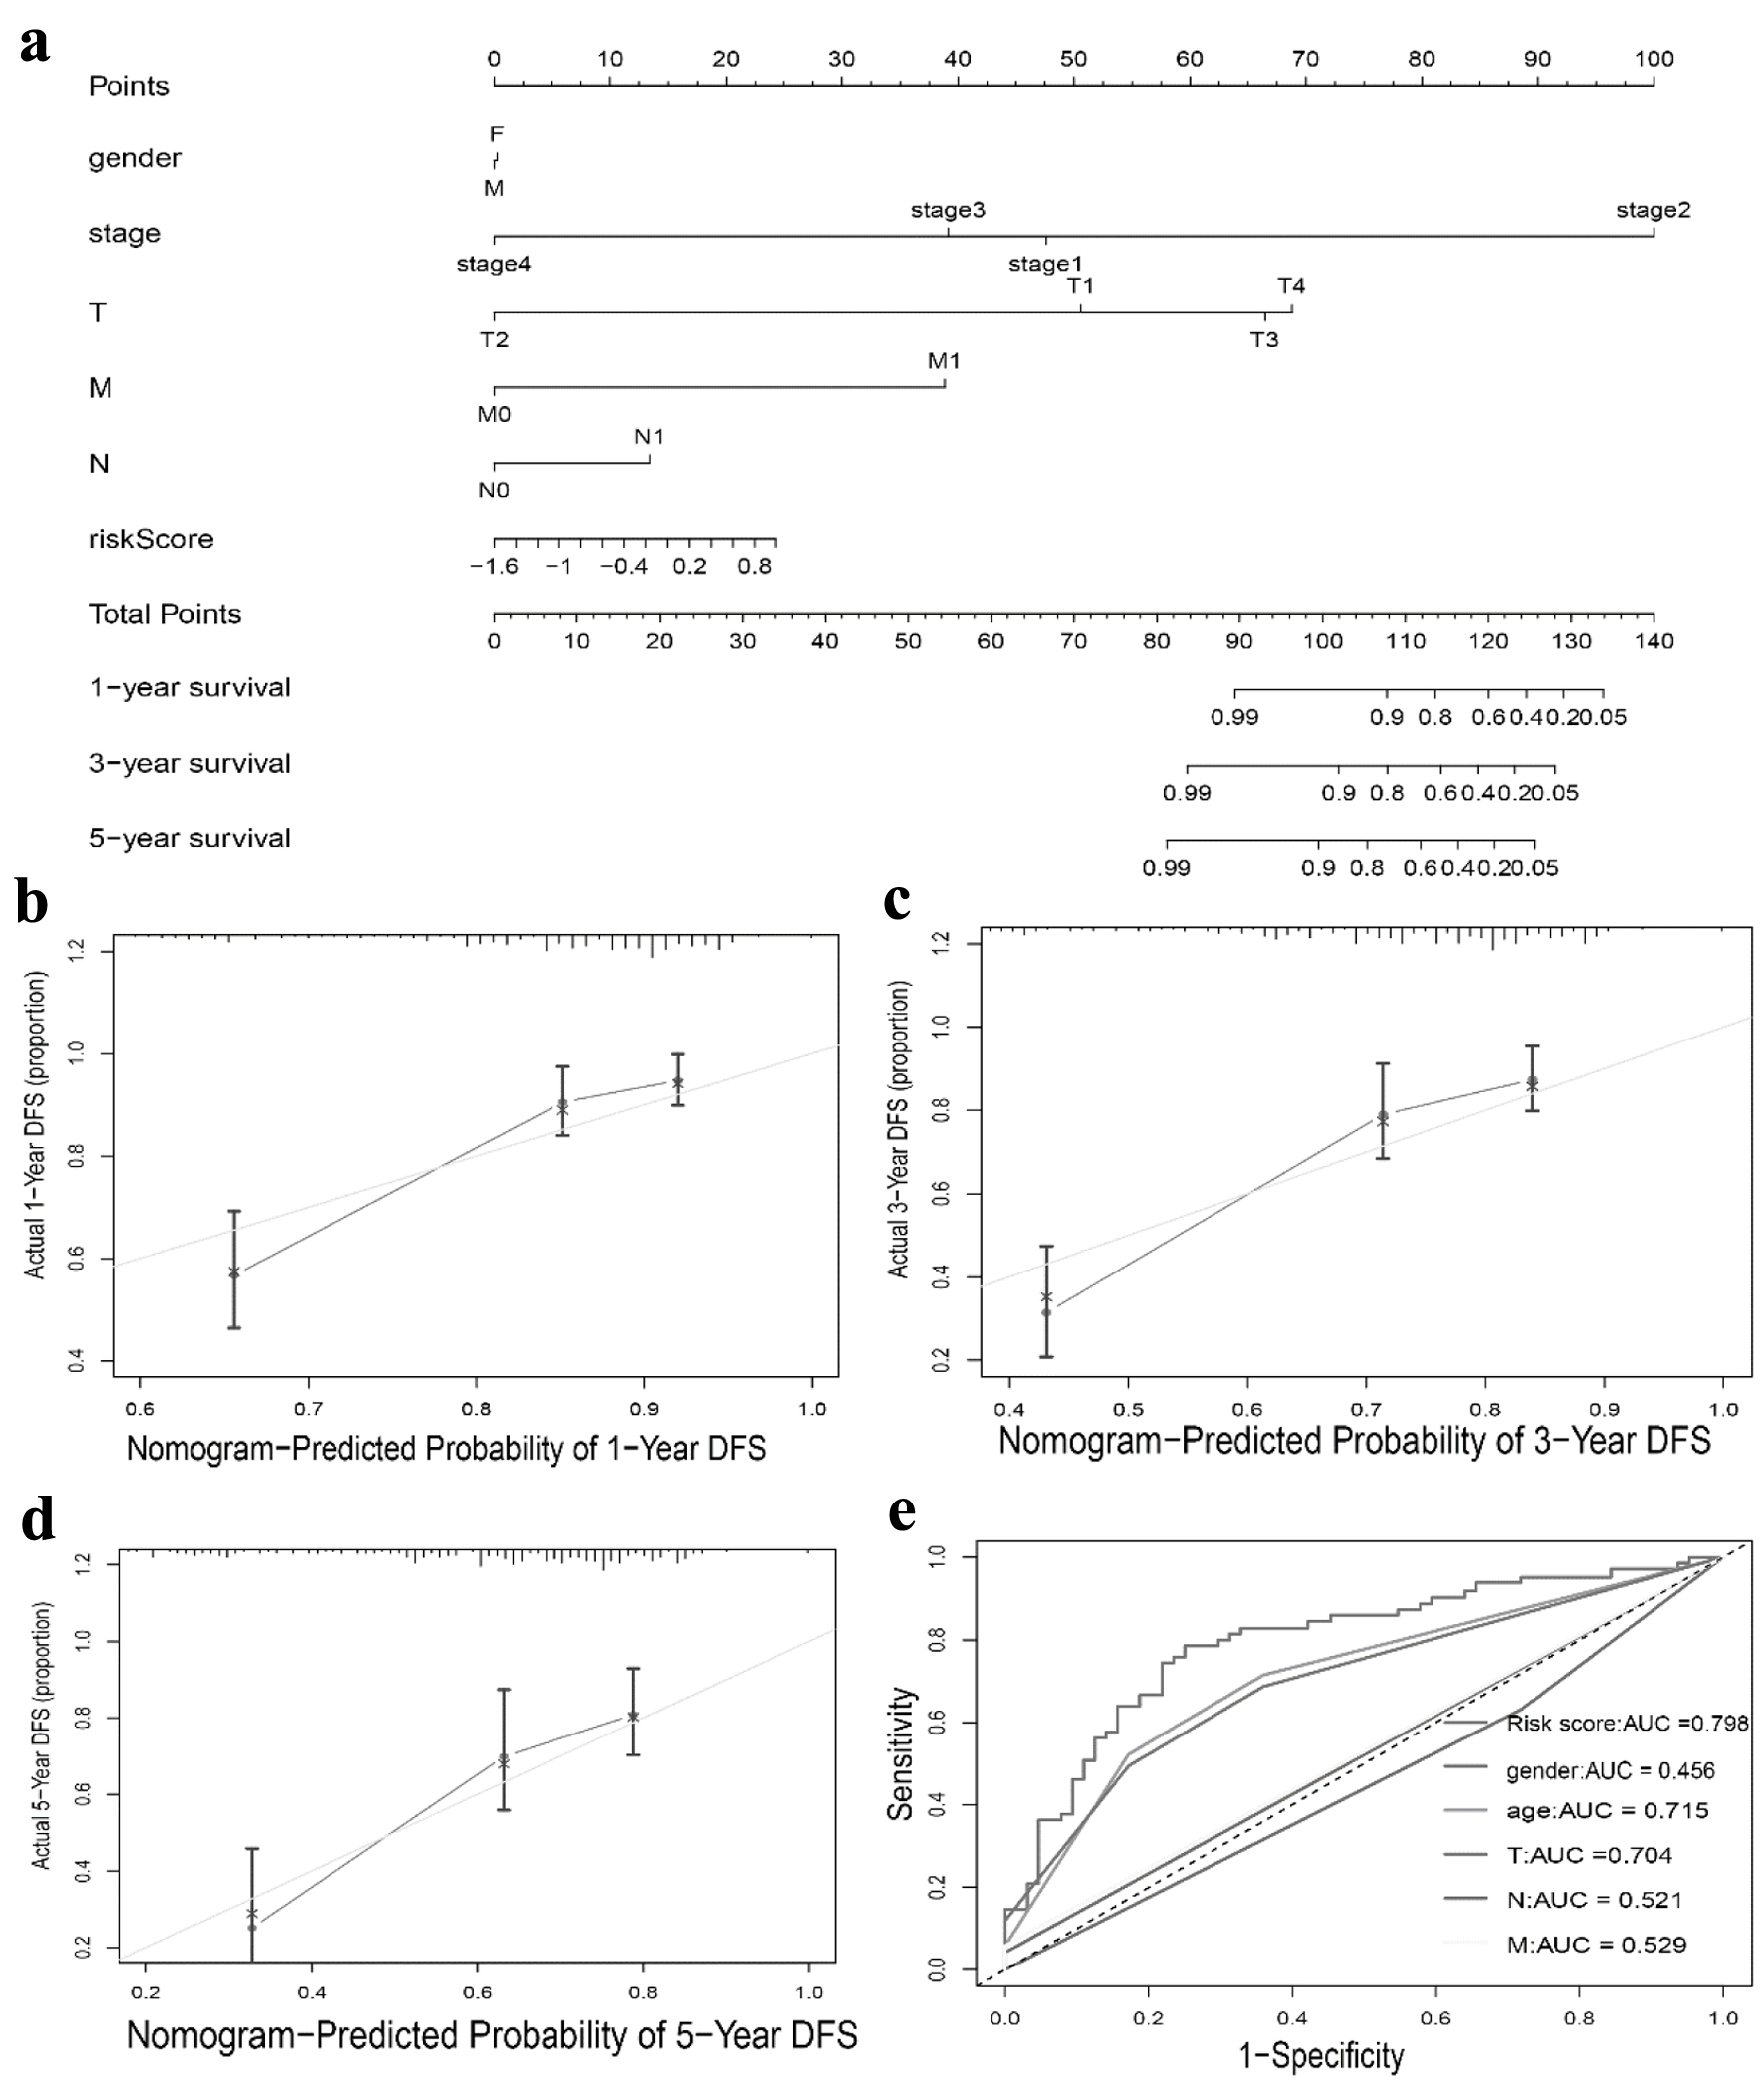
Figure 8. Nomogram to predict survival probability of hepatocellular carcinoma patients. (a) Nomogram combining TLS score with pathologic features. (b-d) Calibration plots for predicting 1 -, 3 -, 5-year OS of patients. (e) ROC curves for prediction of survival by the TLS score and other variables (age, gender, T stage, N stage, M stage). TLS: tertiary lymphoid structures.
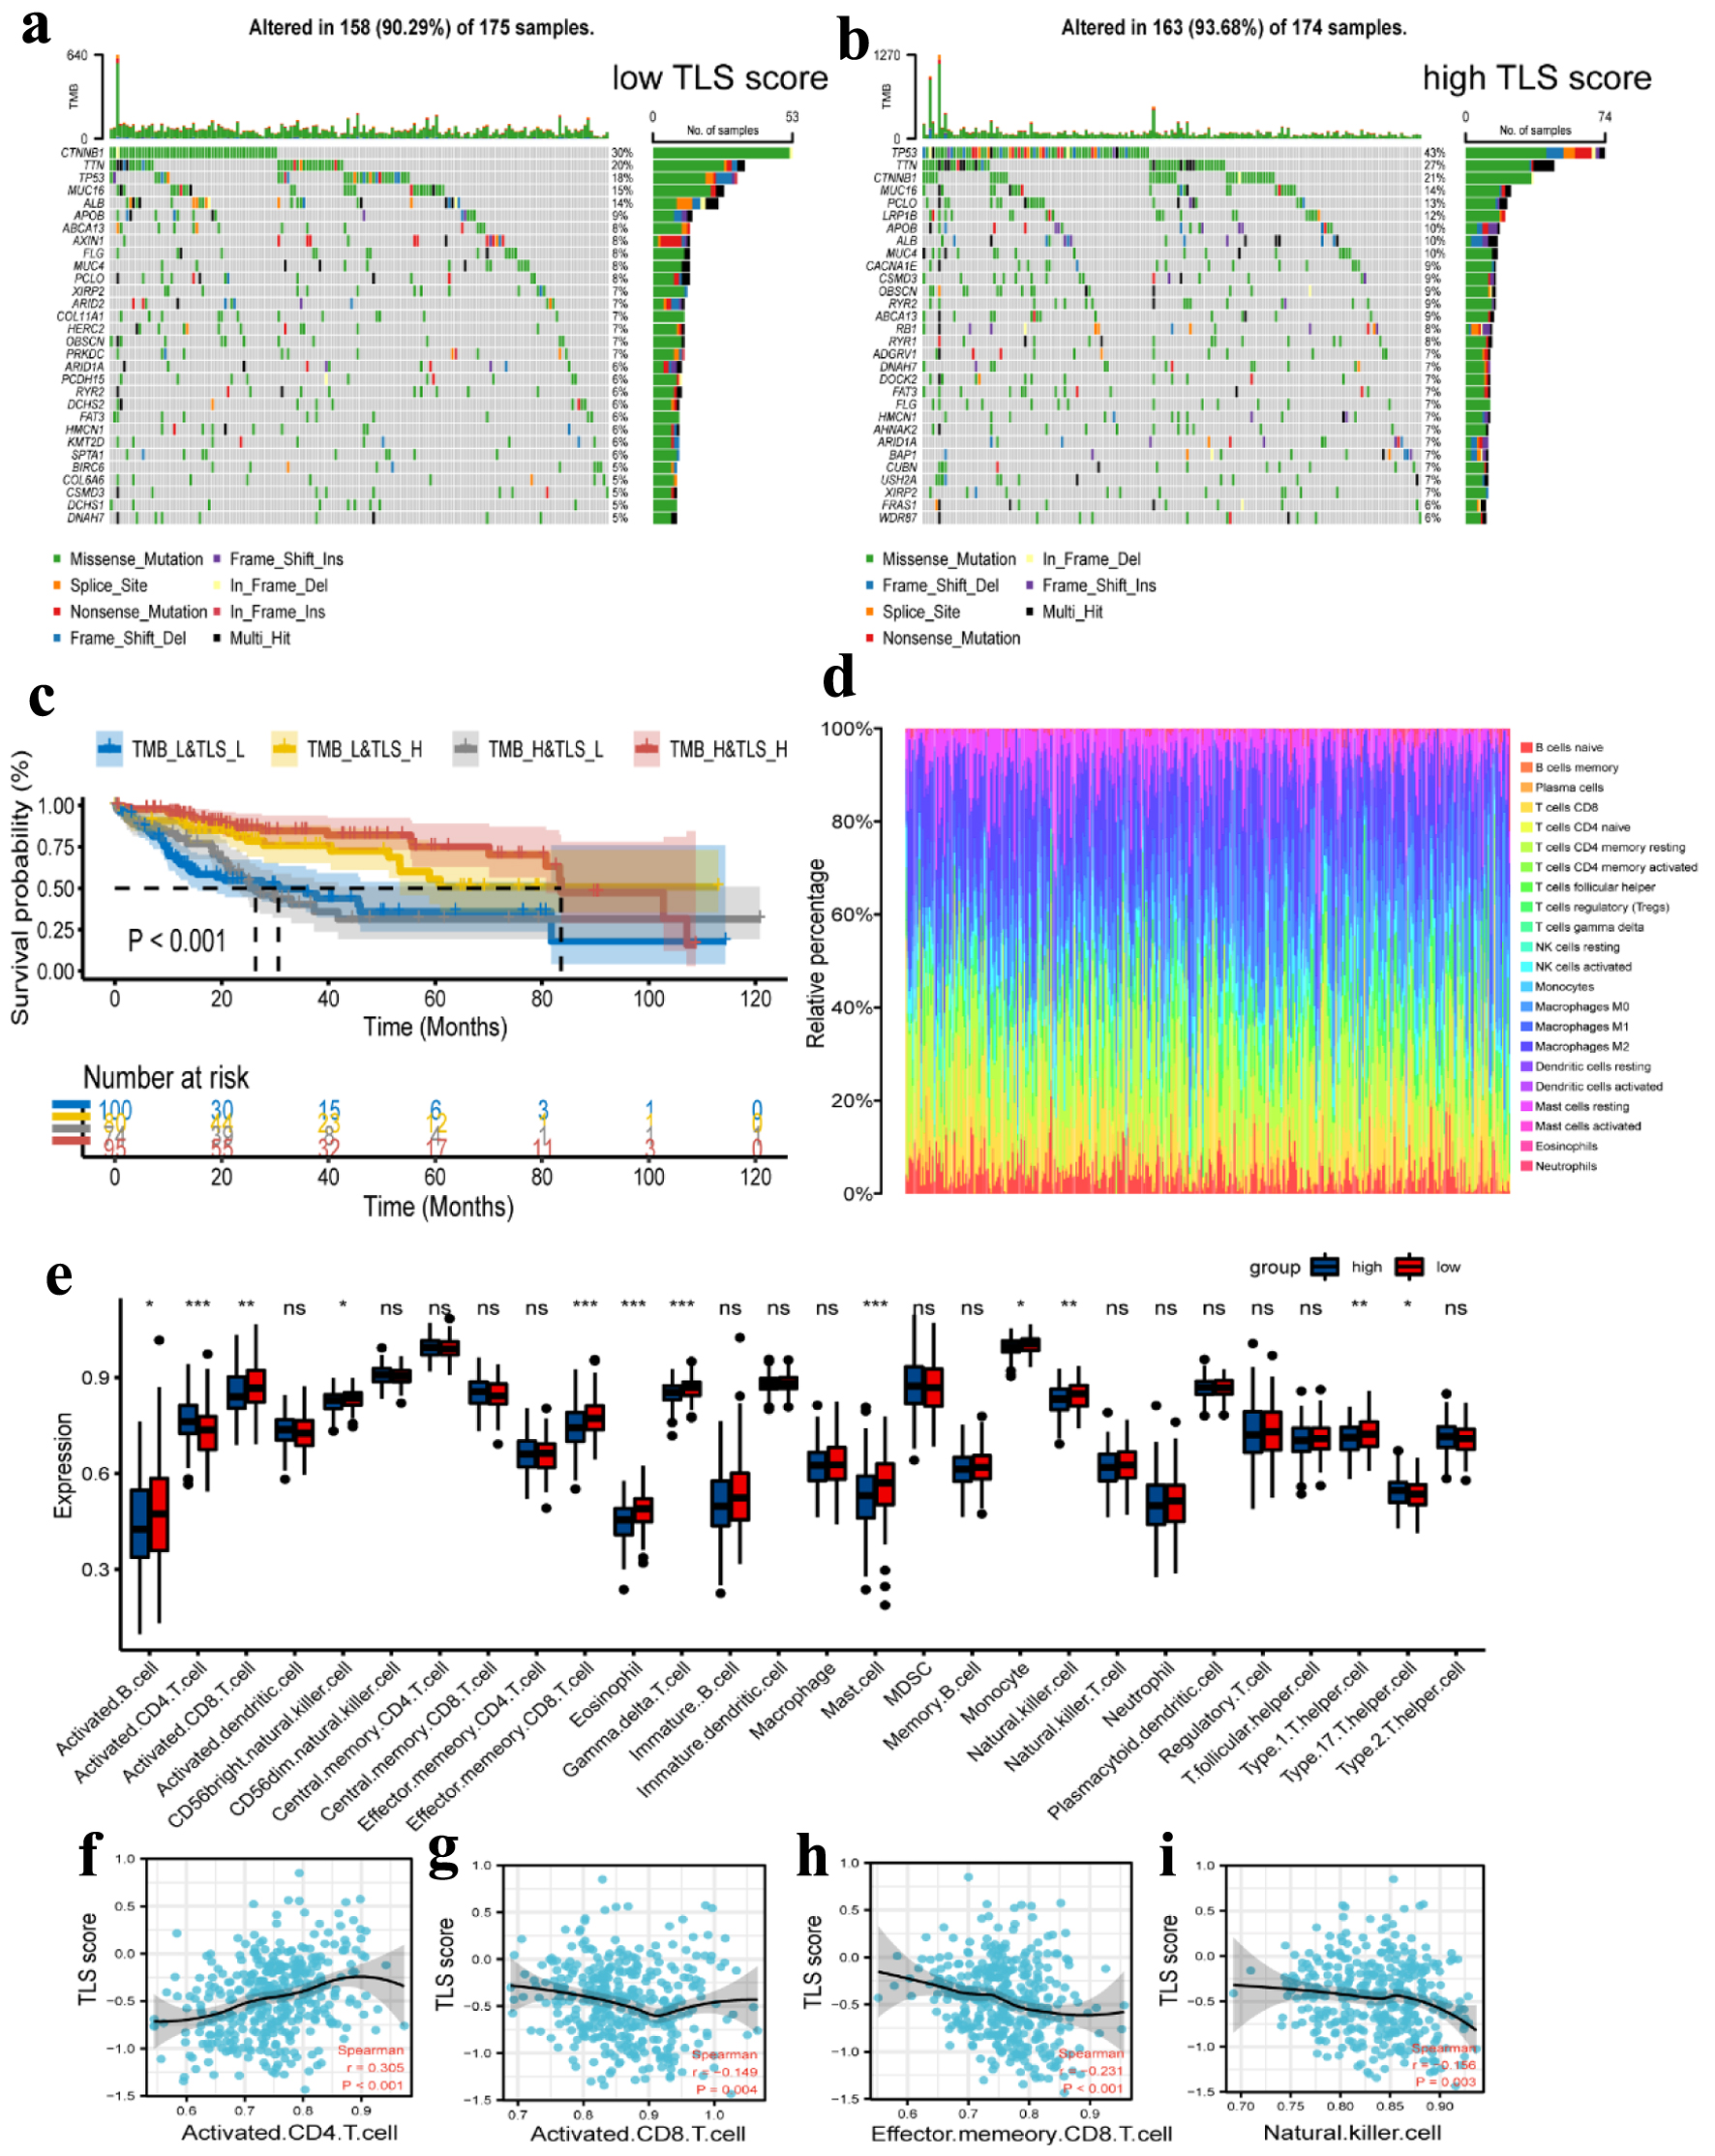
Figure 9. Tumor mutation analysis and immune cell infiltration analysis. (a, b) Waterfall plots of the mutated genes in the HCC patients from low TLS score (a) and high TLS score (b) subgroups. The mutation types of genes were marked by different colors. (c) Kaplan Meier curves showing the overall survival of patients in the TMB_L&TLS_L, TMB_L&TLS_H, TMB_H&TLS_L, and TMB_H&TLS_H groups. (d) Relative proportion of immune cell infiltration in high TLS score and low TLS score group. (e) Different expression of immune cell infiltration in high TLS score and low TLS score group. Red represents the high TLS score group. Blue represents the low TLS score group. (f-i) Correlation between activated CD4 T cell (f), activated CD8 T cell (g), effector memory CD8 T cell (h), and natural killer cell (i) and TLS score in HCC. TLS: tertiary lymphoid structures.
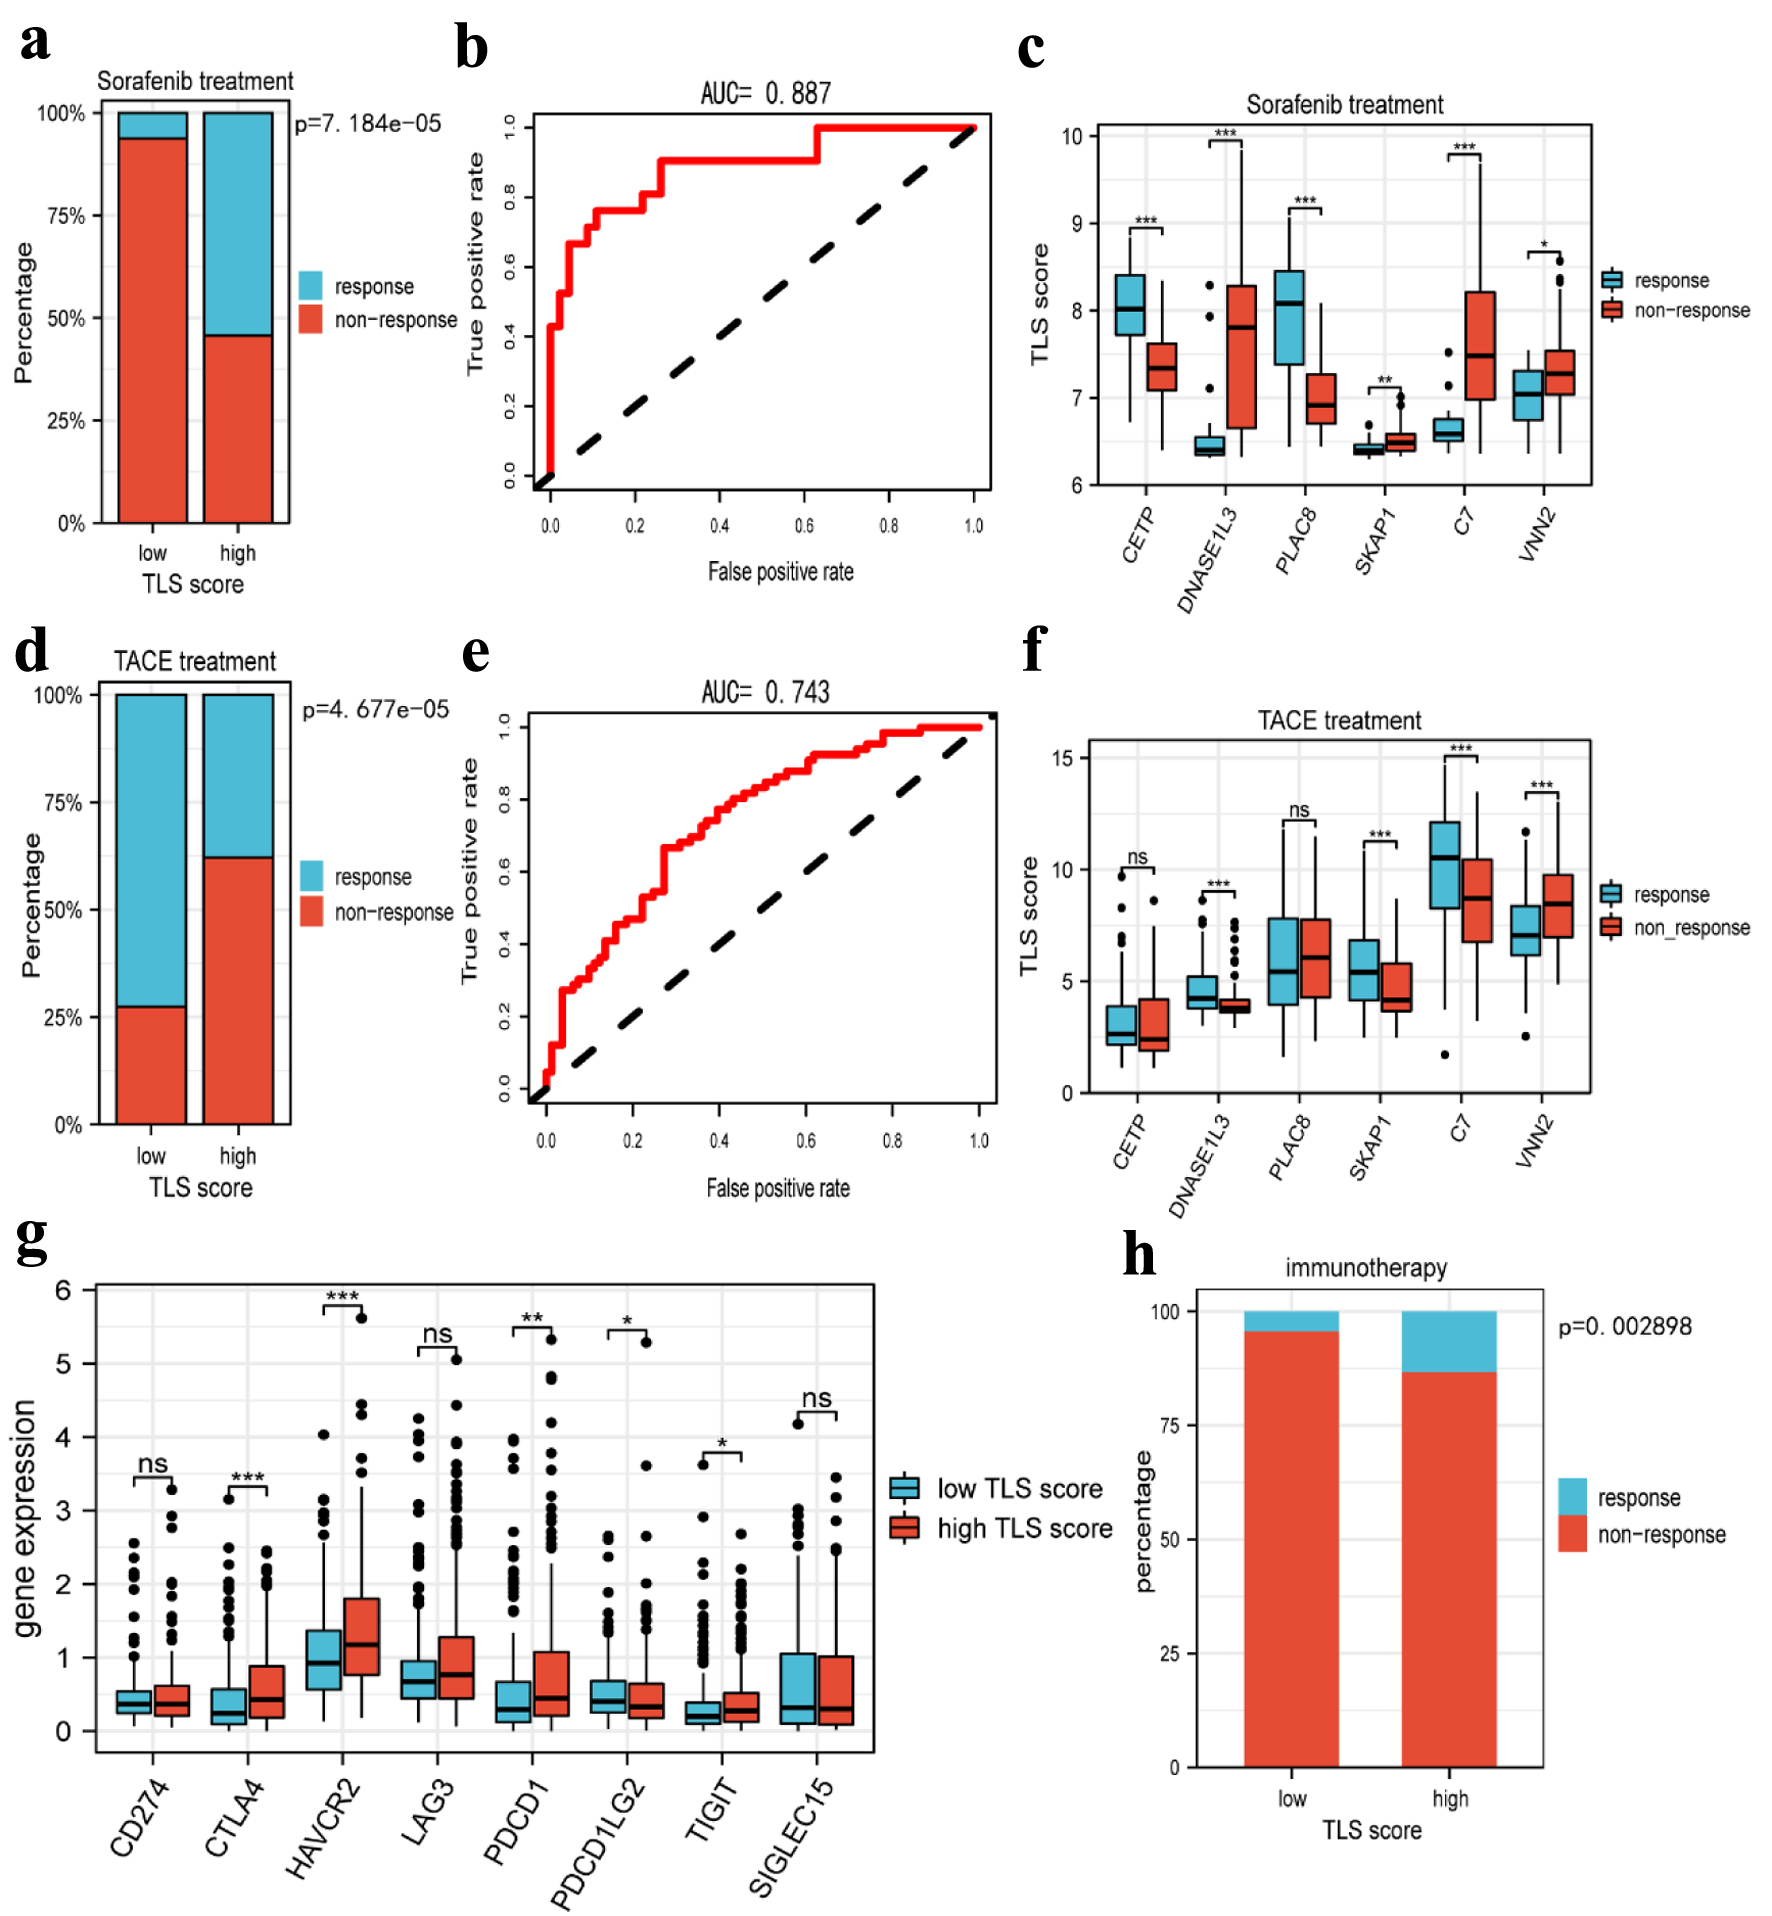
Figure 10. Prediction of tertiary lymphoid structures related TLS score in HCC therapy. (a) The histogram showing that the ratio of response to sorafenib between low and high TLS score group. (b) The AUC value of TLS score in predicting the efficiency of sorafenib in HCC patients. (c) The boxplot showing the expression of TLS-related genes in the responders and non-responders to sorafenib. (d) The histogram showing that the ratio of response to TACE between low and high TLS score group. (e) The AUC value of TLS score in predicting the efficiency of TACE in HCC patients. (f) The boxplot showing the expression of TLS-related genes in responders and non-responders to TACE. (g) Boxplots indicate the expression of immune checkpoints genes in high and low TLS score group. (h) The sensitivity of the two subtypes to immunotherapy in TCGA cohorts was predicted using the TIDE website. TLS: tertiary lymphoid structures; TACE: transcatheter arterial chemoembolization; TIDE: Tumor Immune Dysfunction and Exclusion.


