World Journal of Oncology, ISSN 1920-4531 print, 1920-454X online, Open Access
Article copyright, the authors; Journal compilation copyright, World J Oncol and Elmer Press Inc
Journal website https://www.wjon.org

Original Article

Volume 15, Number 5, October 2024, pages 792-800


Analysis of Pancreatic Cancer Genetic Risk Factors in a Multi-Ethnic Population Sample

Figure

Figure 1.
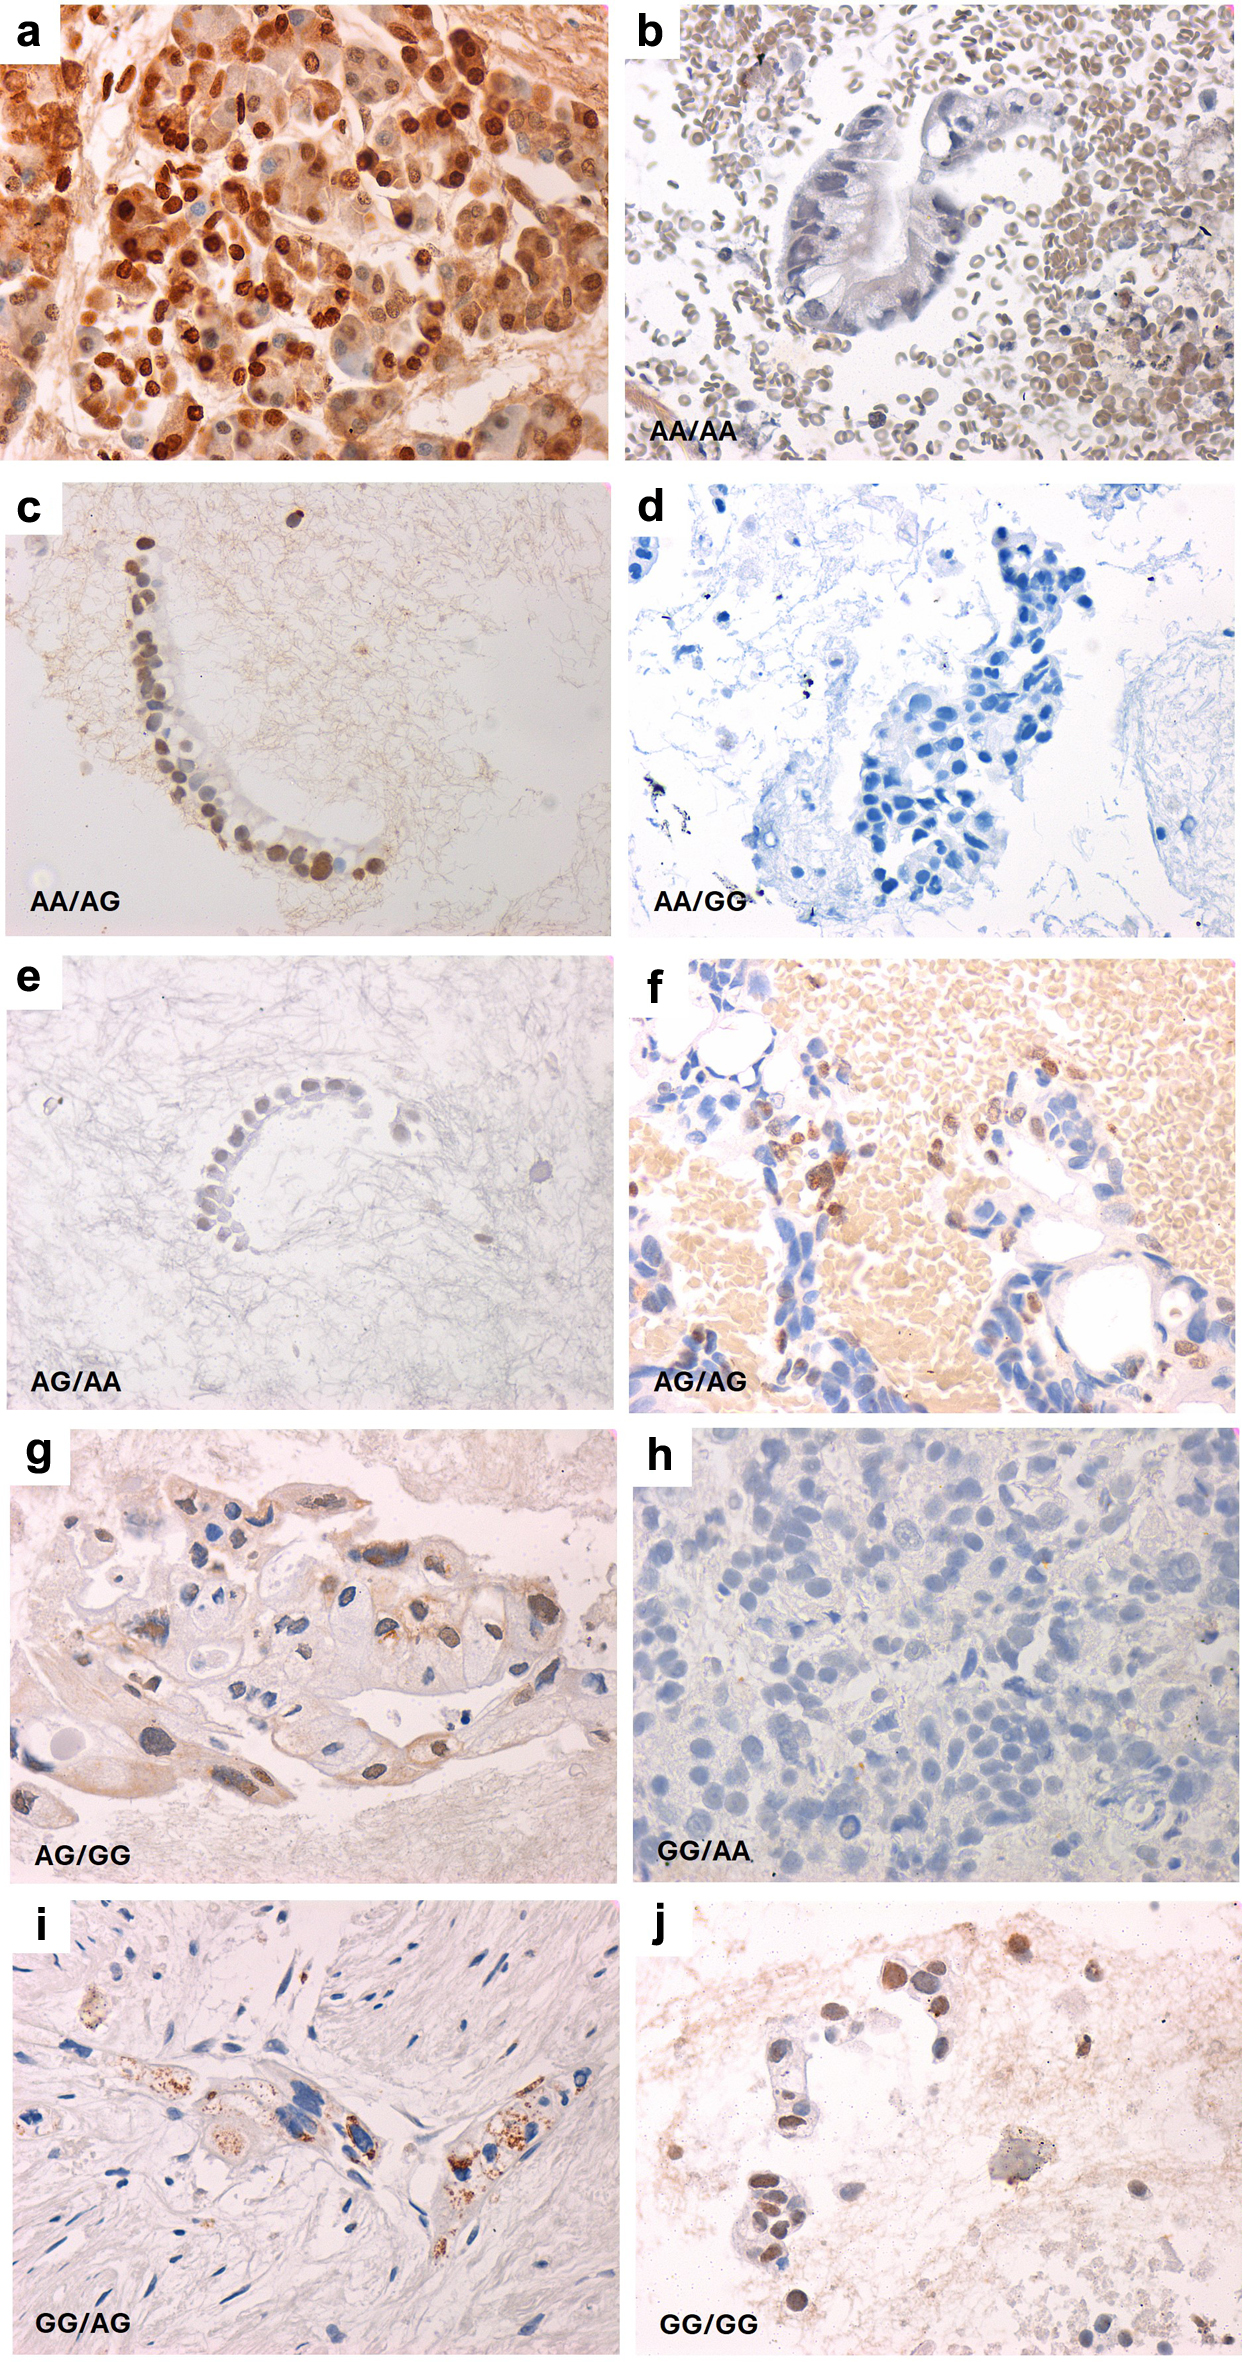
Figure 1. Representative images of VDR expression in pancreatic cancer according to VDR variants’ haplotype. VDR haplotypes are shown as rs2228570/rs731236. (a) Normal VDR expression in a healthy pancreatic specimen. (b-j) Representative images of pancreatic cancer cell block sections according to VDR haplotypes. All images were captured at × 400 magnification.

Tables

Table 1. Demographic and Clinical Characteristics of Pancreatic Cancer and Healthy Control Cohorts
 
CriteriaPancreatic cancer patients (n = 103)Healthy controls (n = 132)
Sex assigned at birth, n (%)
  Male69 (67)48 (36.4)
  Female34 (33)84 (63.6)
Age, mean ± standard deviation, years63.44 ± 1156.8 ± 16.87
Nationality, n (%)
  Kuwaiti49 (47.6)88 (66.7)
  Non-Kuwaiti54 (52.4)44 (33.3)
Cytological diagnosis, n (%)
  Adenocarcinoma101 (98)
  Adenocarcinoma foamy cell variant2 (2)
Tumor location, n (%)
  Head72 (70)
  Body14 (13.6)
  Tail13 (12.6)
  Uncinate4 (3.8)


Table 2. Allele and Genotype Frequencies of Six Variants Assessed in Pancreatic Cancer and Healthy Control Samples
 
VariantPancreatic cancer (n = 103)Healthy controls (n = 132)P-value
All frequencies are shown as percent (%). aRisk alleles. *P < 0.05.
ABO rs505922 (Ca>T)
  Allele (C/T) frequency43.2/56.833.0/67.00.027*
  Genotype
    CC21 (20.4)12 (9.1)
    CT47 (45.6)63 (47.7)
    TT35 (34.0)57 (43.2)0.037*
BCAR1 rs7190458 (G>Aa)
  Allele (G/A) frequency95.15/4.8595.8/4.2> 0.999
  Genotype
    GG96 (93.2)122 (92.4)
    GA4 (3.9)9 (6.8)
    AA2 (1.9)1 (0.8)0.463
HNF1B rs4795218 (A>Ga)
  Allele (A/G) frequency30.1/69.923.5/76.50.114
  Genotype
    AA11 (10.7)11 (8.3)
    AG40 (38.8)40 (30.3)
    GG52 (50.5)81 (61.4)0.248
LINC-PINT rs6971499 (Ta>C)
  Allele (T/C) frequency91.26/8.7487.9/12.10.291
  Genotype
    TT86 (83.5)101 (76.5)
    TC16 (15.5)30 (22.7)
    CC1 (1.0)1 (0.8)0.384
VDR rs2228570 (A>G)
  Allele (A/G) frequency30.6/69.421.2/78.80.024*
  Genotype
    AA15 (14.5)8 (6.1)
    AG33 (32.0)40 (30.3)
    GG55 (53.4)84 (63.6)0.068
VDR rs731236 (A>G)
  Allele (A/G) frequency64.6/35.456.4/43.60.087
  Genotype
    AA46 (44.7)48 (36.4)
    AG41 (39.8)53 (40.1)
    GG16 (15.5)31 (23.5)0.243


Table 3. Unweighted and Weighted PRS Models’ Test Performance Metrics With and Without Age and Sex Inclusion
 
CriteriauwPRSwPRSuwPRS with sex and agewPRS with sex and age
CI: confidence interval; PRS: polygenic risk score; uw: unweighted; w: weighted.
Nagelkerke R20.0830.0490.3450.327
Accuracy (%)62.860.769.770.5
Sensitivity (%)32.427.564.767.6
Specificity (%)86.486.473.572.7
Positive predictive value (%)64.760.865.365.7
Negative predictive value (%)62.360.672.974.4
Odds ratio (Expβ (95% CI))1.54 (1.23 - 1.94)3.35 (1.45 - 7.73)1.52 (1.17 - 1.96)3.42 (1.33 - 8.8)
P-value< 0.0010.0050.0010.011