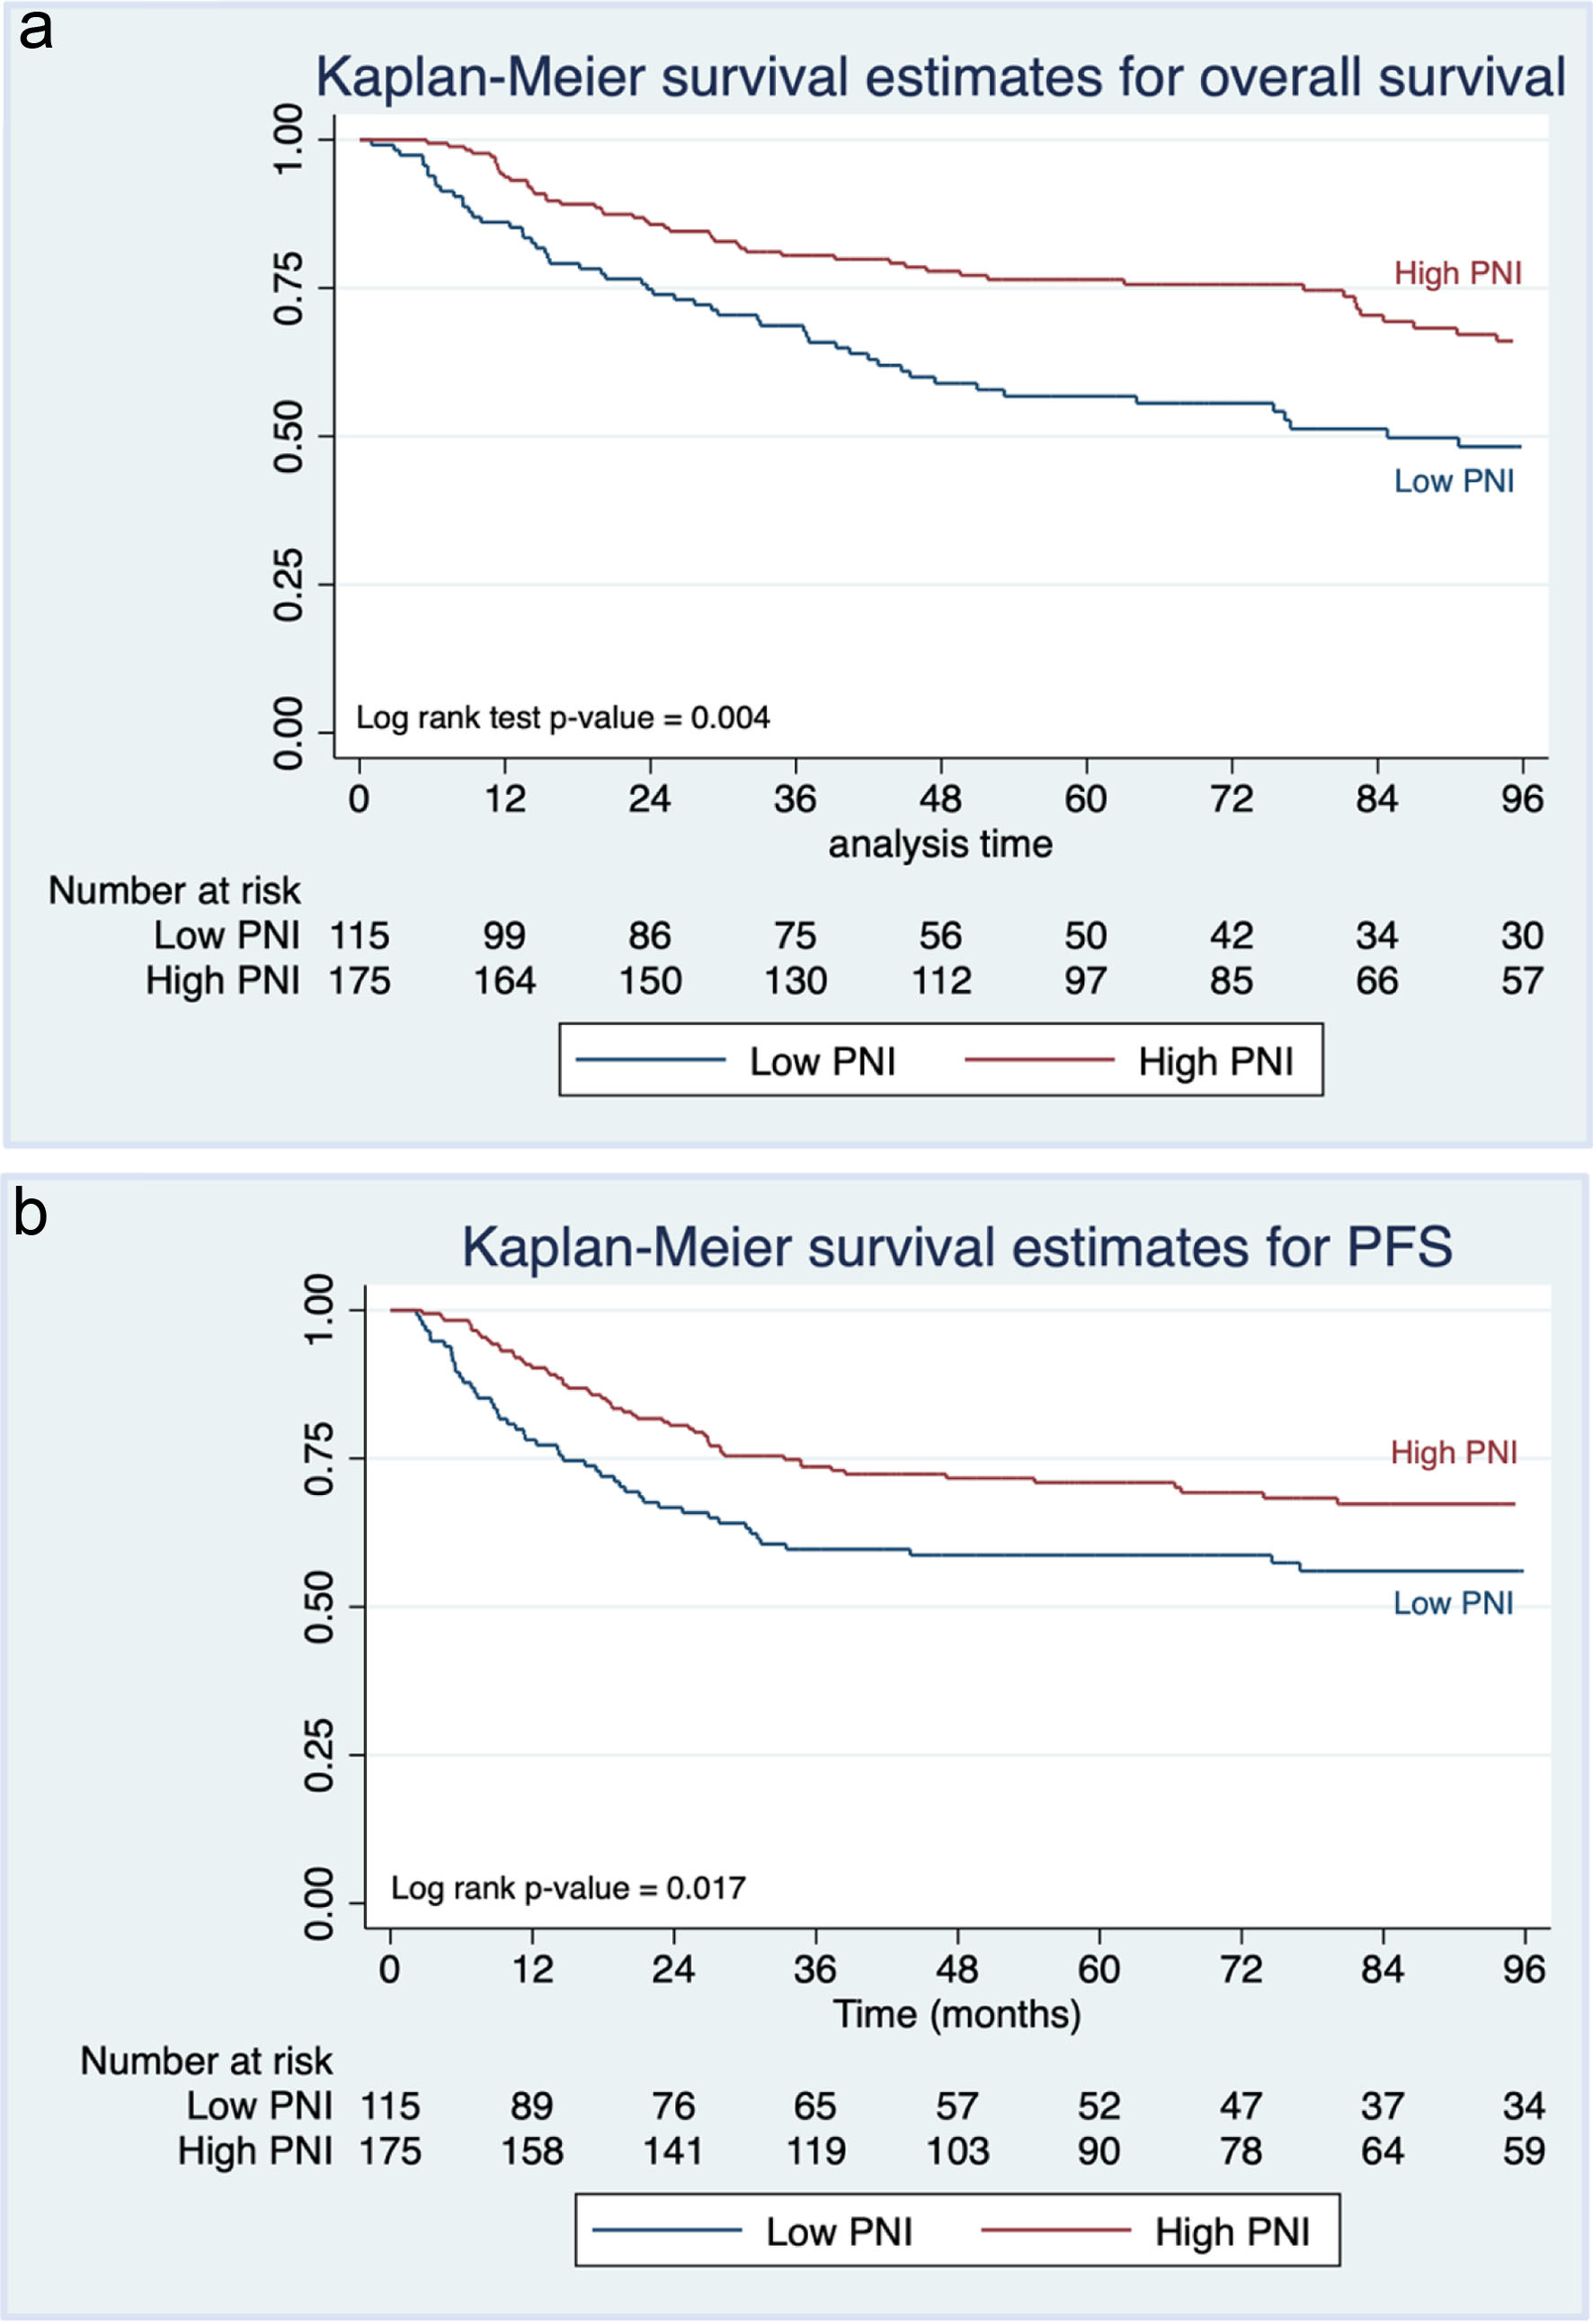
Figure 1. Kaplan-Meier curves of (a) overall survival and (b) progression-free survival of epithelial ovarian clear cell cancer patients stratified by preoperative prognostic nutritional index (PPNI).
| World Journal of Oncology, ISSN 1920-4531 print, 1920-454X online, Open Access |
| Article copyright, the authors; Journal compilation copyright, World J Oncol and Elmer Press Inc |
| Journal website https://www.wjon.org |
Original Article
Volume 000, Number 000, October 2024, pages 000-000
The Association of Preoperative Prognostic Nutritional Index With Survival Outcome in Ovarian Clear Cell Cancer
Figures


Tables
| Variables | Total (n = 290) | Low PPNI group (n = 115) | High PPNI group (n = 175) | P-value |
|---|---|---|---|---|
| Low PPNI is defined as PPNI level less than 50; high PPNI is defined as PPNI level greater than or equal to 50. *Statistically significance (P < 0.05). BMI: body mass index; CA125: cancer antigen 125; EOC-CC: epithelial ovarian clear cell cancer; FIGO: International Federation of Gynecology and Obstetrics; PPNI: preoperative prognostic nutritional index; SD: standard deviation; WBC: white blood cell. | ||||
| Age (years), mean ± SD | 53.3 ± 9.4 | 53.7 ± 9.9 | 53.0 ± 9.0 | 0.552 |
| Menopausal status, n (%) | 0.811 | |||
| Pre-menopause | 101 (34.8) | 41 (35.6) | 60 (34.3) | |
| Post-menopause | 189 (65.2) | 74 (64.4) | 115 (65.7) | |
| BMI, n (%) | 0.042* | |||
| < 25 kg/m2 | 189 (65.2) | 83 (72.2) | 106 (60.6) | |
| ≥ 25 kg/m2 | 101 (34.8) | 32 (27.8) | 69 (39.4) | |
| Presence of underlying disease, n (%) | 53 (18.3) | 23 (20.0) | 30 (17.1) | 0.538 |
| Presence of diabetic mellitus, n (%) | 18 (6.2) | 8 (7.0) | 10 (5.7) | 0.668 |
| Presence of hypertension, n (%) | 39 (13.4) | 17 (14.8) | 22 (12.6) | 0.589 |
| CA125, n (%) | 0.003* | |||
| < 35 U/mL | 72 (24.8) | 18 (15.6) | 54 (30.9) | |
| ≥ 35 U/mL | 218 (75.2) | 97 (84.4) | 121 (69.1) | |
| Albumin (g/dL), mean ± SD | 4.1 ± 0.5 | 3.6 ± 0.6 | 4.4 ± 2.8 | < 0.001* |
| WBC (cells/mm3), median (min. - max.) | 7,635 (3,000 - 16,500) | 7,700 (2,300 - 17,400) | 7,500 (3,700 - 15,200) | 0.452 |
| Lymphocyte (%), median (min. - max.) | 26.7 (3.9 - 65.0) | 19.0 (3.5 - 72.0) | 30.6 (12.7 - 63.7) | < 0.001* |
| Hemoglobin (g/dL), mean ± SD | 11.1 ± 1.4 | 10.7 ± 1.5 | 11.4 ± 1.4 | < 0.001* |
| Platelet count (× 103 cells/mm3), mean ± SD | 358.0 ± 138.9 | 395.2 ± 163.5 | 333.6 ± 114.2 | < 0.001* |
| FIGO 2014 staging, n (%) | < 0.001* | |||
| Early stage (I-II) | 222 (76.6) | 73 (63.5) | 149 (85.1) | |
| Advance stage (III-IV) | 68 (23.4) | 42 (36.5) | 26 (14.9) | |
| Surgery, n (%) | 0.013* | |||
| Incomplete surgical staging | 64 (22.1) | 34 (29.6) | 30 (17.1) | |
| Complete surgical staging | 226 (77.9) | 81 (70.4) | 145 (82.9) | |
| Optimal surgery, n (%) | < 0.001* | |||
| No | 28 (9.7) | 21 (18.3) | 7 (4.0) | |
| Yes | 262 (90.3) | 94 (81.7) | 168 (96.0) | |
| Residual disease, n (%) | < 0.001* | |||
| No | 262 (90.3) | 92 (80.0) | 170 (97.1) | |
| Yes | 28 (9.7) | 23 (20.0) | 5 (2.9) | |
| Ascites cytology, n (%) | < 0.001* | |||
| Negative | 224 (77.2) | 73 (63.5) | 151 (86.3) | |
| Positive | 66 (22.8) | 42 (36.5) | 24 (13.7) | |
| Adjuvant chemotherapy, n (%) | 0.650 | |||
| No | 4 (1.4) | 2 (1.7) | 2 (1.1) | |
| Paclitaxel + carboplatin | 286 (98.6) | 113 (98.3) | 173 (98.9) | |
| Cycles of chemotherapy, n (%) | 0.096 | |||
| ≤ 3 | 17 (5.9) | 10 (8.7) | 7 (4.0) | |
| > 3 | 273 (94.1) | 105 (91.3) | 168 (96.0) | |
| Variables | Total (n = 290) | Low PPNI group (n = 115) | High PPNI group (n = 175) | P-value |
|---|---|---|---|---|
| Low PPNI is defined as PPNI level less than 50; high PPNI is defined as PPNI level greater than or equal to 50. *Statistically significance (P < 0.05). EOC-CC: epithelial ovarian clear cell cancer; PPNI: preoperative prognostic nutritional index. | ||||
| Recurrence, n (%) | 0.041* | |||
| No | 187 (64.5) | 66 (57.4) | 121 (69.1) | |
| Yes | 103 (35.5) | 49 (42.6) | 54 (30.9) | |
| Site of recurrence, n (%) | 0.089 | |||
| Locoregional | 70 (68.0) | 38 (76.0) | 32 (60.4) | |
| Distant | 33 (32.0) | 12 (24.0) | 21 (39.6) | |
| Death, n (%) | 0.001* | |||
| No | 181 (62.4) | 58 (50.4) | 123 (70.3) | |
| Yes | 109 (37.6) | 57 (49.6) | 52 (29.7) | |
| Cause of death, n (%) | 0.192 | |||
| Non-cancer | 31 (28.4) | 12 (22.6) | 19 (33.9) | |
| Cancer | 78 (71.6) | 41 (77.4) | 37 (66.1) | |
| Survival rates | Total patients | Low PPNI group | High PPNI group |
|---|---|---|---|
| % (95% CI) | % (95% CI) | % (95% CI) | |
| *Adjusted for BMI, CA125, albumin, lymphocyte, hemoglobin, platelet, stage of cancer, optimal surgery, and ascites cytology. CI: confidence interval; EOC-CC: epithelial ovarian clear cell cancer; OS: overall survival; PFS: progression-free survival; PPNI: preoperative prognostic nutritional index. | |||
| 5-year OS | 68.6 (62.8 - 73.7) | 56.8 (46.9 - 65.5) | 76.4 (69.2 - 82.2) |
| 5-year PFS | 66.1 (60.3 - 71.3) | 58.7 (49.1 - 67.1) | 71.0 (63.5 - 77.2) |
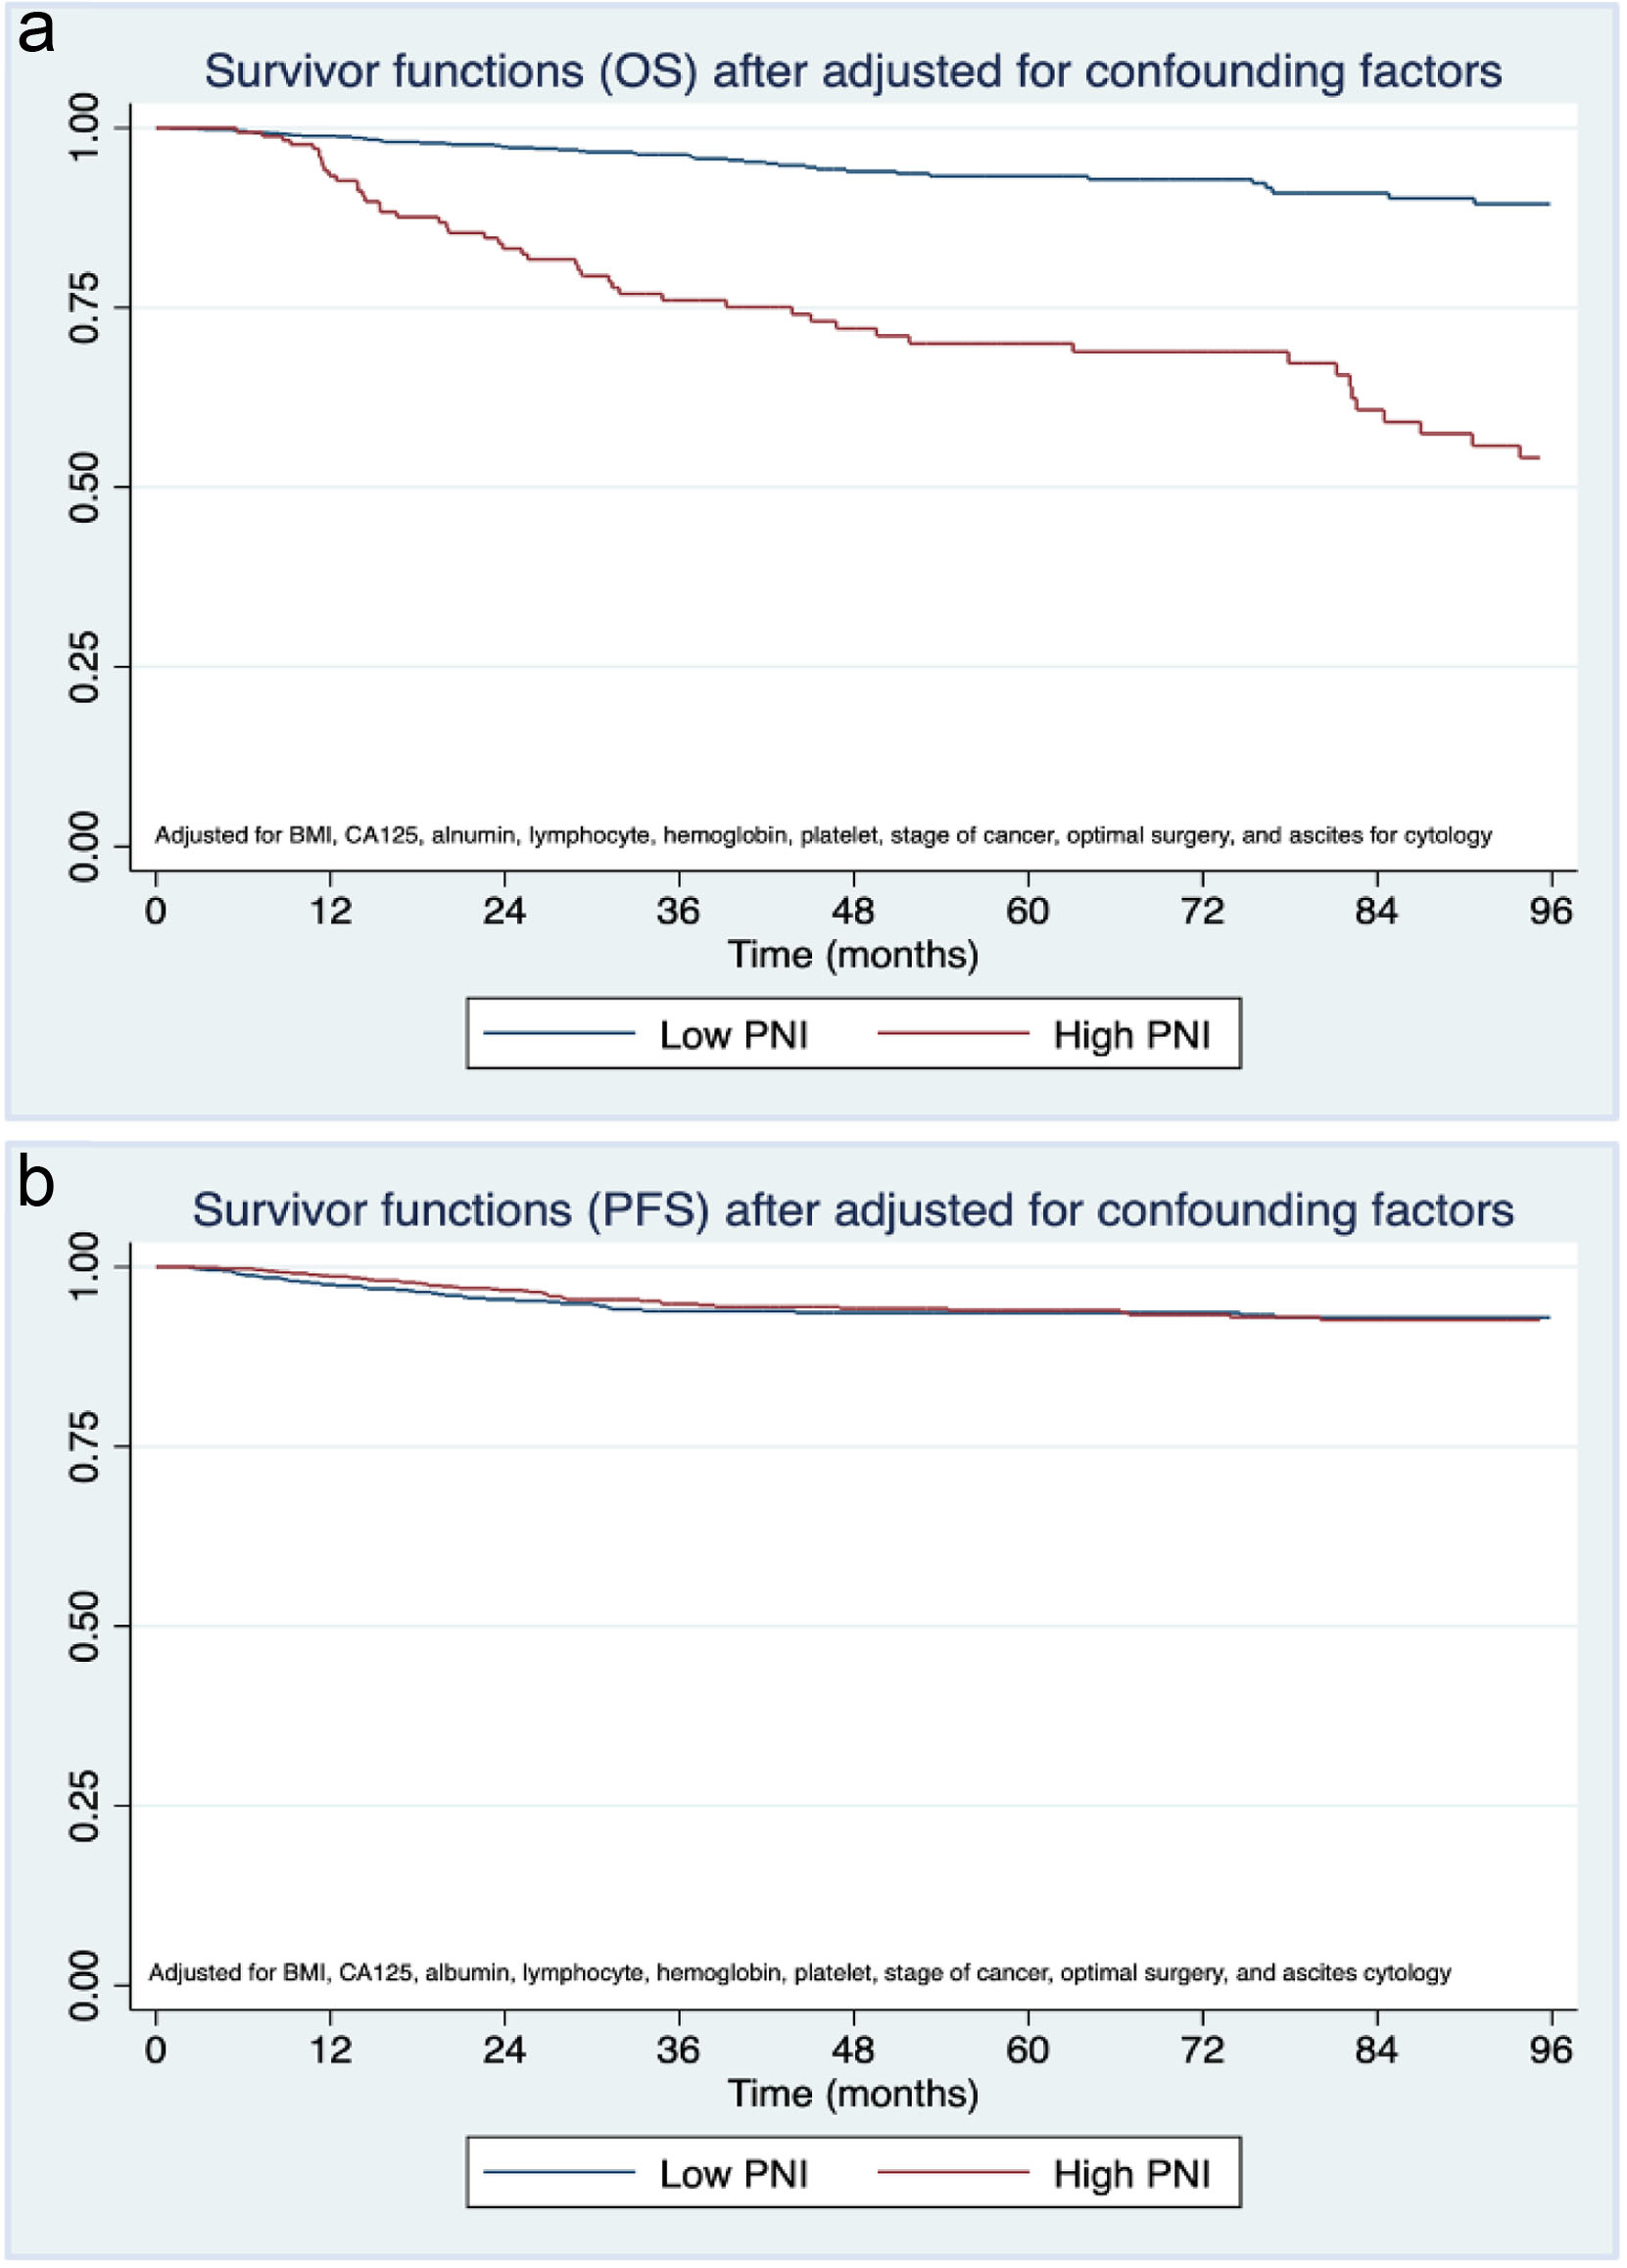
| After adjusted for confounding factors* | |||
| 5-year OS | 90.9 | 93.3 | 70.0 |
| 5-year PFS | 94.9 | 93.6 | 94.0 |
| Parameters | PFS | OS | ||
|---|---|---|---|---|
| HR (95% CI) | P-value | HR (95% CI) | P-value | |
| *Statistically significance (95% CI does not include 1). BMI: body mass index; CA125: cancer antigen 125; CI: confidence interval; FIGO: International Federation of Gynecology and Obstetrics; HR: hazard ratio; OS: overall survival; PFS: progression-free survival; PPNI: preoperative prognostic nutritional index. | ||||
| Univariate analysis | ||||
| PPNI (< 50 vs. ≥ 50) | 0.63 (0.43 - 0.92)* | 0.018 | 0.51 (0.35 - 0.75)* | 0.001 |
| Menopause (pre- vs. post-menopause) | 1.14 (0.75 - 1.72) | 0.543 | 1.20 (0.80 - 1.80) | 0.384 |
| BMI (≤ 25 kg/m2 vs. > 25 kg/m2) | 0.60 (0.39 - 0.93)* | 0.022 | 0.73 (0.48 - 1.10) | 0.129 |
| Underlying disease (no vs. yes) | 1.04 (0.63 - 1.71)* | 0.077 | 1.11 (0.68 - 1.81) | 0.673 |
| CA125 level (< 35 vs. ≥ 35 U/mL) | 1.99 (1.18 - 3.36)* | 0.009 | 2.46 (1.45 - 4.20)* | 0.001 |
| Albumin (< 3.5 g/dL vs. ≥ 3.5 g/dL) | 0.51 (0.31 - 0.84)* | <0.001 | 0.39 (0.25 - 0.62)* | < 0.001 |
| Lymphocyte (< 30% vs. ≥ 30%) | 0.60 (0.40 - 0.91)* | 0.015 | 0.54 (0.36 - 0.82)* | 0.003 |
| Hemoglobin (< 10 g/dL vs. ≥ 10 g/dL) | 0.57 (0.37 - 0.87)* | 0.009 | 0.54 (0.36 - 0.82)* | 0.004 |
| Platelet count (< 350 vs. ≥ 350 × 103 cells/mm3) | 1.69 (1.15 - 2.49)* | 0.008 | 1.89 (1.30 - 2.76)* | 0.001 |
| FIGO 2014 stage (I-II vs. III-IV) | 7.60 (5.11 - 11.30)* | <0.001 | 6.78 (4.59 - 10.02)* | < 0.001 |
| Optimal surgery (no vs. yes) | 0.22 (0.14 - 0.35)* | <0.001 | 0.17 (0.11 - 0.27)* | < 0.001 |
| Ascites cytology (negative vs. positive) | 2.75 (1.84 - 4.10)* | <0.001 | 3.21 (2.18 - 4.73)* | < 0.001 |
| Cycles of chemotherapy (≤ 3 vs. > 3) | 1.45 (0.53 - 3.94) | 0.465 | 0.49 (0.24 - 1.00) | 0.052 |
| Multivariate analysis | ||||
| PPNI (< 50 vs. ≥ 50) | 1.14 (0.70 - 1.86) | 0.590 | 0.89 (0.56 - 1.41) | 0.608 |
| BMI (≤ 25 kg/m2 vs. > 25 kg/m2) | 0.68 (0.42 - 1.11) | 0.125 | - | - |
| Underlying disease (no vs. yes) | 0.92 (0.53 - 1.62) | 0.783 | - | - |
| CA125 level (< 35 vs. ≥ 35 U/mL) | 1.61 (0.94 - 2.76) | 0.082 | 2.09 (1.21 - 3.62)* | 0.009 |
| Albumin (< 3.5 g/dL vs. ≥ 3.5 g/dL) | 1.47 (0.78 - 2.78) | 0.235 | 1.02 (0.57 - 1.84) | 0.932 |
| Lymphocyte (< 30% vs. ≥ 30%) | 0.81 (0.50 - 1.31) | 0.395 | 0.78 (0.49 - 1.26) | 0.315 |
| Hemoglobin (< 10 g/dL vs. ≥ 10 g/dL) | 0.95 (0.59 - 1.54) | 0.836 | 0.76 (0.49 - 1.20) | 0.247 |
| Platelet count (< 350 vs. ≥ 350) × 103 cells/mm3 | 1.08 (0.69 - 1.68) | 0.731 | 1.13 (0.72 - 1.76) | 0.594 |
| FIGO 2014 stage (I-II vs. III-IV) | 7.30 (4.38 - 12.17)* | <0.001 | 4.69 (2.79 - 7.89)* | < 0.001 |
| Optimal surgery (no vs. yes) | 0.71 (0.39 - 1.30) | 0.269 | 0.57 (0.32 - 1.01) | 0.054 |
| Ascites cytology (negative vs. positive) | 0.91 (0.52 - 1.58) | 0.733 | 1.08 (0.63 - 1.85) | 0.770 |
| Cycles of chemotherapy (≤ 3 vs. > 3) | - | - | 0.31 (0.15 - 0.65)* | 0.002 |