Figures
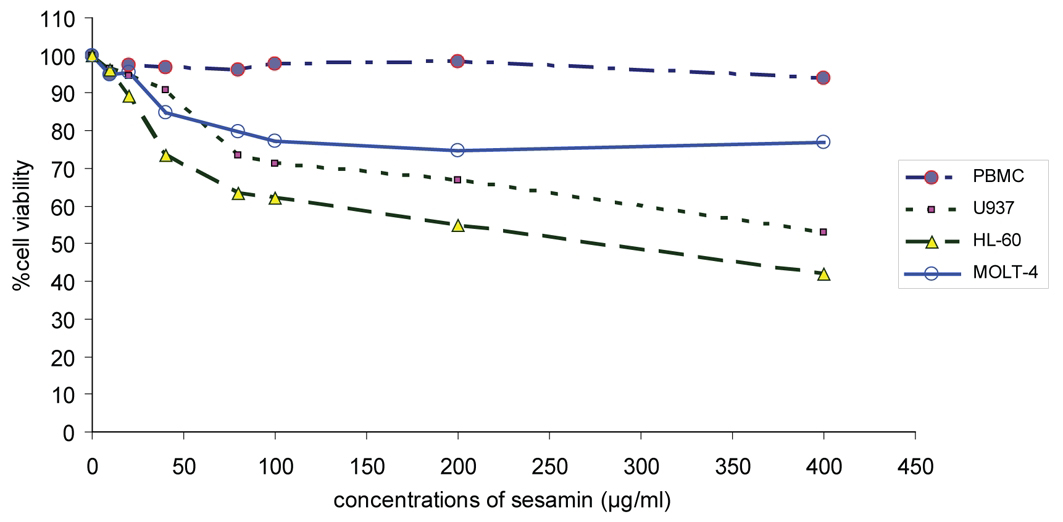
Figure 1. The effect of sesamin on cell cytotoxicity on human leukemic cell lines. Cell viability of human leukemic HL-60, U937 and Molt-4 cells were compared to PBMCs treated with sesamin at various concentrations by using MTT assay.
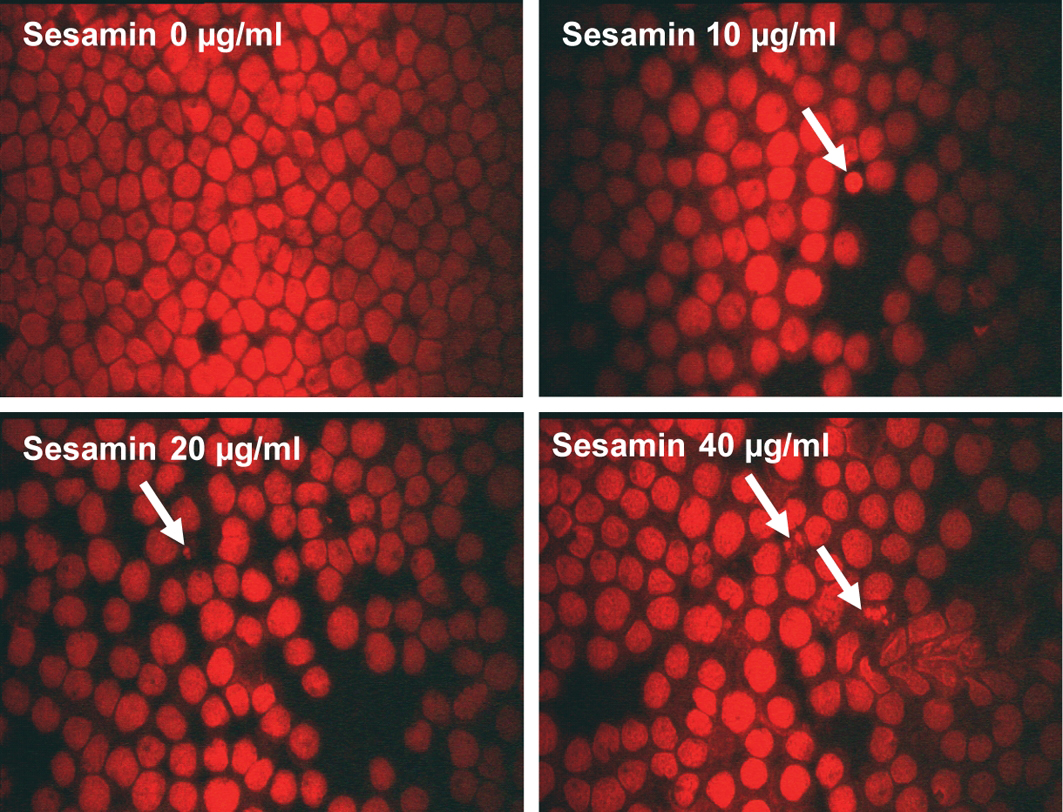
Figure 2. Cell morphology of U937 cells after treatment with sesamin. The cells were treated with sesamin at indicated concentrations for 24 h and stained with propidium iodide and examined under fluorescence microscope. Condensed nuclei and apoptotic bodies were marked with arrows. Magnificaiton x 400.
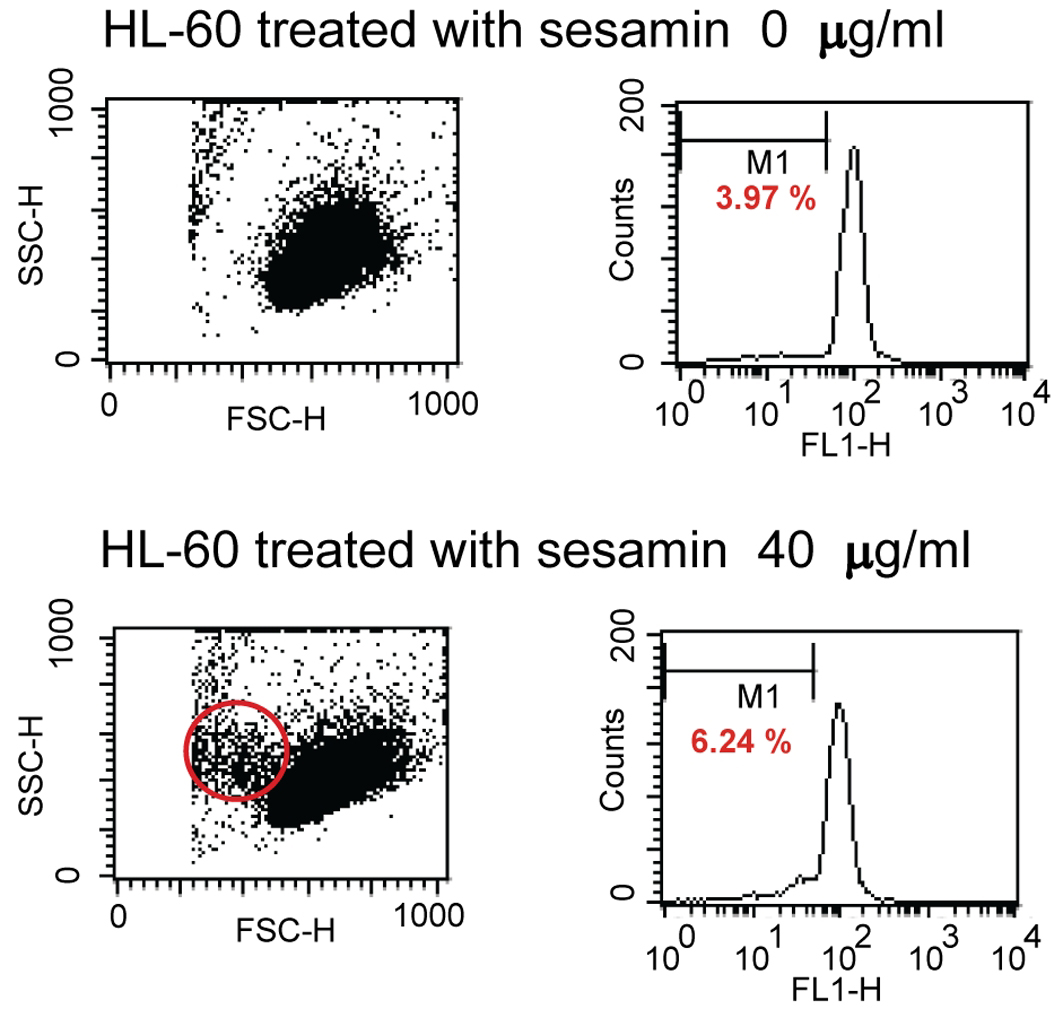
Figure 3. Dot plots and histograms of HL-60 cells treated with sesamin. The cells were stained with 40 nM of 3,3'-dihexyloxacarbocyanine iodide and detected by flow cytometry. M1 area represents percentage of cells with decreased MTP. Circle area is cells with smaller size which are apoptotic cells.
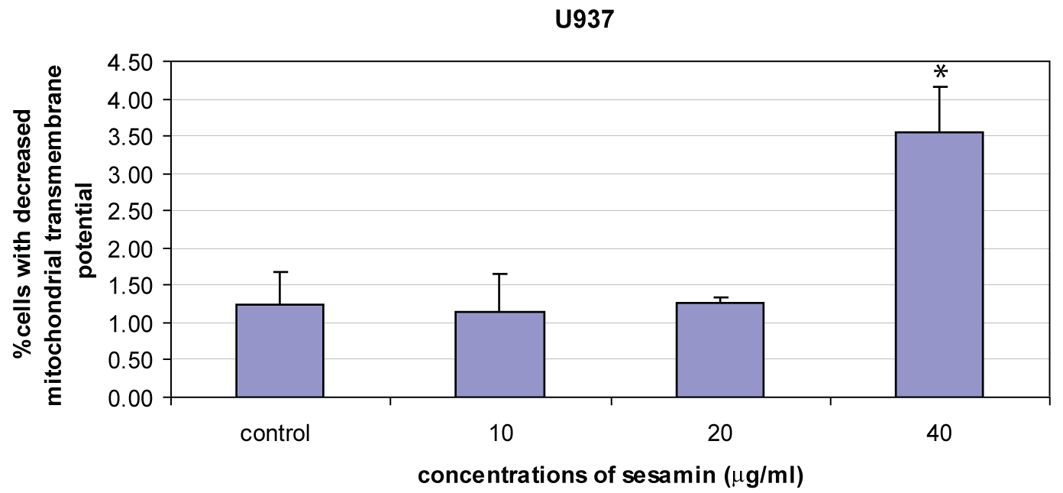
Figure 4. The reduction of mitochondrial transmembrane potential of U937 cells treated with sesamin for 4 h. Percent cells with reduced MTP were increased in a dose response manner. The data were means ± S.E.M. of three independent experiments performed in duplicate. p < 0.05, (*) significant difference from control.
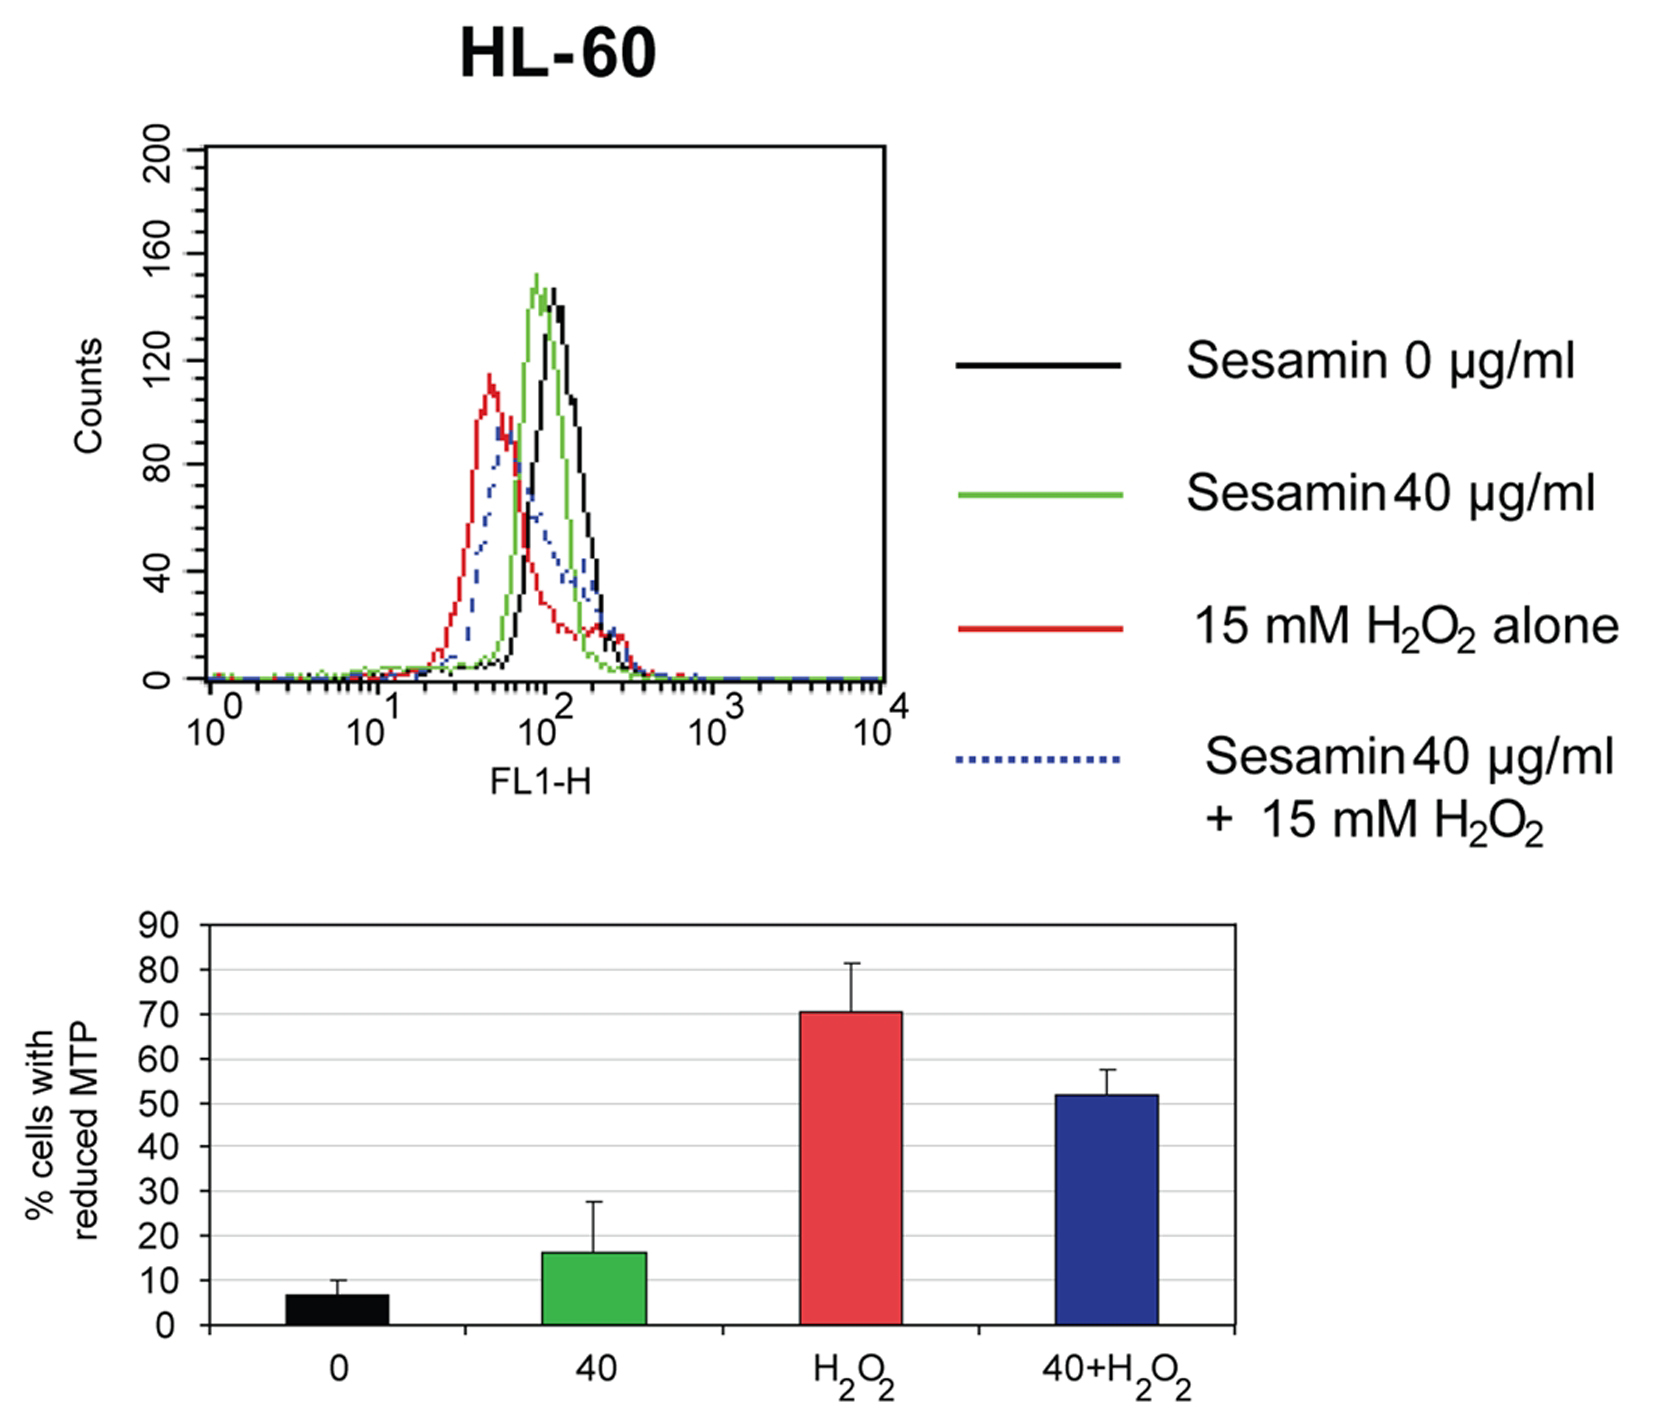
Figure 5. The reduction of MTP of HL-60 cells when treated with sesamin for 1 h. The histograms of cells when treated with H2O2, sesamin at 40 ug/ml and combined treatment (upper panel) and percentages of cells with decreased MTP in each condition (lower panel) are shown.
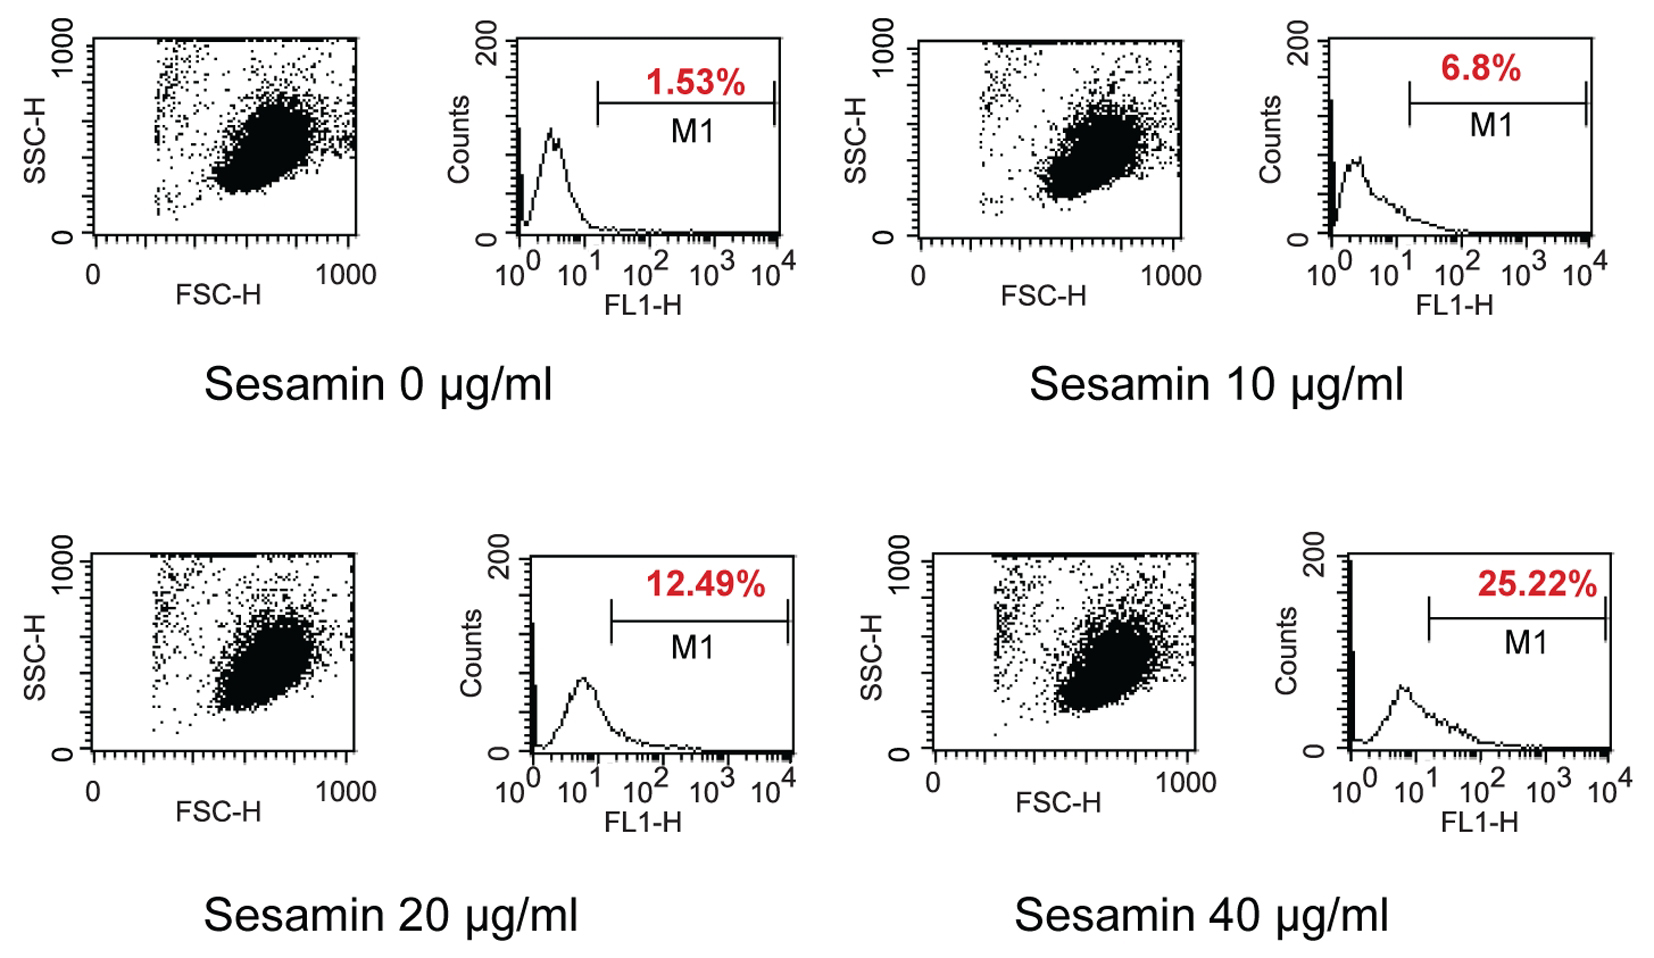
Figure 6. The effect of sesamin treatment on ROS production in human leukemic cells. Dot plot and histogram of HL-60 cells treated with sesamin at indicated concentrations for 4 h. The cells that stained with DCFH-DA were cells producing ROS and existed under area M1. It was in a dose response manner of increasing in production of free radicals.
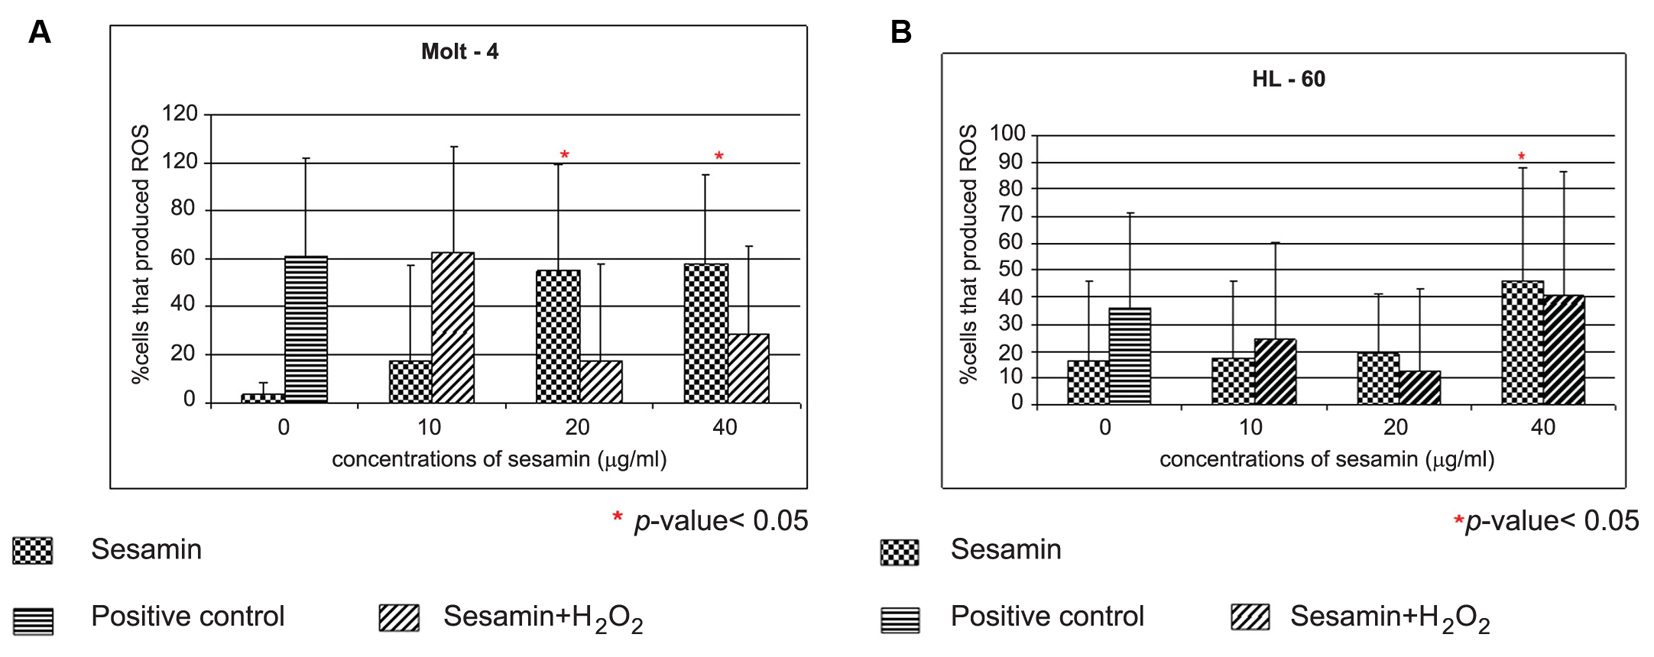
Figure 7. The effect of sesamin on ROS production in Molt-4 cells and HL-60. The Molt-4 (A) and HL-60 (B) cells were treated with sesamin at indicated concentrations for 4 h and in combined treatment with H2O2. Positive control was the treatment with 15 mM H2O2 alone. The data were performed in three independent experiments and represented as mean ± S.E.M. p < 0.05 (*) is considered as significant difference compared to control.
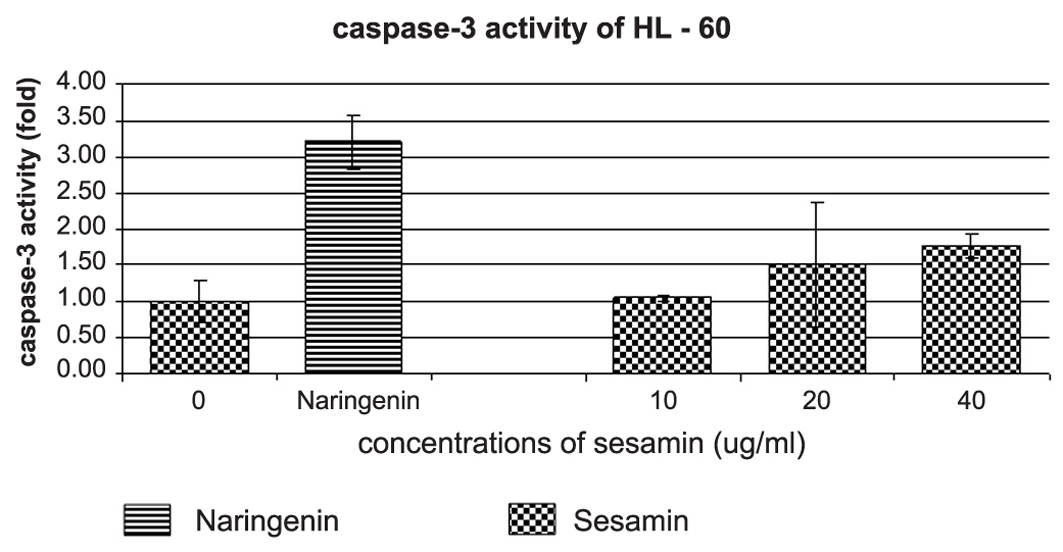
Figure 8. The effect of sesamin on caspase-3 activity of HL-60 cells. An increase of caspase-3 activity of HL-60 cells treated with sesamin at indicated concentrations are determined by DEVD-AMC substrate. Naringenin at 250 ug/ml was used as positive control for caspase-3 activity induction in HL-60 cells.
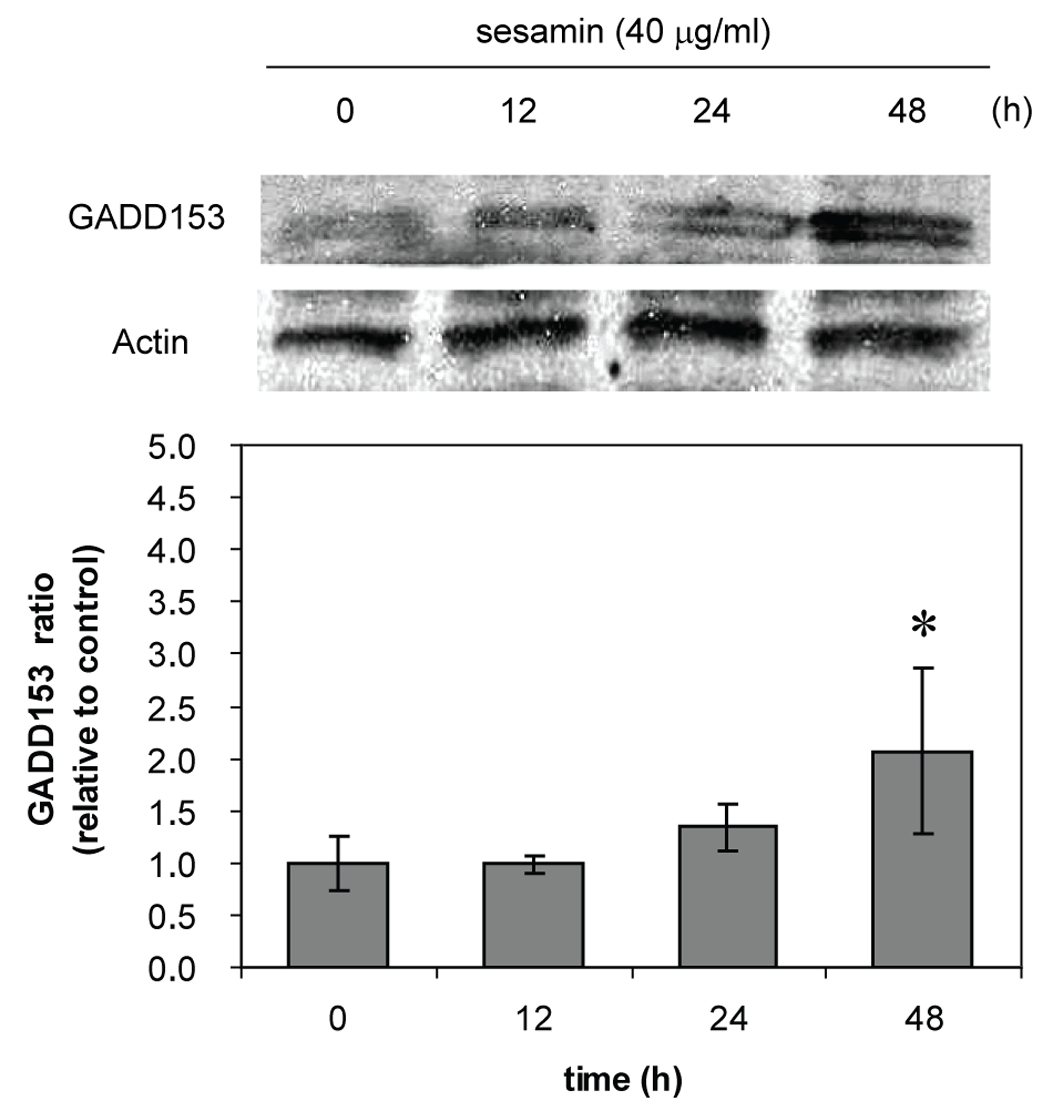
Figure 9. GADD153 expression of sesamin-treated HL-60 cells. The cells were treated with sesamin 40 ug/ml at indicated times. The upper panel shows the bands from immunoblot of GADD153 compared to actin as a constitutive protein. The lower panel represents the data as mean ± S.E.M. p < 0.05 (*) considered significant difference compared to control.