Figures
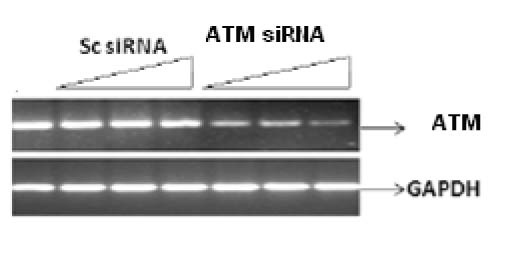
Figure 1. Silencing of ATM gene at transcriptional level by their specific RNA in a dose dependant manner. Cell line was infected with 25 nM, 50 nM and 100 nM of siRNA against ATM for 48 h. Scrambled RNA was used indicating non-specific targeting. Results were analyzed by reverse transcriptase PCR.
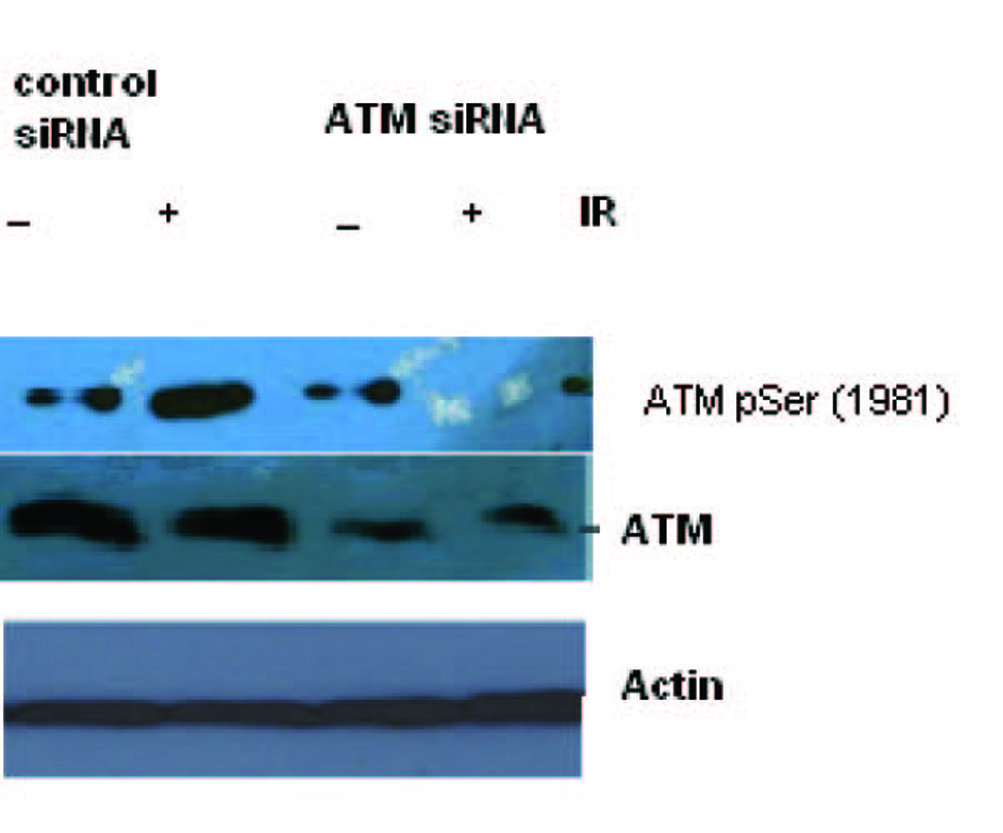
Figure 2. Total cell lysate was transduced with siRNA ATM and used for Western blot analysis for ATM. The blotting shows the appearance and activation of the ATM protein after irradiation in Scrambled RNA treated cells but not in the SiRNA treated cells.
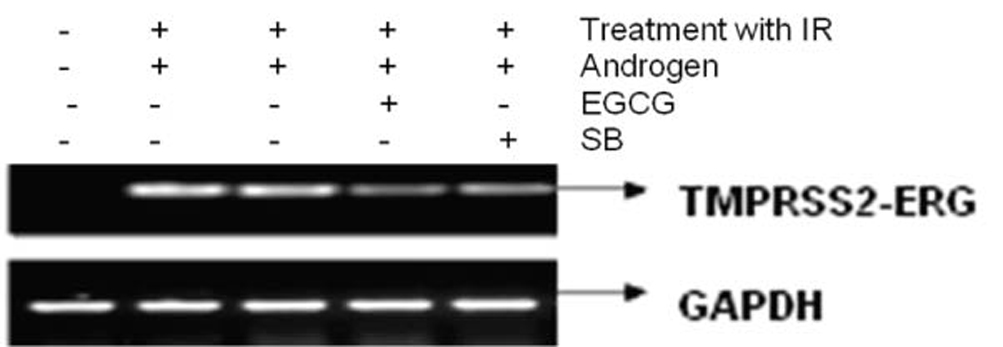
Figure 3. The figure shows the attenuation of expression of the fusion transcript in LNCaP cell line after treatment with EGCG and SB.
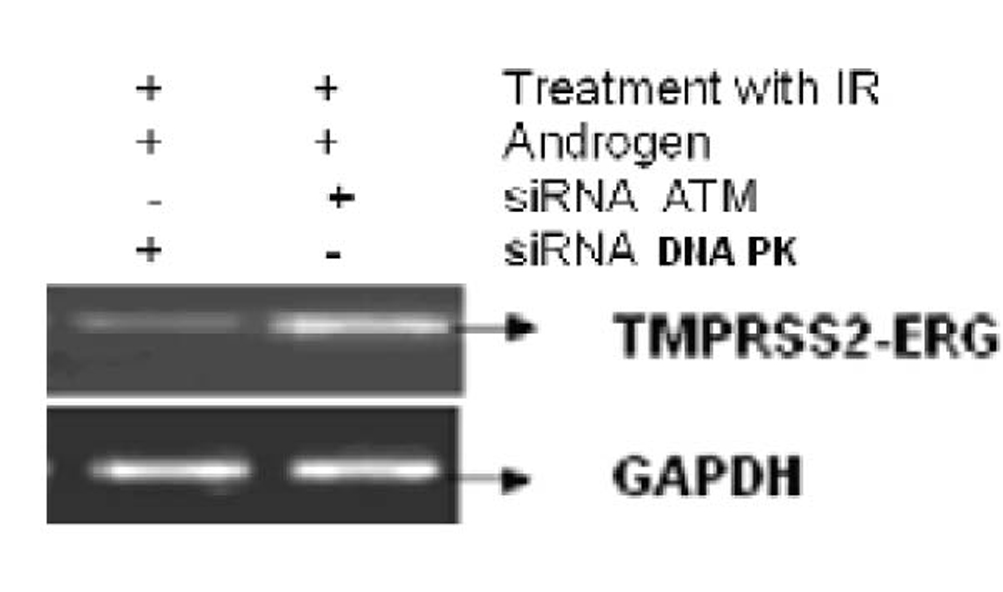
Figure 4. The figure shows the correlation of ATM and DNA-PK in generation of fusion transcripts. LNCaP cell line was treated with siRNA against ATM and DNA-PK successively.
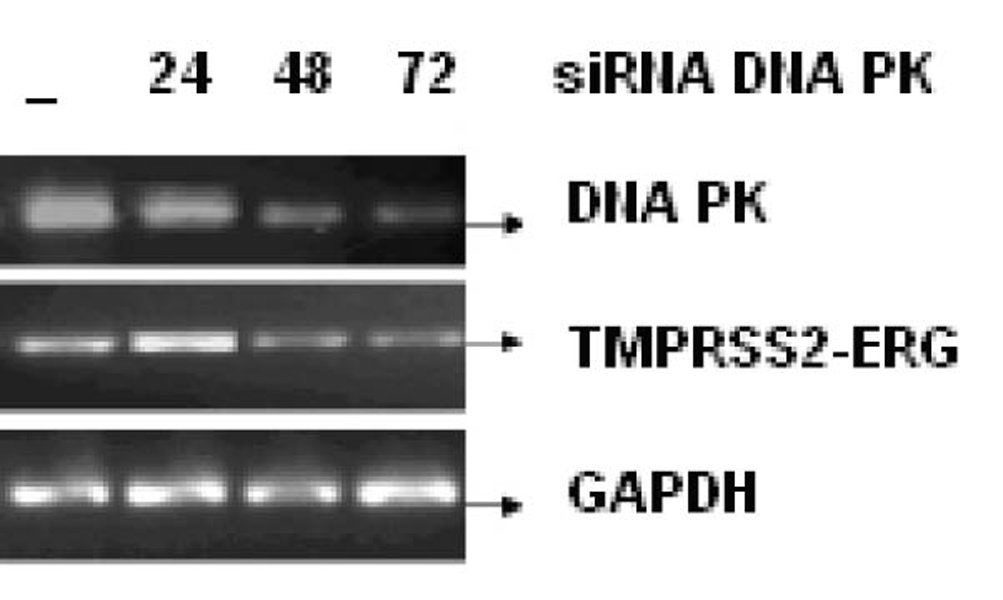
Figure 5. LNCaP cell line was infected with or without 25 nM, 50 nM and 100 nM of siRNA against DNA PK for 24, 48 and 72 h respectively. The mRNA transcript of fusion gene and DNA-PK was reverse transcribed. GAPDH was used as a control.
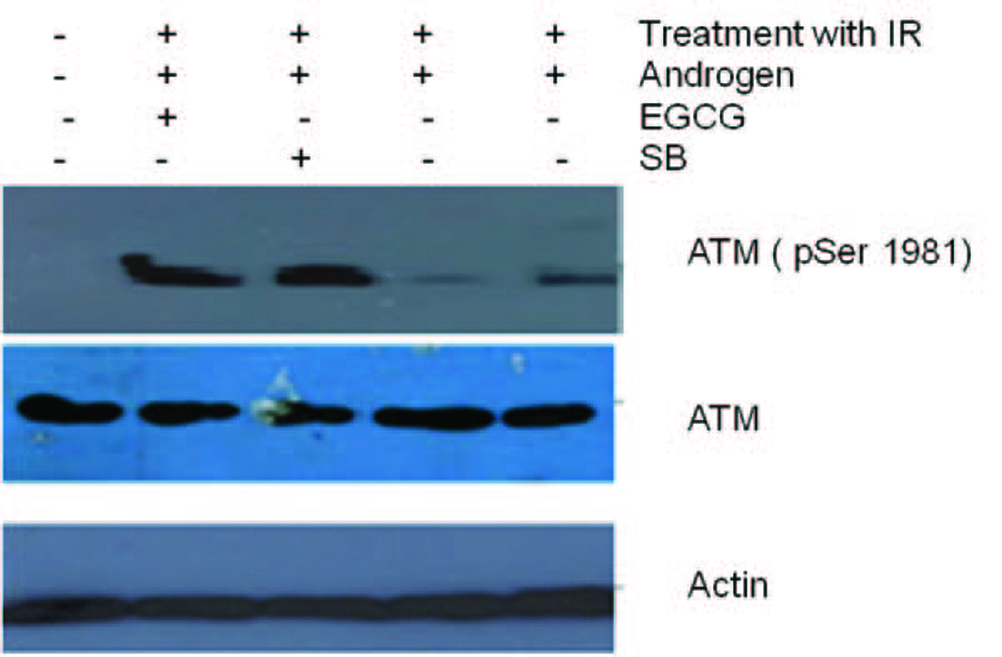
Figure 6. Total cell lysates from cells were irradiated and pre-treated with androgen. Later the cells treated with 100 µM EGCG for 48 and 96 h were subjected to Western blotting for ATM and their activation respectively. Actin is used as a control. Figure shows an ablation of TMPRSS2-ERG after treatment of cell line with DHT and radiation. However, post radiation treatment of Cell line with EGCG and SB stimulated ATM phosphorylation.