Figures
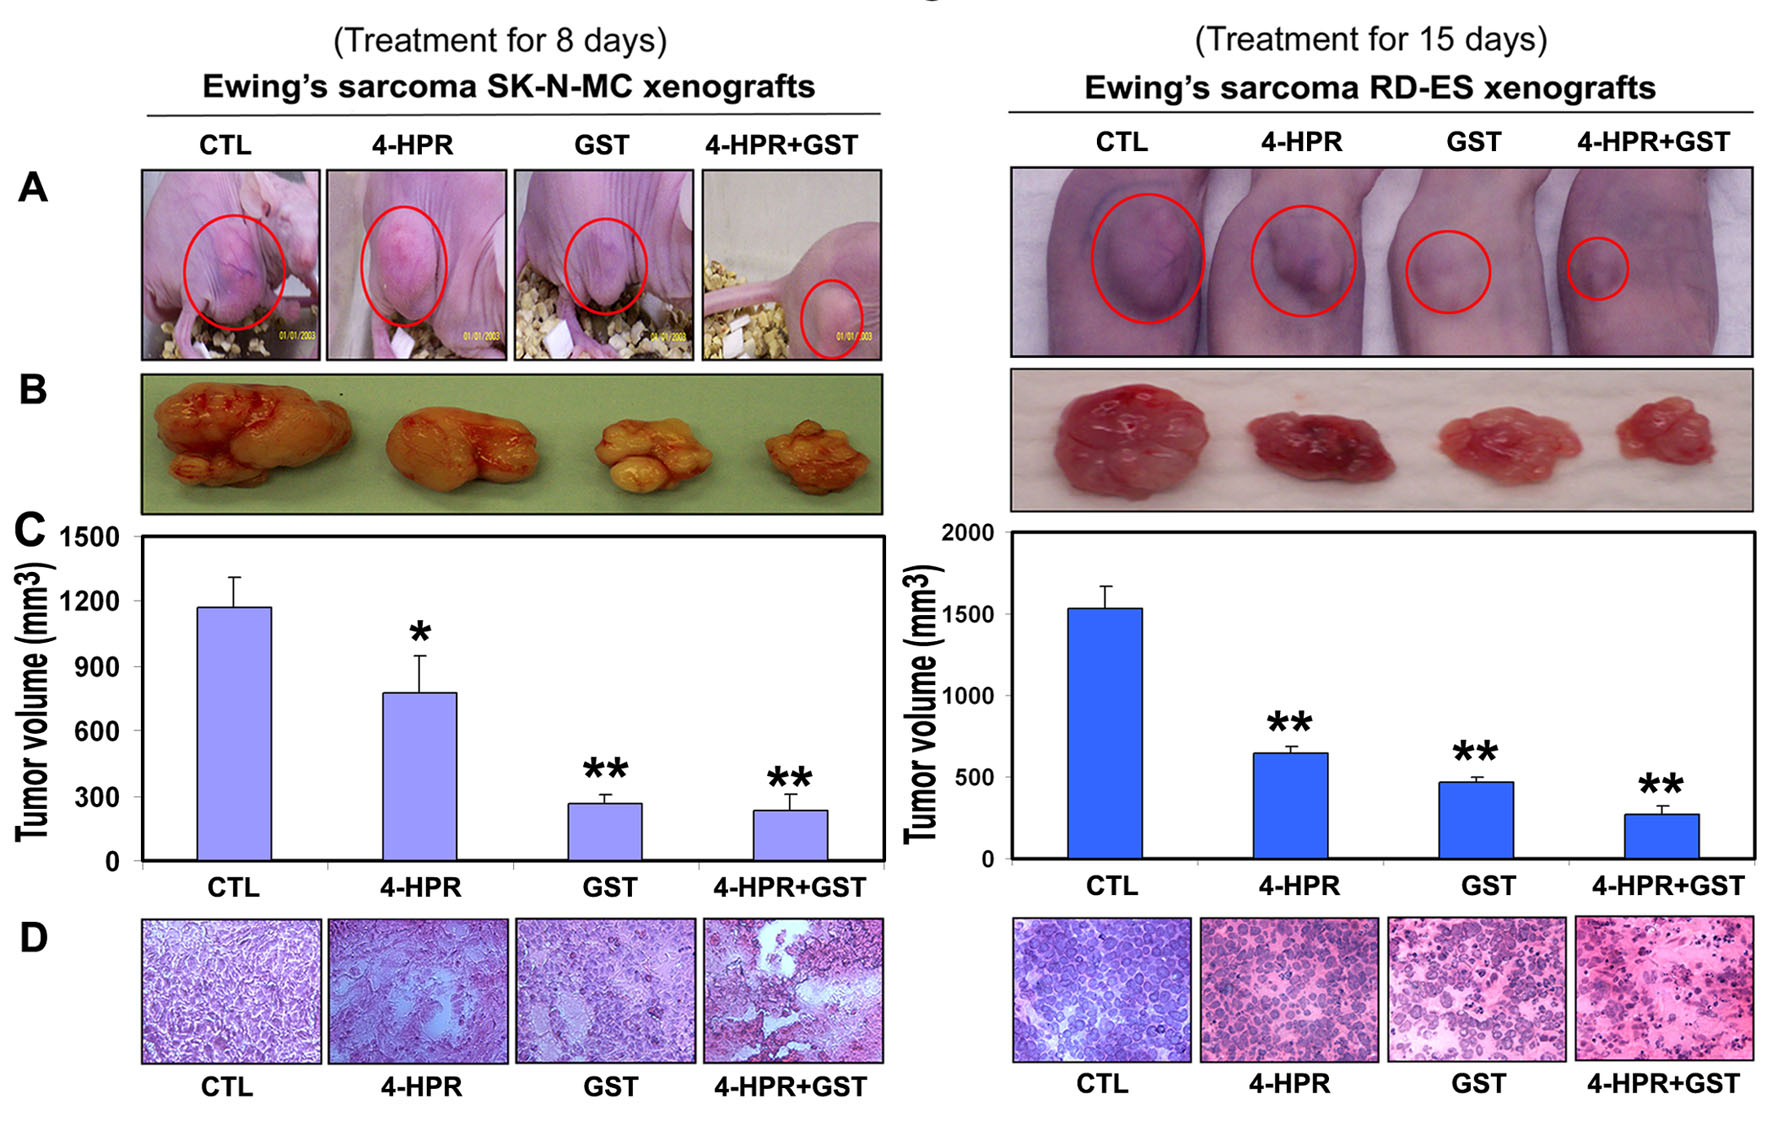
Figure 1. Regression of Ewing’s sarcoma and histopathological changes in xenografts. (A) Mice with SK-N-MC and RD-ES xenografts; (B) representative tumors; (C) tumor volume; and (D) histopathological changes after the treatments. Mice with xenografts were treated for 8 or 15 days. Treatments: CTL, 4-HPR (20 µg/kg/day), GST (2 mg/kg/day), and 4-HPR (20 µg/kg/day) plus 4-h later GST (2 mg/kg/day). We used 6 animals per group (*P < 0.05 or **P < 0.001).
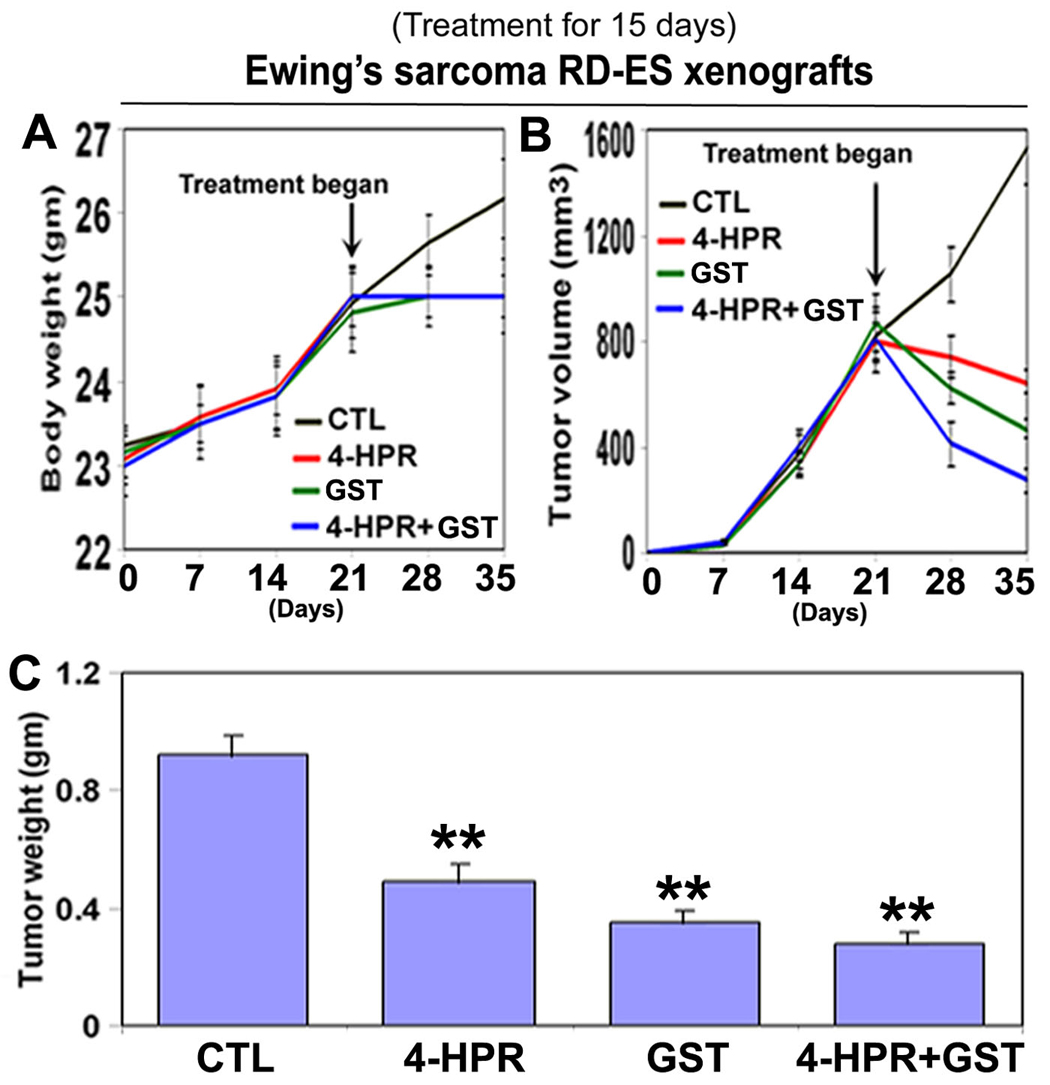
Figure 2. Time-dependent reduction in animal body weight, tumor volume, and tumor weight in RD-ES xenografts following treatments. Treatments for 15 days: control (CTL), 4-HPR (20 µg/kg/day), GST (2 mg/kg/day), and 4-HPR (20 µg/kg/day) plus 4-h later GST (2 mg/kg/day). (A) Body weight changes; (B) tumor volume changes; and (C) tumor weight changes after therapies. Combination therapy showed best efficacy in reducing animal body weight and tumor volume. We used 6 animals per group (*P < 0.05 or **P < 0.001).
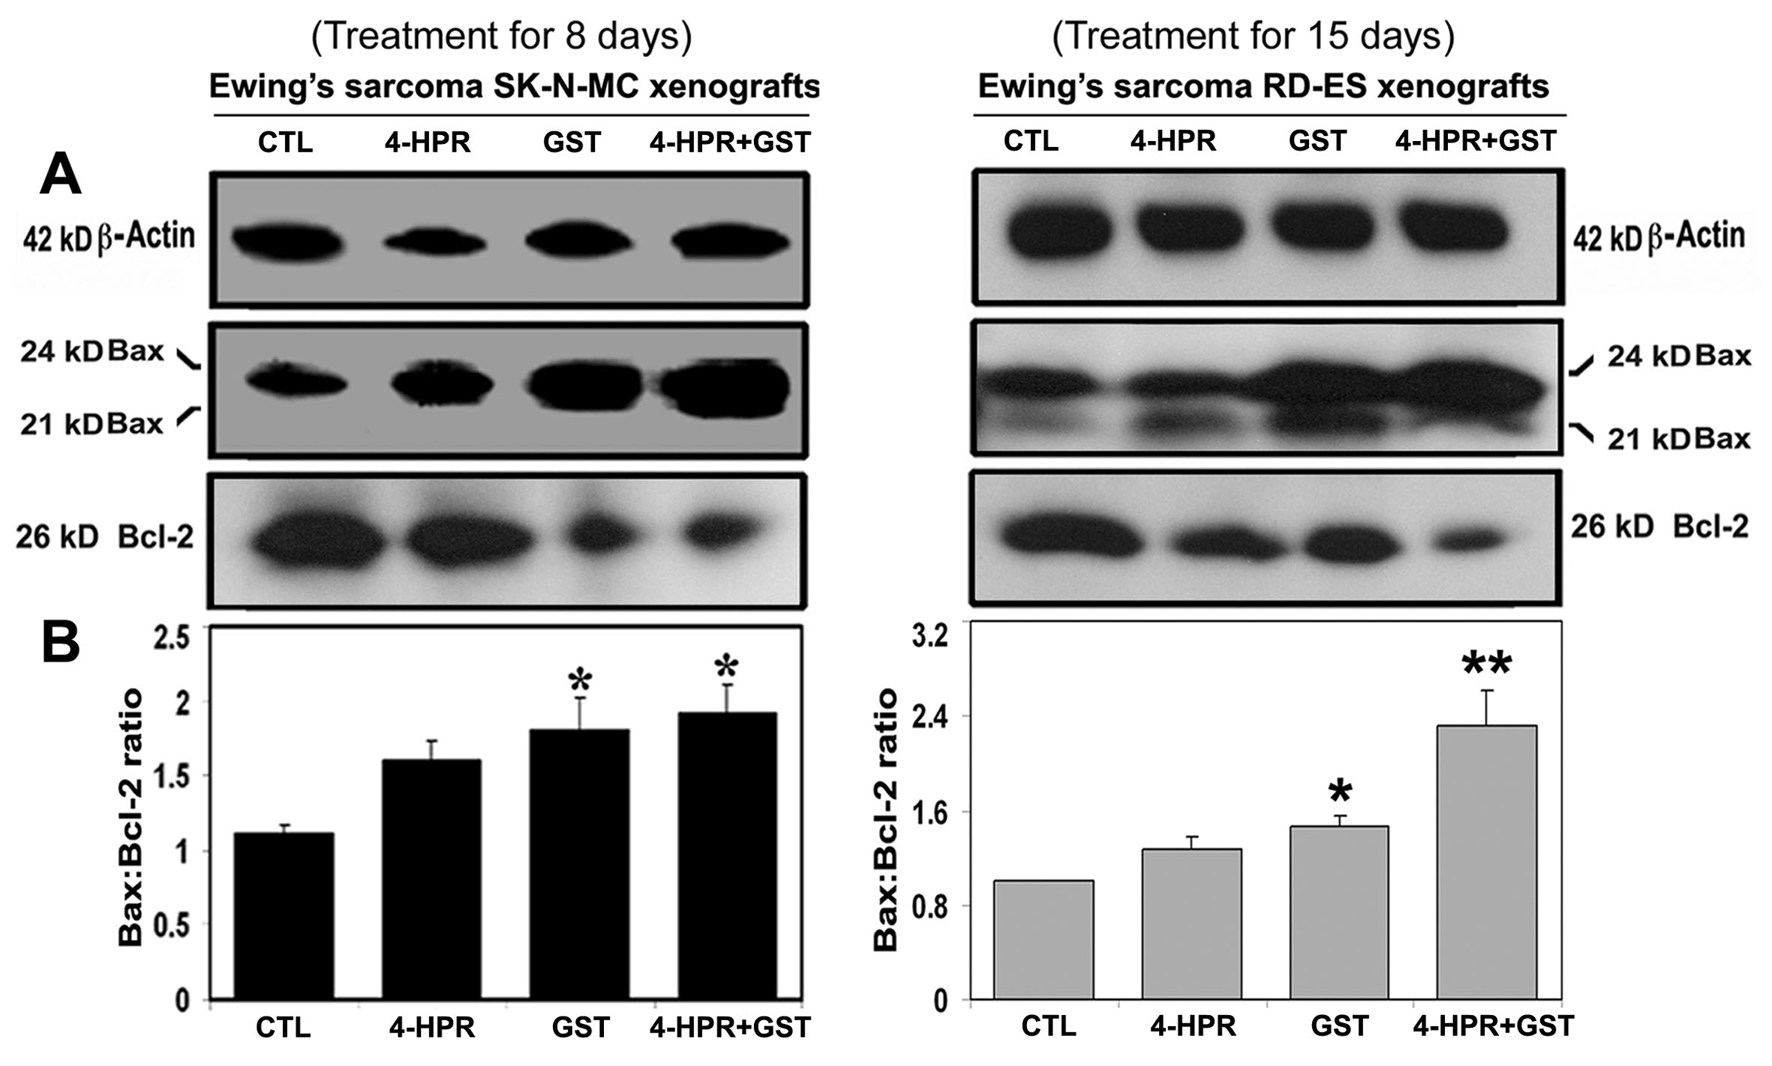
Figure 3. Western blotting for determination of Bax : Bcl-2 ratio in Ewing’s sarcoma SK-N-MC and RD-ES xenografts. Treatments for 8 or 15 days: CTL, 4-HPR (20 µg/kg/day), GST (2 mg/kg/day), and 4-HPR (20 µg/kg/day) plus 4-h later GST (2 mg/kg/day). (A) Representative Western blots (n ≥ 3) showed expression of 42 kD β-actin, 21 and 24 kD Bax, and 26 kD Bcl-2, and (B) changes in Bax : Bcl-2 ratio in SK-N-MC and RD-ES xenografts. Significant difference between CTL and a treatment was indicated by *P < 0.05 or **P < 0.001.
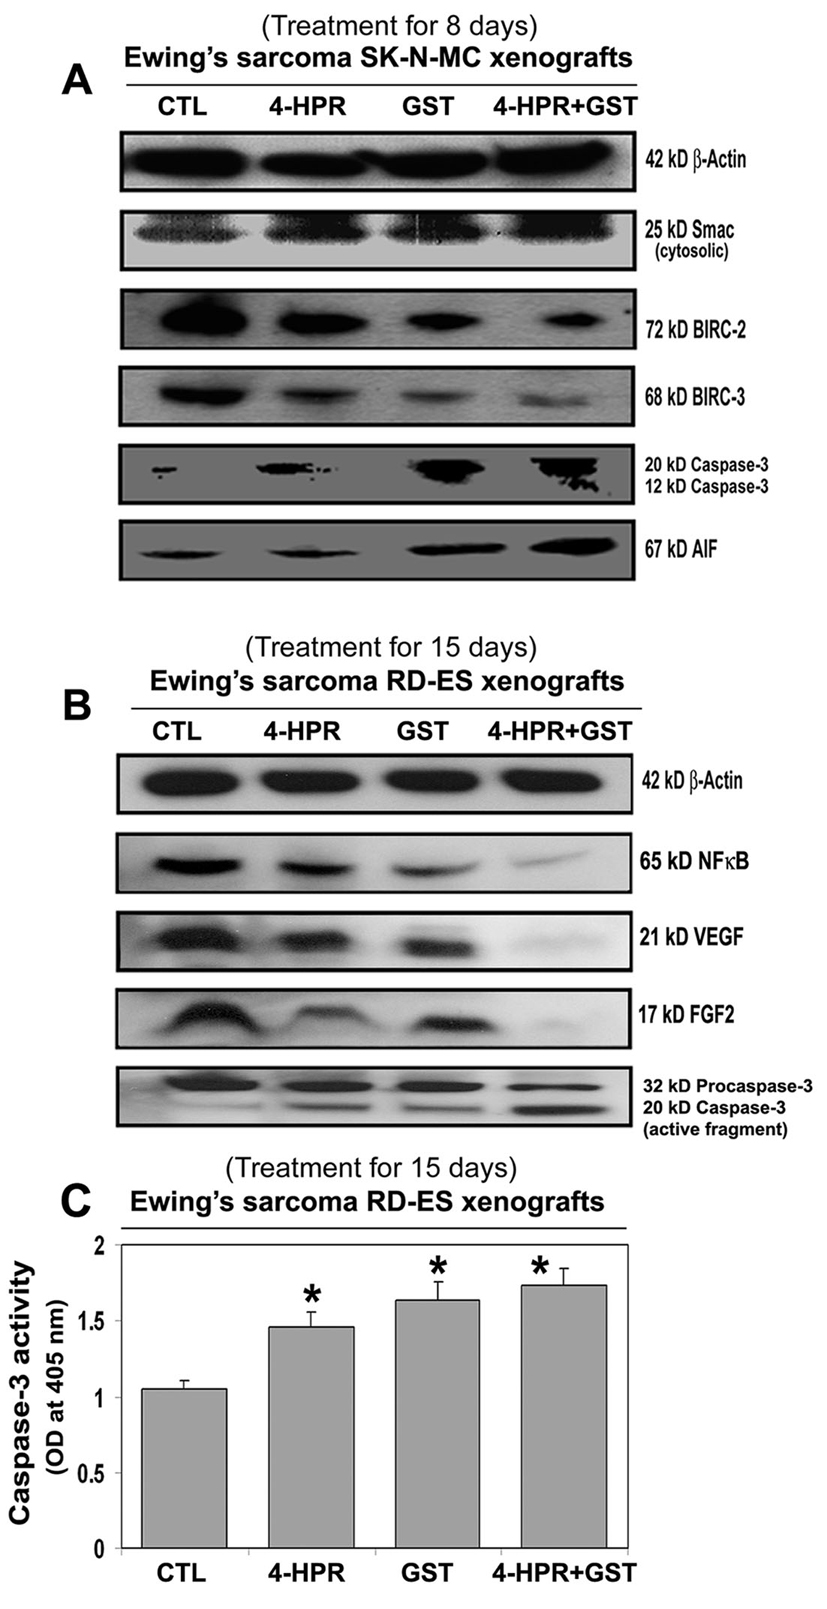
Figure 4. Changes in expression of pro-apoptotic and anti-apoptotic proteins in Ewing’s sarcoma xenografts. Treatments for 8 or 15 days: CTL, 4-HPR (20 µg/kg/day), GST (2 mg/kg/day), and 4-HPR (20 µg/kg/day) plus 4-h later GST (2 mg/kg/day). Representative Western blots (n ≥ 3) showed expression of (A) 42 kD β-actin, 25 kD Smac/Diablo, 72 kD BIRC-2, 68 kD BIRC-3, 20 and 12 kD active caspase-3, and 67 kD AIF in SK-N-MC xenografts; and (B) 42 kD β-actin, 65 kD NF-κB, 21 kD VEGF, 17 kD FGF2, and 32 and 20 kD caspase-3 in RD-ES xenografts. (C) Colorimetric assay for determination of caspase-3 activity in RD-ES xenografts. Significant difference between CTL and a treatment was indicated by *P < 0.05 or **P < 0.001.
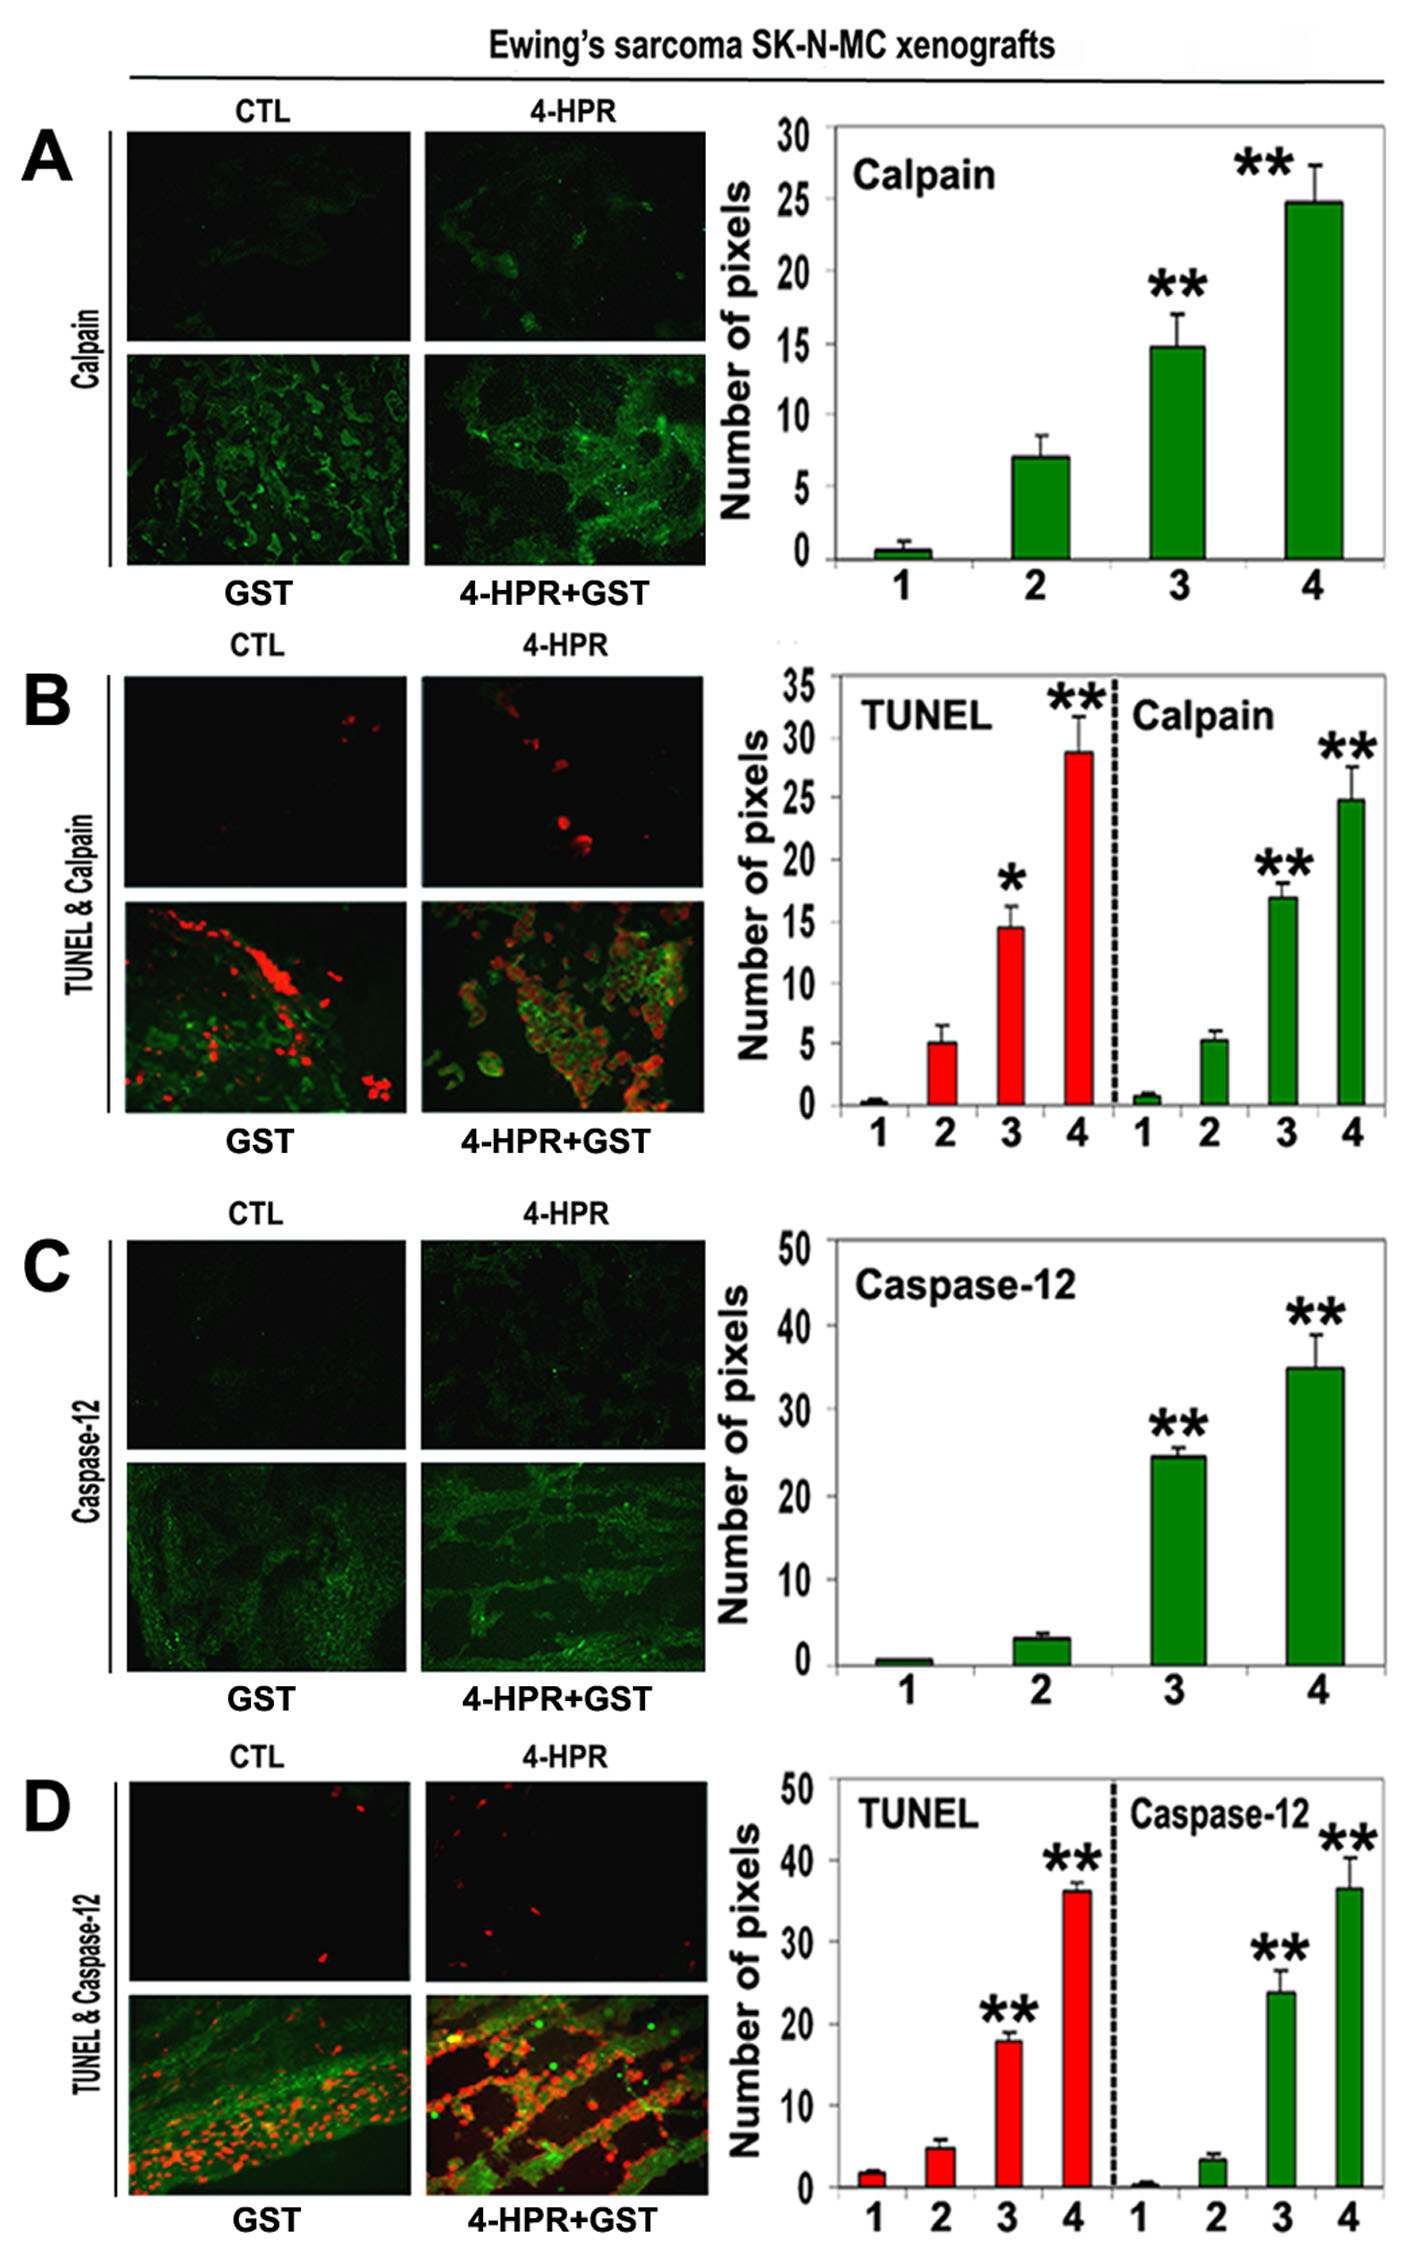
Figure 5. In situ single and double immunofluorescent labelings to detect increases in expression of calpain and caspase-12 during apoptosis (TUNEL-positive cells) in SK-N-MC xenografts. Treatments for 8 days: CTL, 4-HPR (20 µg/kg/day), GST (2 mg/kg/day), and 4-HPR (20 µg/kg/day) plus 4-h later GST (2 mg/kg/day). (A) Combination therapy most significantly increased calpain expression in SK-N-MC xenografts. (B) Calpain expression in TUNEL-positive cells. (C) Combination therapy most significantly increased caspase-12 expression in SK-N-MC xenografts. (D) Caspase-12 expression in TUNEL-positive cells. In bar graphs: 1 = CTL, 2 = 4-HPR, 3 = GST, and 4 = 4-HPR plus GST. Significant difference between CTL and a treatment was indicated by *P < 0.05 or **P < 0.001.
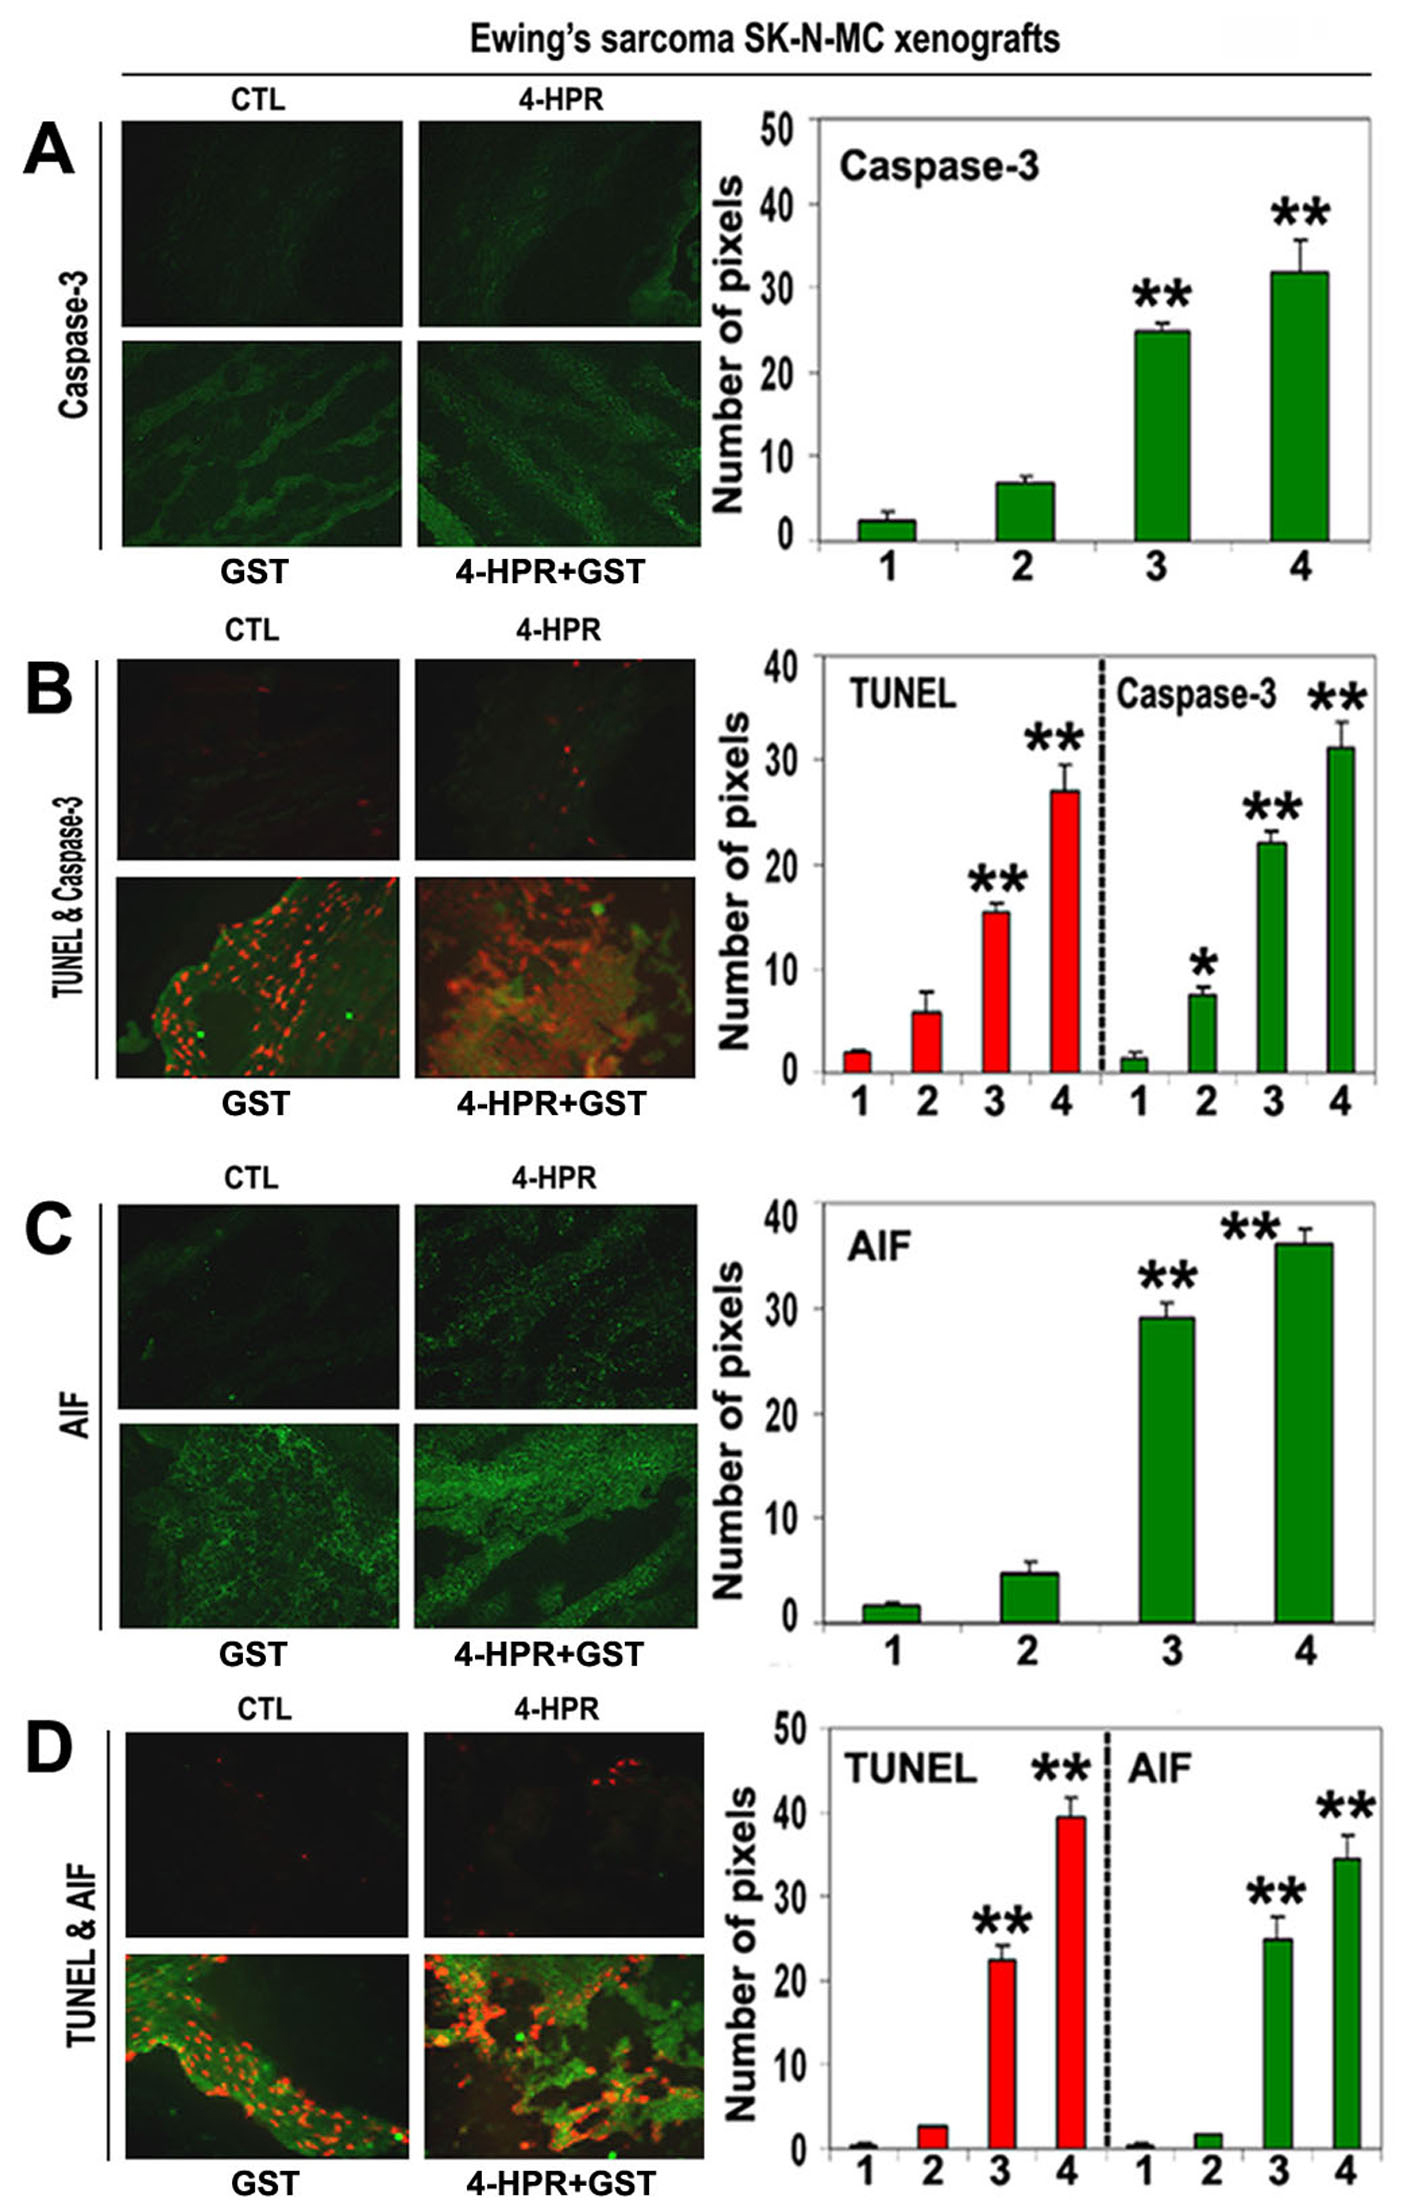
Figure 6. In situ single and double immunofluorescent labelings to detect increases in expression of caspase-3 and AIF during apoptosis (TUNEL-positive cells) in SK-N-MC xenografts. Treatments for 8 days: CTL, 4-HPR (20 µg/kg/day), GST (2 mg/kg/day), and 4-HPR (20 µg/kg/day) plus 4-h later GST (2 mg/kg/day). (A) Combination therapy most significantly increased caspase-3 expression in SK-N-MC xenografts. (B) Caspase-3 expression in TUNEL-positive cells. (C) Combination therapy most significantly increased AIF expression in SK-N-MC xenografts. (D) AIF expression in TUNEL-positive cells. In bar graphs: 1 = CTL, 2 = 4-HPR, 3 = GST, and 4 = 4-HPR plus GST. Significant difference between CTL and a treatment was indicated by *P < 0.05 or **P < 0.001.